
Information security is a dynamic science, and staying up to date with it is no easy task. New technologies emerge all the time, and with them come new vulnerabilities, new flaws, and different types of attacks that appear in the blink of an eye.
In this context, we have APIs (Application Programming Interfaces). This mechanism allows two programs to communicate following a set of rules and protocols without needing to know each other beforehand. It's known that over 90% of developers use APIs; often, you don't see them, you don't notice them, but they're behind the scenes, doing their job. However, it's a targeted layer and susceptible to attacks from malicious users.
Given this context, APIsec University emerges as an educational institution focused on API security, which makes this very clear on its website: APIsec University was founded with a simple yet powerful mission: to make world-class API security education accessible to everyone, regardless of their background or financial situation.
APIsec offers certified courses, lectures, workshops, tools, and several free courses. I've already taken almost all of them. 😎
Check them out, here:
When we start an API penetration test, the first thing we analyze is the documentation: knowing what the API does, its workflow, and its parameters is fundamental to proceeding with the tests. Then, we perform a reconnaissance of the API's resources, endpoints, token type, etc., and based on this, we can create a JSON file, called a Collection, that includes requests, authorizations, HTTP headers, and even examples of responses to specific requests.
But not all that glitters is gold. We find APIs with incomplete documentation, or no documentation at all; APIs that use other APIs; APIs with forgotten versioning; and in these cases, we have to perform reverse engineering on the application to create a Collection file, a kind of mapping of the entire API flow.
To help us with this task, mapping the flow of an API, APIsec created a tool called BOLT, an add-on for Google Chrome.
APIsec BOLT automatically discovers APIs by capturing real application traffic directly from your browser — without proxies, agents, or configuration.
As you interact with an application, BOLT identifies API endpoints, generates OpenAPI (Swagger) specifications, and provides a streamlined path to analyze and test those APIs using APIsec.ai.
But this tool can do much more:
Build the API inventory you're missing from real, observed behavior. Seed test plans and automation with live endpoints + parameters. Accelerate BOLA/BOPLA hunts by mapping object/parameter access quickly. Generate specs for governance when teams haven't published OpenAPI.
The add-on is available on the Chrome Web Store:
More information about her:
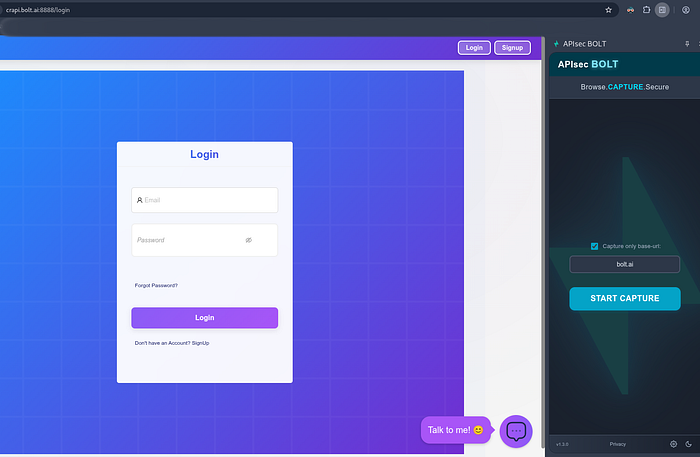
Once Bolt is installed in Chrome, access the website of your interest; in this case, I installed a vulnerable application called crAPI, available at:
With the online crAPI, activate BOLT. When BOLT starts, it automatically detects the domain currently in your browser. If you want BOLT to capture only traffic from that domain, check the "Capture only base-url" box. If you want to capture all traffic, uncheck this box. Now just click the "Start Capture" button to start BOLT.
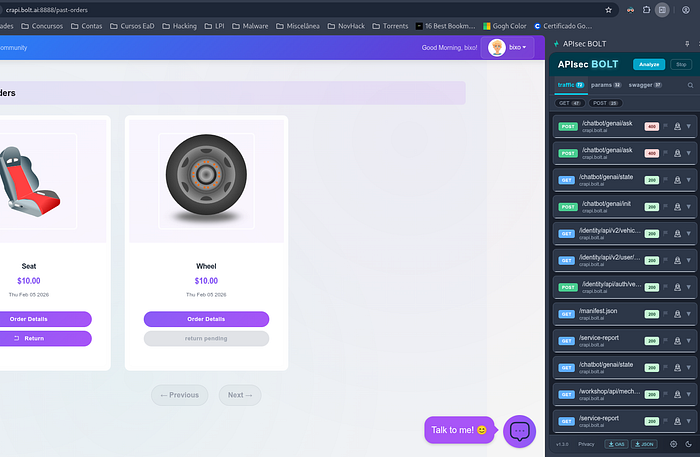
As you browse the site, fill out forms, add purchases, etc., BOLT will capture all traffic coming from the domain, as simple as that, without needing a proxy.
Once finished, click "Stop" to end the capture. Note: The "Stop" button now becomes the "New" button, should you wish to start a new capture.
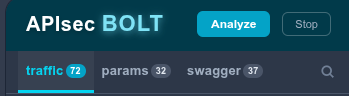
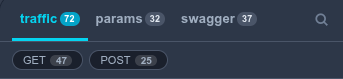
We have three tabs in BOLT: traffic, params, swagger, and search.
In the "Traffic" tab, we have all the captured traffic, as the name suggests, but we also have two more options, GET and POST, which can be selected if you want to display only one of the suggested methods. Here we can see that we have 72 requests divided into 47 GETs and 25 POSTs:
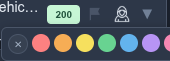
In the right corner of each request, we can see three symbols:

- Flag, a color marker to highlight specific requests:

2. Hacker, to open the manipulator. Here you can edit the request as you see fit, in both "Form" and "Raw" formats:
- to choose HTTP methods;
- to delete or to add parameters;
- to delete, to add, or to modify headers;
- to add and to remove body content.
After editing, click "Send", and you will see the response below in "Response".

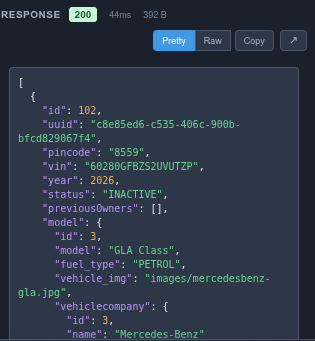
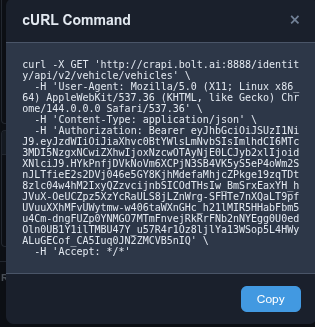
We can export the request as a cURL command by clicking the "cURL" button, of course:
3. A downward-pointing arrow allows you to expand the request and view its full content.
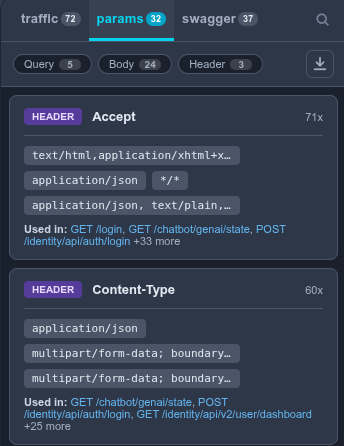
The following tab, "Params," shows the parameters involved in the requests:
You can sort them by Query, Body, or Header.
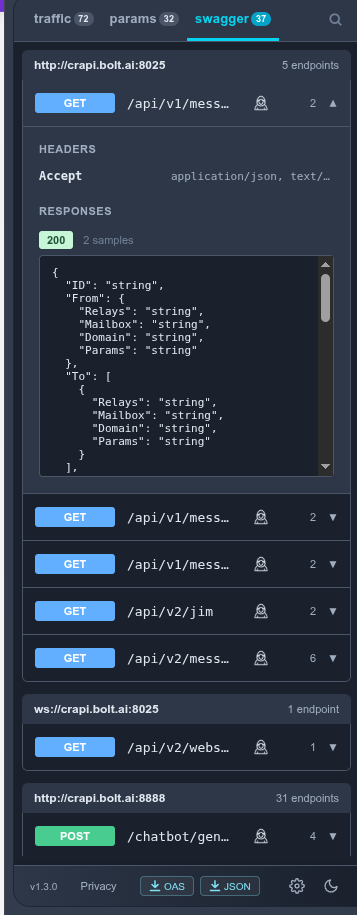
The next tab is "Swagger" (UI), a list of resources available in the API and the operations that can be called on those resources.
In the right corner of each request, we can see two symbols:

The hacker and the downward-pointing arrow, whose functions we already know.
Finally, we have the "Analyze" button, which, when clicked, will create a new tab called "apis".
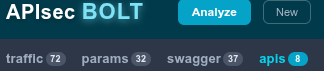
This BOLT function groups requests by service.
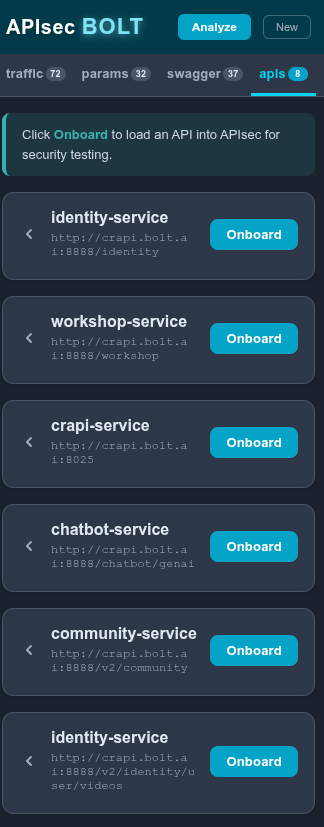
Click the arrow to the left to expand it.
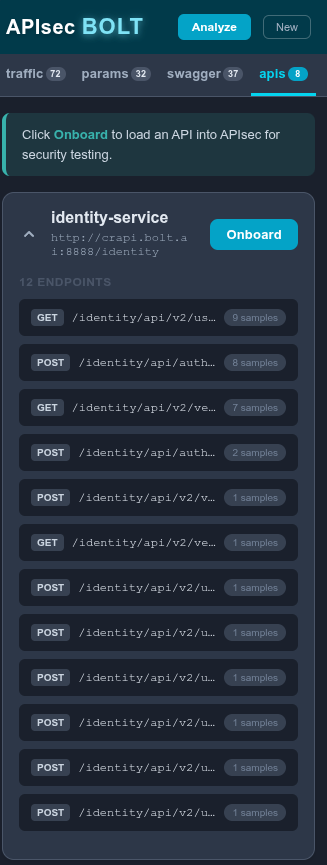
By clicking the "Onboard" button, you will need to register with APIsec to submit data for analysis.
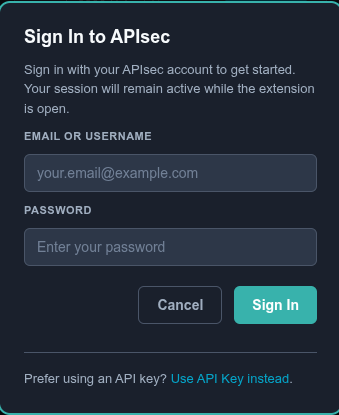
Between us, registration is free! 😉
I won't go into the analysis in this article; maybe that'll be for the next one.
And finally, and as always, last but not least, the bottom bar:
From left to right, we have:
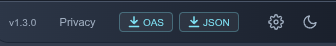
- BOLT version;
- privacy terms;
- OAS, to export as an OpenAPI Specifications file;
- to export a JSON file;
- settings (registration) wheel;
- Moon, choose a theme, light or dark.
As we can see, BOLT is a very useful tool for API testing, promoting fast and efficient testing.
APIsec has been striving to help everyone with API security issues, so if you have tested BOLT, please give them feedback and tell them about your experience with BOLT.
PS: At the time this article was published, BOLT was at version 1.3.1.