

Most beginner SQL injection guides say, "Add a single quote to the URL and look for an error." That sometimes works, but no one explains how to identify which parameter to test in the first place.
This guide is a continuation of a series of posts that are related to recon and enumeration. Previous posts in this series:
· Think Like an Attacker: Using OSINT to Safeguard Your Organization
· Domain and Subdomain Enumeration: A Practical Guide for Effective Reconnaissance
· More than Tools — Recon as a Strategic Mindset
· Content Discovery as a Strategy
· Ask the Librarian: Search-Engine Dorking as a Visibility Tool
This gap recurs among entry-level security professionals. They know the payloads and understand injection theory, but often skip a key step: systematically identifying user-input entry points.
Without that, testing is just guesswork.

Entry point enumeration is like gold mining. You're trying to find gold in a stream of junk. If you see signs of gold's presence, it means you're heading in the right direction — but it doesn't mean you won't follow a rabbit hole. With time and experience, you'll learn to optimise and automate the process, so that in a short period of time, you can spot whether it makes sense to keep looking for gold in one place or move on to the next.
What Is an Entry Point, Really?
An entry point is any place where an application accepts outside input. It's a door — sometimes obvious, like a search bar or login form. Others are hidden: custom headers, silent cookies, or invisible parameters.
Each door can be a vulnerability. If you don't know it's there, you won't test it.
What sets a thorough tester apart is not skill, but visibility. First, map every entry point — only then can you test what matters.
The Anatomy of Input: Where Parameters Live
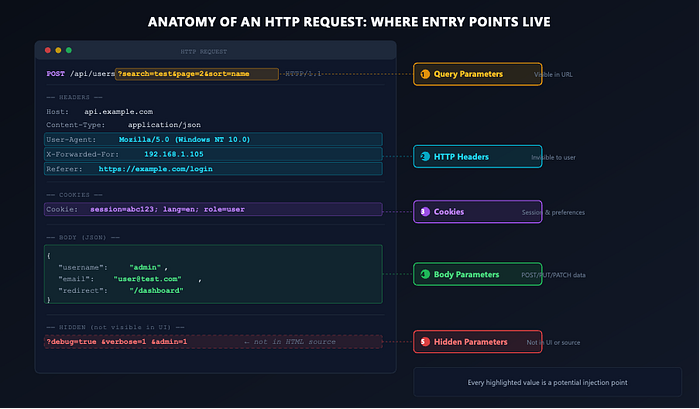
User-controlled input appears in multiple places within a web application, each representing a real attack surface to consider.
Query Parameters. These are the ones you see in the URL: ?search=test&page=2. They're the most visible and the first place beginners look. But visibility doesn't mean simplicity — applications often process dozens of query parameters, and not all of them are reflected in the page source or linked in the navigation.
Body Parameters. When you submit a form or send a POST request, the data travels in the request body. This could be standard form data (username=admin&password=test), JSON payloads ({"email": "user@test.com"}), or even XML. Body parameters are just as critical as query parameters, but less visible because they don't appear in the URL.
HTTP Headers. This is where things get interesting. Applications routinely read and process headers such as X-Forwarded-For, Referer, Host, User-Agent, and custom application-specific headers. These are invisible to the casual observer, but the server-side code may parse, log, or evaluate them -which means they can also serve as injection points.
Cookies. Session cookies, which are temporary files that store user data only for the duration of a browser session, are the obvious example. However, applications often use cookies to store user preferences, feature flags (which control access to experimental features), tracking IDs (identifiers for user activity), or user-specific data. Any cookie value processed by the server is an entry point.
Hidden and Undocumented Parameters. These are the ones that don't appear in the HTML source or in any visible requests, but the backend code still handles them. Maybe the developer left a debug=true parameter in production. Maybe the application accepts role=admin it in the body even though the front end never sends it. These parameters exist because the code was written to accept them, not because the UI exposes them.
Why Enumeration Comes Before Everything
Imagine you're tasked with finding application vulnerabilities, but you haven't fully mapped its parameters. Nearly 40% of vulnerabilities go unaddressed when parameters are left unenumerated — making thorough enumeration indispensable for security testing.
Here's the mental shift I want you to make: testing without a complete parameter map is like searching a building without knowing how many rooms it contains. You might find something in the lobby, but you'll miss valuables locked in rooms you didn't even realise existed. Skipping those rooms means missing the real treasures. This captures how thorough enumeration reveals hidden risks that otherwise remain invisible.
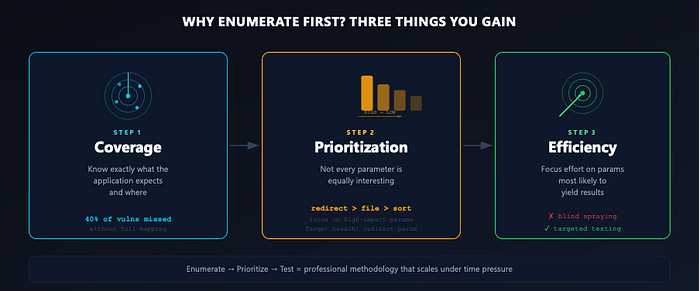
Building on this, when you enumerate entry points first, you gain three things.
First, coverage, as you know exactly what the application expects and where.
Second, prioritisation, since not every parameter is equally interesting. A `sort` parameter is probably less critical than a `redirect` or `file` parameter. For instance, the 2014 Target data breach occurred partly because an overlooked `redirect` parameter enabled unauthorised access.
Third, efficiency: instead of blindly spraying payloads, you can focus your effort on the parameters most likely to yield results.
This strategic focus becomes especially important when you're working under time constraints, which is almost always the case in professional engagements. You don't have time to test every parameter with every payload, but if you've done proper enumeration, you know which ones to focus on.
Mapping Entry Points with Burp Suite
Burp Suite and OWASP ZAP are both tools for capturing browser-to-application requests. Burp Suite is known for its advanced features and is suited for complex testing — it requires installation and browser proxy configuration. OWASP ZAP is a free, open-source alternative that is easier to set up and better suited to simpler testing needs or those with budget constraints.
When choosing between them, consider your budget, integration needs, and testing complexity. ZAP works well for CI/CD pipeline integration, startups seeking zero cost, and beginners who prioritise ease of use. Burp Suite is the better choice when advanced functionality, detailed parameter enumeration, and automation are priorities. Align your tool choice with your project's resources and assessment needs.
Step 1: Crawl and Capture
Start by manually browsing every page of the application with Burp Suite's proxy enabled, visiting all links and submitting every form. Record essential information such as page URLs, actions taken, user roles, and any errors, using a structured format like a shared spreadsheet or checklist. Use different user roles to ensure full coverage. The goal is to generate as many requests as possible so Burp Suite can build a complete site map.
If requests are not captured, check for common issues: incorrect proxy port, missing HTTPS certificate, or misaligned browser proxy settings. Ensure interception is enabled in Burp Suite's interface and that firewall or antivirus software isn't blocking connections. If issues persist, try another browser to rule out browser-specific problems, and don't hesitate to check community forums or seek help from a senior tester. Document the problem with logs and screenshots to speed up resolution.
As you browse, Burp Suite's Target > Site map gathers all requests. This data forms the foundation for the next steps.
Step 2: Analyse the Site Map
With the map complete, systematically review each request, focusing on the parameters tab, where Burp Suite lists all query parameters, body parameters, and cookies. Identify which requests could enable an attacker to alter user roles, access restricted resources, or manipulate application logic.
After reviewing detected parameters, inspect individual requests and raw headers. Look for custom headers, as they may reveal additional server input options that Burp Suite doesn't automatically flag.
Step 3: Use Built-In Parameter Analysis
In Burp Suite, navigate to Target > Site map, right-click the target scope, and select Engagement tools > Analyse target. This tool provides a consolidated overview of all parameters, their types (URL, body, cookie), and locations. For easier parameter identification, use the green parameter icon in this view.
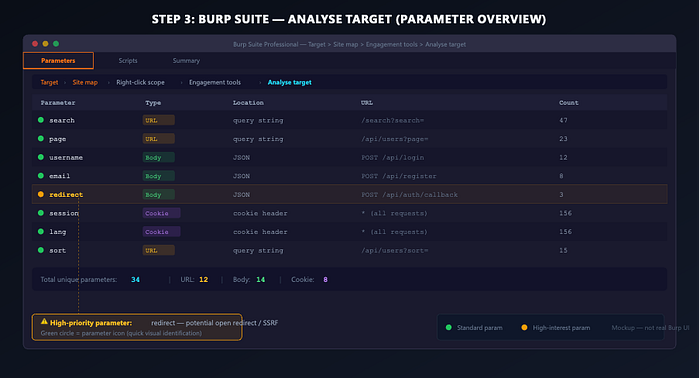
Entry-level testers frequently overlook this feature. It provides a centralised view of all application inputs in one place — use it before moving on to hidden parameter discovery.
Step 4: Discover Hidden Parameters
At this stage, the goal is to identify parameters that the application does not explicitly present. Burp Suite Pro includes Content Discovery functionality for automated crawling and scanning, but similar results can be achieved manually with the Community Edition.

To find hidden parameters, review response bodies for clues and infer likely parameter names from common patterns. For example, if you see /api/item?id=123 in requests, guess related parameters like itemId or productId - test these by adding them to the URL and watching if the response changes.
For systematic fuzzing, select a request that accepts parameters and send it to Intruder. Replace or add a parameter name at the payload position, using a wordlist of common parameter names, such as Burp-parameter-names or the default wordlist. Resources like SecLists offer pre-compiled wordlists for different contexts - the API wordlist for REST parameters, the GraphQL list for GraphQL structures, and the Auth set for login-related parameters. Tailor your wordlist to the application's technology stack to improve accuracy.
Monitor the responses as you fuzz: any variation in response length, status code, or content suggests the application has recognised the parameter. If a pag /api/user?id=1 returns a 200 with a consistent response size. Try adding &debug=true, &verbose=1, &admin=1, or &format=json. A different response means a hidden parameter has been identified.
Step 5: Don't Forget the Headers
Within Burp Suite's Repeater, select a typical request and systematically add or modify headers. Test commonly processed headers such as:
X-Forwarded-For: 127.0.0.1
X-Original-URL: /admin
X-Custom-IP-Authorization: 127.0.0.1
X-Rewrite-URL: /admin
Observe the server's responses. Any change in behaviour indicates that the application is processing the header, identifying it as a potential entry point for further testing. For example, the X-Forwarded-For header was famously exploited in a case with Netflix, where it was used to bypass IP restrictions, leading to unauthorised access.
Once you've mapped all entry points — parameters, hidden values, and headers — you have a complete picture of the application's input surface. What comes next (testing for SQLi, XSS, command injection, and other vulnerabilities) is a separate discipline, but it only works when it's built on top of thorough enumeration.
Building Your Parameter Map
Once you've gone through these steps, organise what you've found. A simple table works:
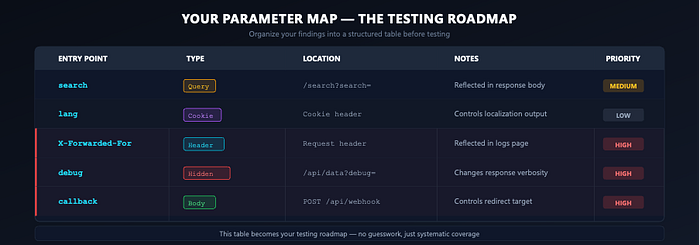
This table becomes your testing roadmap. Now, when you start sending payloads, you know exactly where each one goes and why you're testing it. There's no guesswork — just systematic coverage.
The Mindset Shift
Entry point enumeration isn't boring — it's the foundation. Professionals find more bugs not by knowing more payloads, but by finding more entry points.
So before you send a single quote, a <script> tag, or an {{expression}}, make it your mission to find every door into this application. Don't test until you've mapped every entry point — the difference is in your thoroughness. Take that extra step.
Map first. Test second. Make this your mantra.