June 3, 2026
Project #12 — Risk Register — How I Built a Complete Cybersecurity Risk Register
A beginner-friendly, recruiter-safe walk-through of how I identified, scored, and managed cyber risks using analyst thinking at every step.

Andrew Williams
9 min read
- 1 A beginner-friendly, recruiter-safe walk-through of how I identified, scored, and managed cyber risks using analyst thinking at every step.
- 2 Introduction — Why This Project Mattered to Me
- 3 Step 1 — Start With the Environment, Not the Spreadsheet
- 4 Analyst questions I asked first:
- 5 Step 2 — The Blank Template Needed a Strategy Too
A beginner-friendly, recruiter-safe walk-through of how I identified, scored, and managed cyber risks using analyst thinking at every step.
By CyberRoe · Beyond the Walls Series
Introduction — Why This Project Mattered to Me
Some cybersecurity projects feel exciting right away.
A risk register is usually not one of them.
At first glance, it looks like a serious spreadsheet that quietly expects you to know everything already. A blank template can feel like the cybersecurity equivalent of being handed a clipboard and a mission with no map.
But that's exactly why I wanted to do this project.
I wanted to practice something that matters in almost every security role: structured thinking.
Not just identifying threats. Not just naming controls. But learning how to look at a messy problem, organize it, score it, assign accountability, and explain it in a way that both technical teams and leadership can understand.
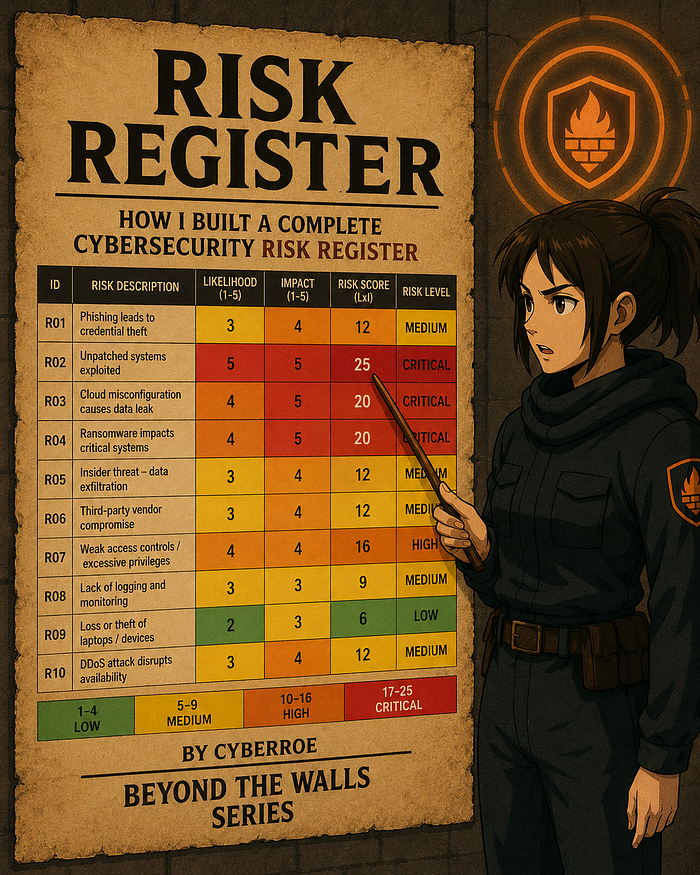
For this project, I built a complete NIST CSF v2–aligned risk register with:
- 10 realistic risks
- likelihood and impact scoring
- mapped controls
- risk owners
- status tracking
- target dates
- a monitoring dashboard
- an executive report
- and a CISO-style slide deck
This write-up is for two audiences:
- Recruiters and hiring managers, so they can see how I reason through security work
- New learners, so they can see that risk analysis becomes much less intimidating when you give it structure
The biggest lesson from this project was simple:
Good analysts do not just fill in fields. They create an order of thinking that makes the fields meaningful.
Step 1 — Start With the Environment, Not the Spreadsheet
Before I touched the template, I needed to understand what I was actually protecting.
That meant slowing down and asking questions first.
Analyst questions I asked first:
- What systems matter most to the business?
- What would cause the biggest operational disruption?
- Which assets would hurt the organization most if they were exposed?
- Where are the easiest entry points for an attacker?
- Which risks depend on vendors, cloud services, or user behavior?
- What would leadership actually care about if something failed?
Those questions helped me avoid building a random list of cyber fears and instead build something grounded.
From there, I grouped risks into six practical categories:
- Identity & Access
- Vulnerabilities
- Data
- Vendors & Third Parties
- Availability
- Physical Security
That gave me a strong foundation.
It also saved me from the classic beginner move of throwing "phishing, ransomware, cloud, and panic" into the same pile and calling it a framework.
Step 2 — The Blank Template Needed a Strategy Too
Once I opened the blank template, I realized something important:
The real challenge wasn't just what to type. It was deciding the order in which to think.
That was a big lesson I carried over from Project #11, where I learned that grouping columns logically makes the work cleaner, faster, and easier to defend. So instead of filling this template left to right like a form at the dentist's office, I grouped the columns into phases.
I used this sequence:
Identify → Assess → Control → Govern
That became my mental workflow.
Instead of seeing "a bunch of columns," I saw four stages of analysis:
Phase 1: Identify the threat

Phase 2: Assess the impact

Phase 3: Apply the defenses

Phase 4: Govern the response

That single mindset shift made the spreadsheet feel far less overwhelming.
Once I had that fill order, the blank template stopped feeling like one giant spreadsheet and started feeling like a sequence of analyst decisions.
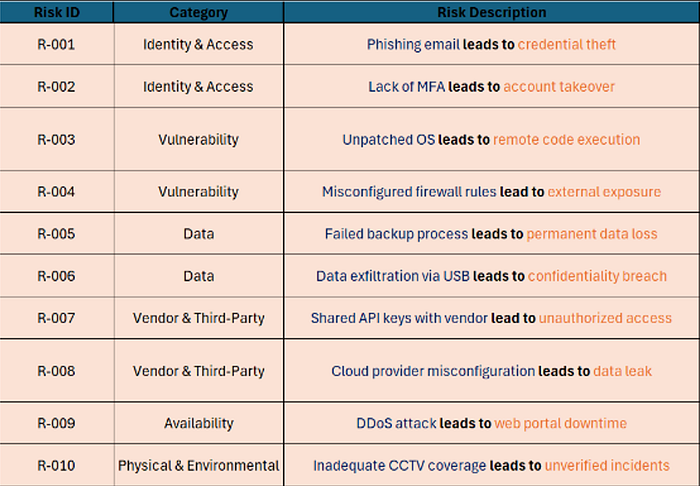
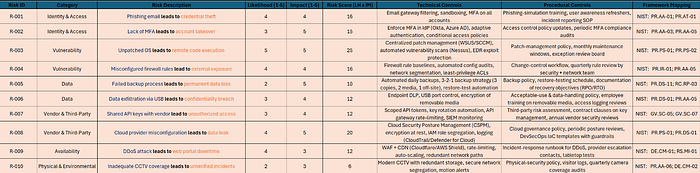
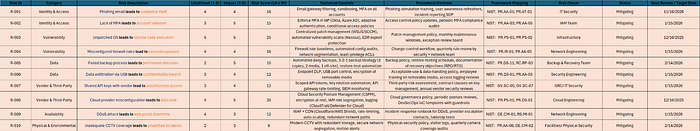
Step 3 — Identify First: Name the Threat Clearly
The first group of columns I filled was:
- Risk ID
- Category
- Risk Description
This was the discovery phase. My goal here was not to score anything yet. It was just to define the threat clearly.
Analyst questions I asked in this phase:
- What exactly is the risk?
- Which domain does it belong to?
- Can I describe it clearly using cause → effect?
- Does this description make the threat and the consequence obvious?
- If someone else read this row, would they understand what went wrong?
That last question mattered a lot, because vague risks are hard to score and even harder to fix.
So I used a simple formula:
Cause → Effect
For example:
- Phishing email leads to credential theft
- Unpatched OS leads to remote code execution
- Cloud provider misconfiguration leads to data leak
That wording made each row easier to understand, easier to score, and easier to map to controls later.
It also meant I wasn't writing vague entries like "phishing" and expecting future-me to magically know what I meant.
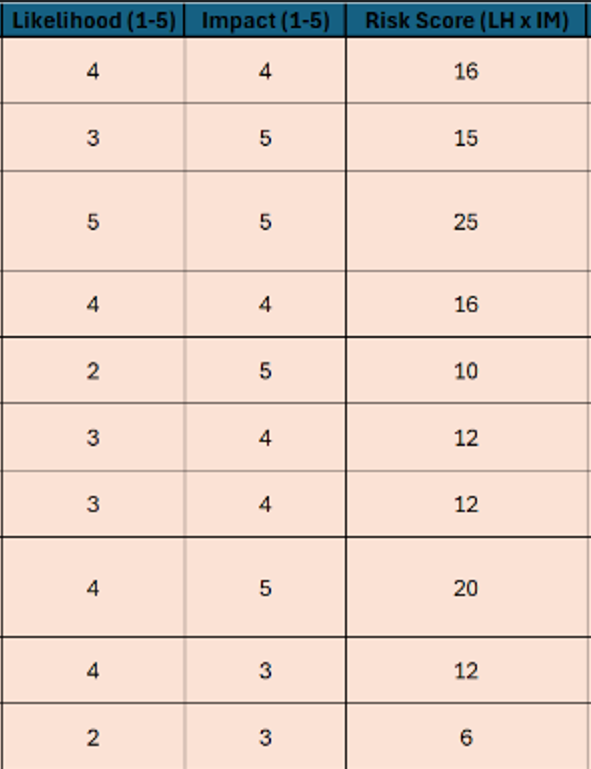
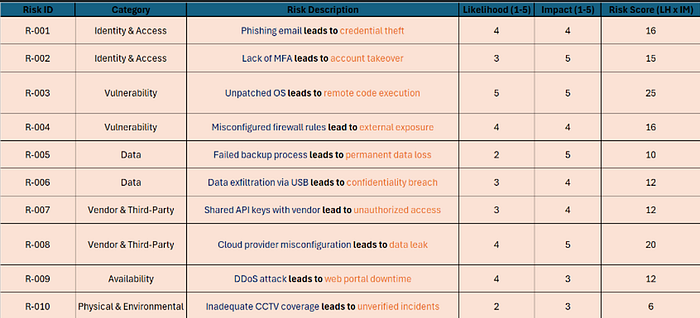
Step 4 — Assess Next: Score What Actually Matters
Once I had clean risk descriptions, I moved into the next column group:
- Likelihood
- Impact
- Risk Score
This is where the register shifted from a list of possibilities to something measurable.
I used a simple formula:
Risk Score = Likelihood × Impact
But the important part was not the math. It was the reasoning behind the numbers.
Analyst questions I asked when scoring likelihood:
- How common is this threat in the real world?
- Has this happened in similar environments?
- How exposed are we to it?
- Are current controls strong, weak, or inconsistent?
- Is this a realistic event or just a theoretical one?
Analyst questions I asked when scoring impact:
- If this happens, what breaks?
- Would it affect operations, customers, data, or trust?
- How hard would recovery be?
- Would this create legal or contractual issues?
- Would leadership view this as a serious business event?
For example:
Unpatched OS → Remote Code Execution
- Likelihood: 5
- Impact: 5
- Score: 25 (Critical)
Cloud Misconfiguration → Data Leak
- Likelihood: 4
- Impact: 5
- Score: 20 (Critical)
This process helped me avoid using the deeply flawed scoring method of "that one sounds scary, so… probably high?"
Once the scores were in place, the priorities started to reveal themselves.
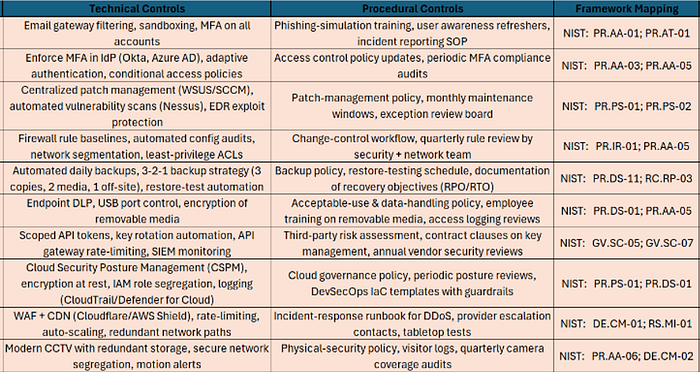
Step 5 — Control the Risk: Match It to Defenses and Frameworks
After scoring, I moved into the next group of columns:
- Technical Controls
- Procedural Controls
- Framework Mapping
- Residual scoring (if used)
This is where the spreadsheet stopped being just a list of problems and started becoming a treatment plan.
Analyst questions I asked in this phase:
- What technical safeguard reduces this risk directly?
- What policy, workflow, or review process keeps that safeguard sustainable?
- Is this control preventive, detective, or corrective?
- Which NIST CSF v2 subcategory best fits the outcome I want?
- If this control works, what should the residual risk look like?
This was also the point where Project #12 connected directly back to Project #11.
In Project #11, I grouped detections and framework mappings so they worked together logically. Here, I used that same mindset to make sure the risks, controls, and NIST mappings all lined up in a defensible way.
Examples:
- Phishing → Credential Theft
- Technical: email filtering, MFA
- Procedural: awareness training, incident reporting
- NIST CSF v2: PR.AA-01; PR.AT-01
- Unpatched OS → RCE
- Technical: patch automation, EDR
- Procedural: maintenance windows, exception review
- NIST CSF v2: PR.PS-01; PR.PS-02
- Cloud Misconfiguration → Data Leak
- Technical: CSPM, encryption, IAM segmentation
- Procedural: governance reviews, DevSecOps guardrails
- NIST CSF v2: PR.PS-01; PR.DS-01
This phase felt like building the defensive plan after mapping the battlefield.
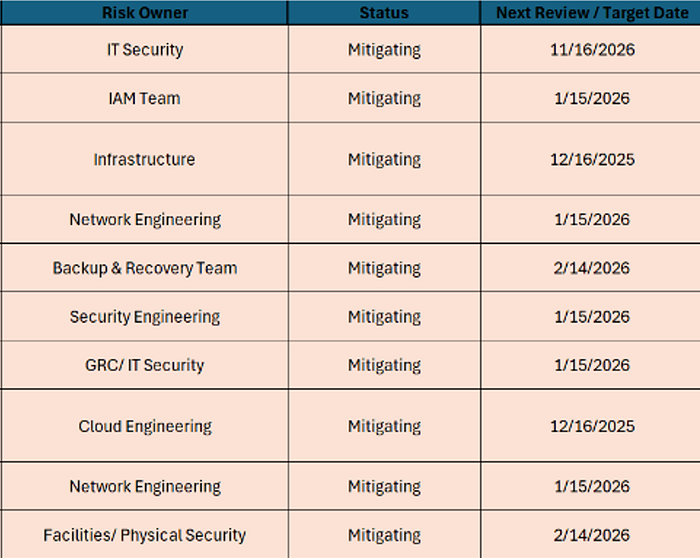
Step 6 — Govern the Response: Add Ownership, Status, and Deadlines
The final column group was:
- Risk Owner
- Status
- Next Review / Target Date
This is where the register became operational.
Analyst questions I asked in this phase:
- Who is actually responsible for reducing this risk?
- Which team would realistically implement or maintain the control?
- Is the status open, mitigating, or closed based on evidence?
- Does the target date make sense based on severity?
- If this were reviewed by leadership, would the status be defensible?
This step also forced me to be honest.
A lot of things sounded good on paper, but "closed" is a serious word. If I didn't have evidence that a control was fully in place and effective, then "mitigating" was the more accurate answer.
That's where Project #14 became especially useful. I used the compliance maturity and control evidence from that project to help determine whether a risk should really be considered closed or still in progress.
A risk with no owner is basically just a formal way of saying, "Everyone should care, so naturally no one will."
Why the Column Grouping Mindset Helped So Much
This ended up being one of the most valuable parts of the whole project.
By grouping the columns into phases, I could think in a clean sequence:
- Define the threat
- Measure the exposure
- Apply the defenses
- Assign accountability
That sounds simple, but it changed everything.
It made the spreadsheet easier to fill out. It made the logic easier to defend. And it made the whole project feel more like a real process and less like a giant grid waiting to judge me.
For recruiters, this shows process discipline and structured thinking. For new learners, it shows that blank templates become much easier once you stop seeing "12 columns" and start seeing "4 phases."
Step 7 — Turn the Register Into a Monitoring Process
Once the register was complete, I didn't want it to stay as a static spreadsheet.
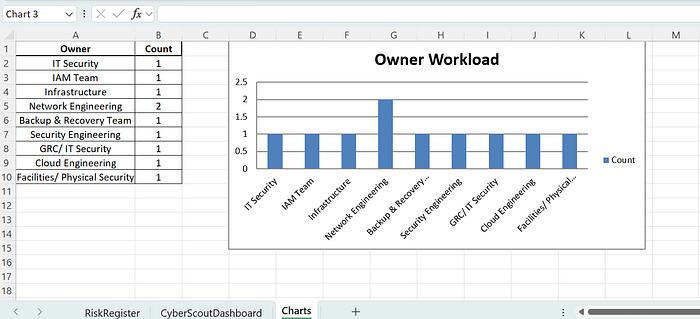
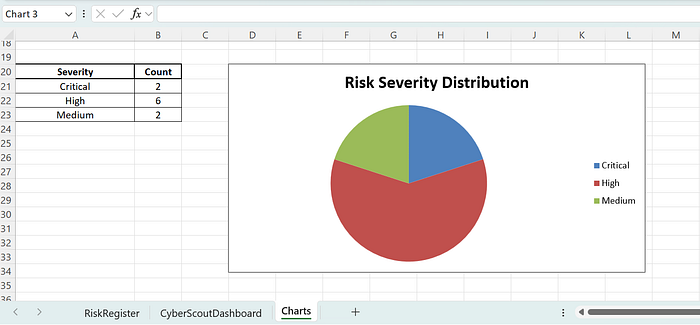
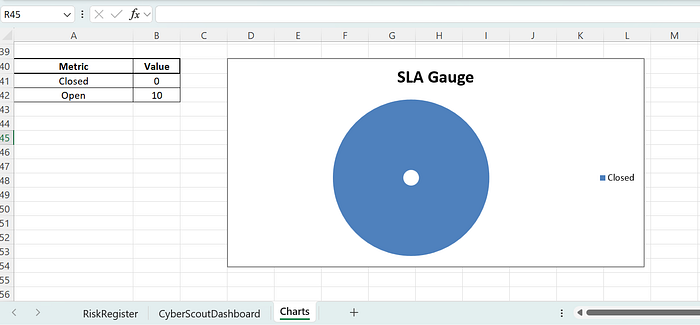
So I built a dashboard with:
- severity heat-map
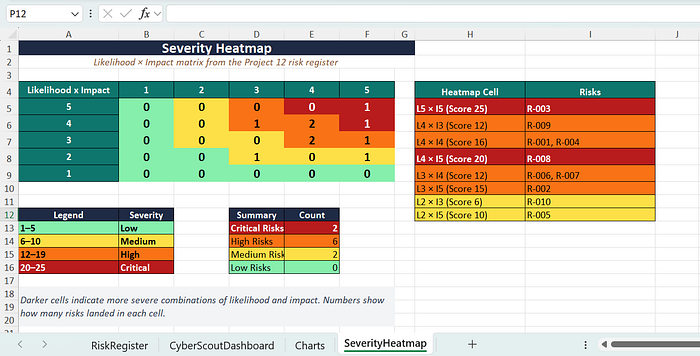
- owner workload
- risk distribution
- SLA gauge
- due-date tracking
- navigation links
Analyst questions I asked while building the dashboard:
- What would leadership want to see in 10 seconds?
- What should stand out immediately?
- Which metrics are useful, and which are just decoration?
- How do I show urgency without making the dashboard noisy?
- If this were used in a review meeting, what would people ask first?
That's where the project moved from "completed spreadsheet" to "live governance tool."
And honestly, dashboards are where spreadsheets stop looking like homework and start looking like portfolio material.
Charts also help when you want to say "we have a pattern" without asking people to emotionally connect with 40 rows of Excel.
Step 8 — Close the Loop With Executive Reporting
To finish the project properly, I created:
- an executive risk report
- a CISO-style slide deck
- residual risk expectations
- a treatment roadmap
Analyst questions I asked at the executive level:
- What are the top risks leadership actually needs to know?
- What business impact matters most here?
- What decisions should executives make based on this data?
- How do I summarize this clearly without drowning it in jargon?
- If I had 5 minutes to brief a CISO, what would I lead with?
That step reminded me that risk work is not finished when the spreadsheet is complete.
It is finished when decision-makers can understand it and act on it.
Because at the executive level, nobody wants a dramatic monologue. They want the answer, the impact, and the next move.
What This Project Shows Recruiters
This project shows more than technical familiarity.
It shows:
- structured risk thinking
- clear column and workflow logic
- NIST CSF v2 familiarity
- control selection
- ownership reasoning
- dashboard building
- executive communication
- the ability to turn a blank template into an operational process
In other words, not just "I know security," but:
I know how to structure security work.
That distinction matters. Plenty of people can list tools. Fewer can show how they think.
What This Project Shows New Learners
For anyone new to this kind of work, this project proves that risk analysis becomes much more manageable when you break it into phases.
My fill order became:
- identify the risk
- assess the severity
- assign the controls
- govern the response
That's what turned the template from "a lot of columns" into "a manageable process."
You do not have to know everything at once. You just need a repeatable order of operations and enough curiosity to keep asking better questions.
Final Thoughts
Operation Control Mirror helped me think like:
- a GRC analyst
- a SOC analyst
- a security engineer
- and a translator between technical work and leadership decisions
The biggest lesson was this:
Good analysts do not just fill in fields. They build an order of thinking that makes the fields meaningful.
That column-grouping mindset ended up being one of the most valuable parts of the entire project.
If you're a recruiter, this project reflects how I approach security work: structured, practical, and business-aware.
If you're new to cybersecurity, I hope this shows that even a blank template gets much easier once you stop looking at it as a spreadsheet and start looking at it as a sequence of questions.
And if you've ever stared at a blank template long enough for it to start staring back, I hope this method helps.
— CyberRoe, Beyond the Walls