

Overview
The CyberDefenders DumpMe lab is a hands-on digital forensics exercise designed to simulate a real-world Security Operations Center (SOC) investigation. The scenario centers on a Windows 7 machine that has been compromised by Meterpreter malware, requiring the analyst to perform deep-dive memory forensics. Using a provided memory dump, the primary goal is to reconstruct the attack lifecycle, identify malicious processes, and extract indicators of compromise (IOCs) that reveal the extent of the breach.
This writeup documents the systematic application of the Volatility 2 framework to dissect the volatile data. The investigation covers a wide range of forensic techniques, including process enumeration with psscan, network connection analysis via netscan, and the extraction of local account secrets using hashdump. By navigating through Master File Table (MFT) records and Virtual Address Descriptor (VAD) nodes, the analysis successfully uncovers hidden scripts, malicious network callbacks, and even cleartext data residing within application memory.
Lab Scenario
A SOC analyst took a memory dump from a machine infected with a Meterpreter malware. As a Digital Forensicators, your job is to analyze the dump, extract the available indicators of compromise (IOCs) and answer the provided questions.
Reference: Blue team CTF Challenges | DumpMe — CyberDefenders
Forensic Analysis
Q1: What is the SHA1 hash of Triage-Memory.mem (memory dump)?
Before starting I would recommend renaming the memory capture provided to something a bit shorter, i.e., memdump.mem is what I used.
Run sha1sum memdump.mem to calculate the SHA1 hash of the memory capture.
sha1sum /mnt/c/BlueLabs/65-DumpMe/memdump.mem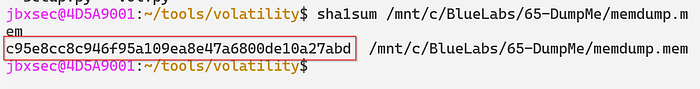
Answer: c95e8cc8c946f95a109ea8e47a6800de10a27abd
Q2: What volatility profile is the most appropriate for this machine? (ex: Win10x86_14393)
Run Volatility 2's imageinfo plugin — this takes time to produce results (5–10 minutes).
python2 vol.py -f /mnt/c/BlueLabs/65-DumpMe/memdump.mem imageinfo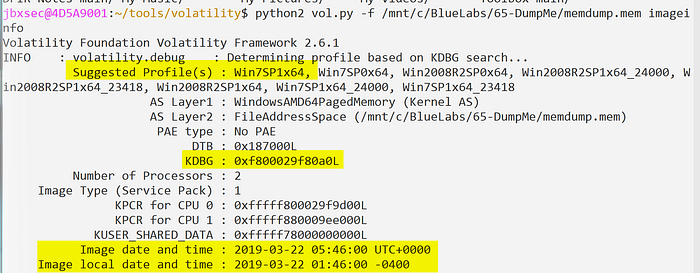
Answer: Win7SP1x64
Q3: What was the process ID of notepad.exe?
Run Volatility 2's psscan plugin to enumerate processes. Specify the profile discovered in the previous question (--profile=Win7SP1x64). Optionally, pipe the results into tee to output to both the terminal and a text file.
- Note that running
psscanhere is preferred overpslistas it will show both terminated and unlinked processes attempting to evade detection.
python2 vol.py -f /mnt/c/BlueLabs/65-DumpMe/memdump.mem psscan | tee psscan.txt
cat psscan.txt | grep -i notepad.exe
Answer: 3032
Q4: Name the child process of wscript.exe.
Run the pstree plugin to build a tree-like structure consisting of parent-child processes.
python2 vol.py -f /mnt/c/BlueLabs/65-DumpMe/memdump.mem --profile=Win7SP1x64 pstree | tee pstree.txt
cat pstree.txt | grep -C 5 -i wscript.exe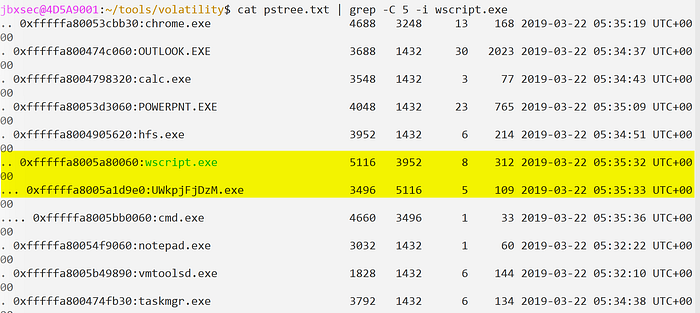
Answer: UWkpjFjDzM.exe
Q5: What was the IP address of the machine at the time the RAM dump was created?
Run the netstat plugin.
python2 vol.py -f /mnt/c/BlueLabs/65-DumpMe/memdump.mem --profile=Win7SP1x64 netstat | tee netstat.txtNetstat produced an error — run netscan instead. The netscan plugin will be a bit noisier, and will take longer to retrieve results, but shows more context such as closed connections.
python2 vol.py -f /mnt/c/BlueLabs/65-DumpMe/memdump.mem --profile=Win7SP1x64 netscan | tee netscan.txtThe IP address can be seen at the top of the netscan output under "Local Address".
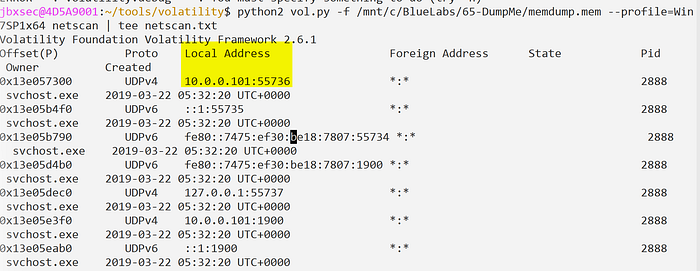
Answer: 10.0.0.101
Q6: Based on the answer regarding the infected PID, can you determine the IP of the attacker?
The infected PID (3496) is the malicious UWkpjFjDzM.exe process. Check the output collected from netscan to see if PID 3496 had any network activity.
cat netscan.txt | grep -i 3496We can confirm PID 3496 connected to 10.0.0.106 over port 4444.

Answer: 10.0.0.106
Q7: How many processes are associated with VCRUNTIME140.dll?
Run the dlllist plugin to dump all processes and their associated DLLs. Given the number of running processes, and libraries loaded, this can take time to complete. By dumping the output to a file — we can apply some filtering to clean up the results once it completes.
python2 vol.py -f /mnt/c/BlueLabs/65-DumpMe/memdump.mem --profile=Win7SP1x64 dlllist | tee dlllist.txtFiltering:
cat dlllist.txt | grep -C 30 -i VCRUNTIME140.dll | grep -i exe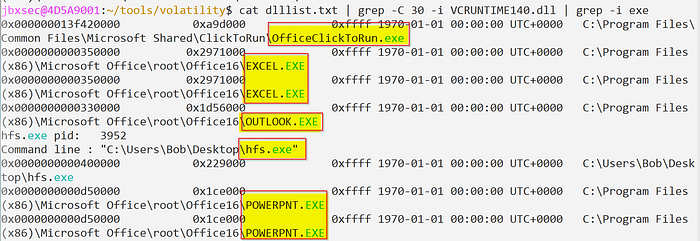
There were some duplicates in the output, i.e., the same executable that referenced the VCRUNTIME140.dll library more than once. In total, there were 5 unique processes associated with VCRUNTIME140.dll.
Answer: 5
Q8: After dumping the infected process, what is its md5 hash?
Dump PID 3496 by using the procdump plugin then calculate it's hash usin md5sum.
python2 vol.py -f /mnt/c/BlueLabs/65-DumpMe/memdump.mem --profile=Win7SP1x64 procdump -p 3496
md5sum dump/executable.3496.exe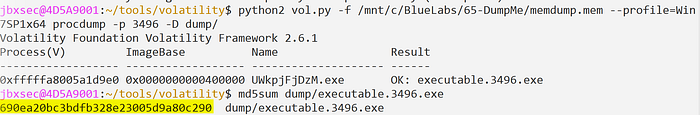
Answer: 690ea20bc3bdfb328e23005d9a80c290
Q9: What is the LM hash of Bob's account?
Run the hashdump plugin to dump NTLM hashes for local accounts.
python2 vol.py -f /mnt/c/BlueLabs/65-DumpMe/memdump.mem --profile=Win7SP1x64 hashdump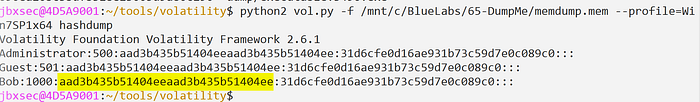
Answer: aad3b435b51404eeaad3b435b51404ee
Q10: What memory protection constants does the VAD node at 0xfffffa800577ba10 have?
Run the vadinfo plugin to find the provided offset and it's surrounding context which will tell us what memory protection was in place at this specific offset.
python2 vol.py -f /mnt/c/BlueLabs/65-DumpMe/memdump.mem --profile=Win7SP1x64 vadinfo | grep -C 10 -i 0xfffffa800577ba10
Answer: PAGE_READONLY
Q11: What memory protection did the VAD starting at 0x00000000033c0000 and ending at 0x00000000033dffff have?
Much like the previous question, we can run the vadinfo plugin and specify either the starting or ending offsets.
python2 vol.py -f /mnt/c/BlueLabs/65-DumpMe/memdump.mem --profile=Win7SP1x64 vadinfo | grep -C 10 -i 0x00000000033c0000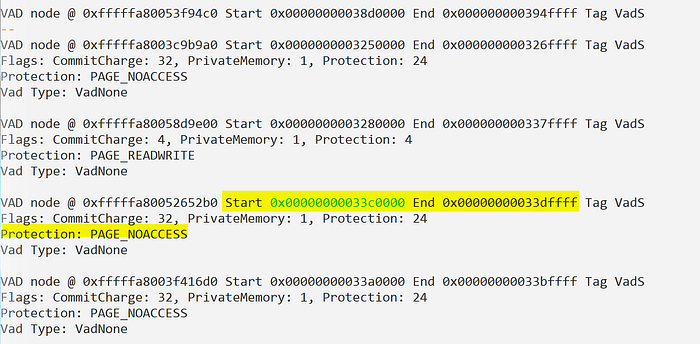
Answer: PAGE_NOACCESS
Q12: There was a VBS script that ran on the machine. What is the name of the script? (submit without file extension)
Run the mftparser plugin and dump all output to a file for analysis. The MFT (Master File Table) stores a record for all files on disk. We can use this to identify the name of the VBS script.
python2 vol.py -f /mnt/c/BlueLabs/65-DumpMe/memdump.mem --profile=Win7SP1x64 mftparser > mft.txt
cat mft.txt | grep -i .vbs
The VBS script was hiding in Bob's profile directory.
Answer: vhjReUDEuumrX
Q13: An application was run at 2019–03–07 23:06:58 UTC. What is the name of the program? (Include extension)
Run the shimcache plugin to identify the name of the application that ran on 2019–03–07. Shimcache records a timestamp — we can use this to filter the output.
python2 vol.py -f /mnt/c/BlueLabs/65-DumpMe/memdump.mem --profile=Win7SP1x64 shimcache > shimcache.txt
cat shimcache.txt | grep -i 2019-03-07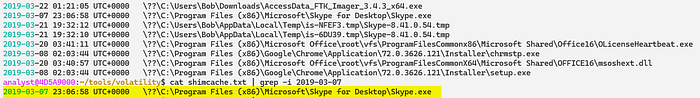
Answer: Skype.exe
Q14: What was written in notepad.exe at the time when the memory dump was captured?
Run memdump to dump all addressable memory for PID 3032 (notepad.exe). Strings can be used it identify the contents of notepad.exe.
To identify the PID associated with notepad.exe, run pslist.
python2 vol.py -f /mnt/c/BlueLabs/65-DumpMe/temp_extract_dir/memdump.mem --profile=Win7SP1x64 pslist
Memdump will take some time to run — once it completes, run strings against the dump file.
python2 vol.py -f /mnt/c/BlueLabs/65-DumpMe/temp_extract_dir/memdump.mem --profile=Win7SP1x64 memdump -p 3032 -D dump/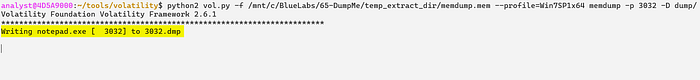
Run strings with -e l to specify 16-bit UTF-16LE encoding. This will allow us to see the ASCII strings. The -n15 will limit the number of results returned to those greater than 15. This one was tricky to find but, when you see it, you'll know it.
strings -n15 -e l 3032.dmp | more 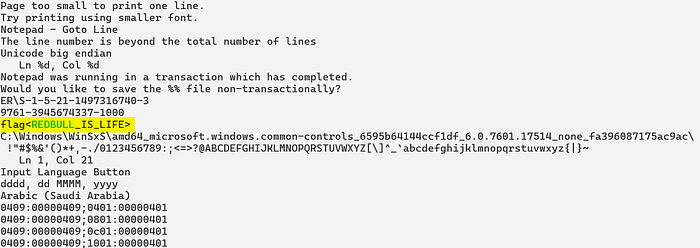
Answer: flag<REDBULL_IS_LIFE>
Q15: What is the short name of the file at file record 59045?
Parse the MFT using the mftparser plugin and dump the output to a file for analysis.
python2 vol.py -f /mnt/c/BlueLabs/65-DumpMe/temp_extract_dir/memdump.mem --profile=Win7SP1x64 mftparser > mft.txt
cat mft.txt | grep -C 20 -i 59045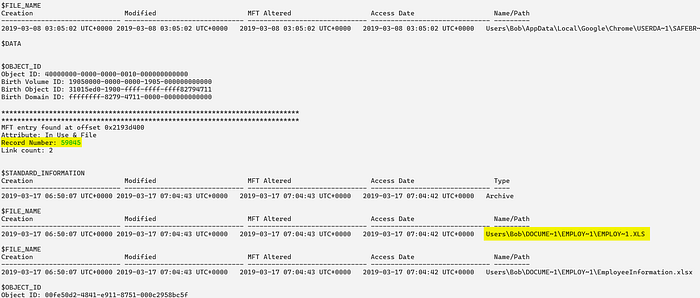
Answer: EMPLOY~1.XLS
Q16: This box was exploited and is running meterpreter. What was the infected PID?
Based on information collected so far we can assume the malware identified in previous questions is likely the meterpreter payload.
Run netscan to see if PID 3496 (UWkpjFjDzM.exe) established any network connections.
python2 vol.py -f /mnt/c/BlueLabs/65-DumpMe/temp_extract_dir/memdump.mem --profile=Win7SP1x64 netscan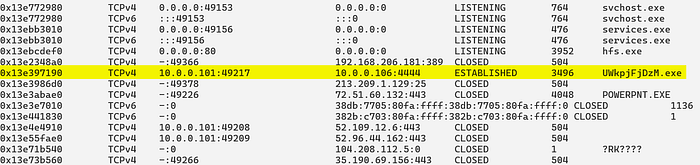
We can conclude that PID 3496 (UWkpjFjDzM.exe) established a connection to the attacker's infrastructure 10.0.0.106 over port 4444.
Answer: 3496
Summary
The forensic investigation successfully identified PID 3496 (UWkpjFjDzM.exe) as the primary malicious process, which was spawned by wscript.exe and maintained an active connection to an attacker-controlled IP address (10.0.0.106) over port 4444. Further analysis of the system's memory revealed that the infection was tied to a hidden VBScript named vhjReUDEuumrX located within a user profile. Key forensic artifacts recovered include the MD5 hash of the malware, the NTLM hashes for the local user "Bob," and evidence of a Flag hidden within the memory space of notepad.exe.
Beyond identifying the malware, the writeup highlights the importance of correlating different forensic plugins to build a complete picture of the incident. By utilizing mftparser for file system activity and shimcache for execution history, the analyst was able to pinpoint specific timestamps for application launches, such as Skype.exe. The lab concludes by confirming the Meterpreter payload's persistence and providing a comprehensive list of the technical indicators necessary to remediate the infected host and understand the attacker's movements.