
If you have ever tried to pull a hundred thousand JSON objects out of a public REST API in a hurry, you have probably watched a script crawl, opened htop, seen one CPU core sitting at 4% utilization, and concluded the obvious: Python is slow, I should rewrite this in Go.
You should not. The CPU is not your bottleneck. It is almost never your bottleneck. The cable is.
This article is a field guide to where time actually disappears when you call a public API at scale. It is the result of repeatedly measuring scrapers that "feel slow," finding that the suspected bottleneck almost never matches the real one, and slowly building a mental model that puts the right knob on top.
We will look at five places latency hides, in roughly descending order of how much wall-clock time they cost a typical scraper. None of them are language choice.
The race we are actually running
Before we can talk about bottlenecks, we have to agree on what "fast" means.
Most scraper benchmarks measure the wrong number. "I made 1,000 requests in 9 seconds" sounds great until you realize that on a different day, from a different machine, the same code did 1,000 requests in 90 seconds — without any code change. The number that matters is not absolute throughput. It is the ratio between observed throughput and the theoretical maximum your network position allows.
Here is the only formula you need to keep in your head:
max_throughput = concurrency / per_request_latencyEverything else is a corollary. If your per-request latency is 200 ms and you run 50 concurrent in-flight requests, you can do 250 req/s — and not one request more, regardless of whether you write it in C, Rust, or hand-assembled brainfuck. To go faster you must either drop the latency or raise the concurrency. Both knobs exist, and most engineers turn the wrong one first.
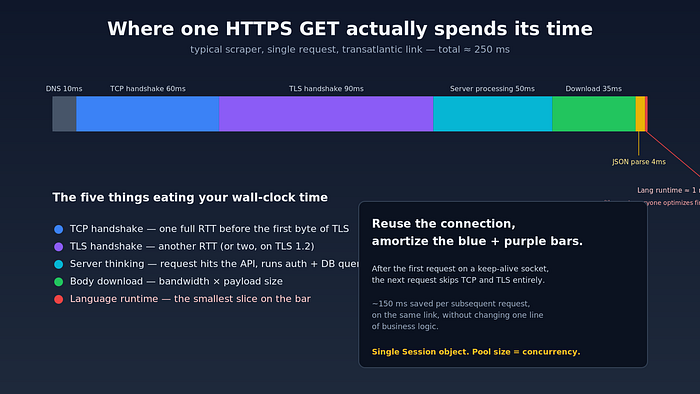
Where the seconds go in a typical HTTPS GET — the language sliver is the part everyone optimizes first.
Bottleneck 1: the speed of light
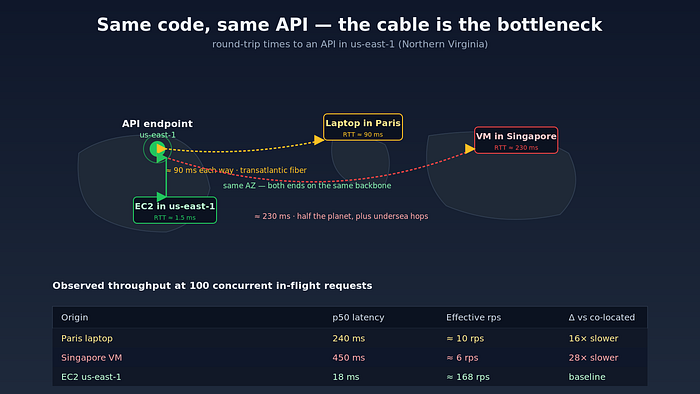
The single largest contributor to per-request latency, on virtually every public-internet scraper I have profiled, is geography. Specifically, the round-trip time (RTT) between your scraper and the API's edge.
Light in glass fiber travels at roughly two-thirds the speed of light in a vacuum. New York to Frankfurt, great-circle distance about 6,200 km, is therefore physically incapable of being less than ~60 ms round-trip. In practice — once you add switching, BGP detours, and a couple of hops through CDN edge nodes — the floor is closer to 80–100 ms.
If your laptop in Paris is hitting an API whose primary region is us-east-1 (Northern Virginia), every request costs you a transatlantic RTT before any code in either process executes. That is ~90 ms gone, every time, forever. No amount of asyncio is going to recover it.
The fix is not "make the request faster." The fix is move the scraper.
Spinning up a t4g.small in the same AWS region as the target API typically drops per-request latency from ~250 ms to ~15 ms. That is not a 5% gain. That is a 16x throughput multiplier — for $0.01/hour. I have never found a code-level optimization that comes anywhere close.
How to actually check this
Before you start coding, do this:
# Cloud-shell from each candidate region:
for region in us-east-1 us-west-2 eu-west-1 ap-southeast-1; do
  echo "=== $region ==="
  curl -o /dev/null -s \
    -w "dns: %{time_namelookup}s  connect: %{time_connect}s  tls: %{time_appconnect}s  ttfb: %{time_starttransfer}s  total: %{time_total}s\n" \
    https://api.example.com/healthz
done
That curl -w format string is the cheapest profiler in software engineering. It tells you exactly where the seconds went for one request, and it works against any HTTPS endpoint. Run it from three or four candidate regions before you write a single line of scraping code, and let the numbers pick your deployment region.
Move the scraper, not the requests. Co-locating with the target's region is the single largest practical win.
Bottleneck 2: every fresh TLS handshake is a tax
The second-largest leak in most naive scrapers is opening a brand-new TCP and TLS connection for every request.
A modern TLS 1.3 handshake takes one round trip after the initial TCP SYN/SYN-ACK/ACK. TCP needs one. So per request you are paying roughly 2 × RTT before any HTTP bytes flow — and your data hasn't started arriving yet. On a 90 ms link that is 180 ms of pure handshake. On a 15 ms intra-region link it is 30 ms.
The fix is connection reuse. If you keep the same TCP socket open and send your second request down it, you skip both handshakes. Your second request now costs 1 × RTT instead of 3.
Every decent HTTP client does this for you, but only if you ask correctly. The classic mistakes:
# WRONG — opens a new connection per request
for url in urls:
    requests.get(url)            # uses a fresh Session implicitly
# RIGHT — connection pool, sticky TLS
with httpx.Client(
    http2=True,
    limits=httpx.Limits(max_connections=64, max_keepalive_connections=64),
    timeout=httpx.Timeout(10.0, connect=5.0),
) as client:
    for url in urls:
        client.get(url)
Two things in that snippet matter and are routinely missed:
- A single
Session/Clientobject, reused across the whole loop.requests.get(...)at module level creates and tears down a session every call — your reuse rate is zero. - An explicit
max_connectionsceiling. The default in most clients is low (often 10 or 20), and once you exceed it, the client silently serializes the overflow. That is invisible in profile output: requests look "slow" instead of "queued."
If you are running an async scraper, the equivalent gotcha is using aiohttp.ClientSession() inside the loop instead of outside it. Once, outside the loop, kept open for the whole crawl.
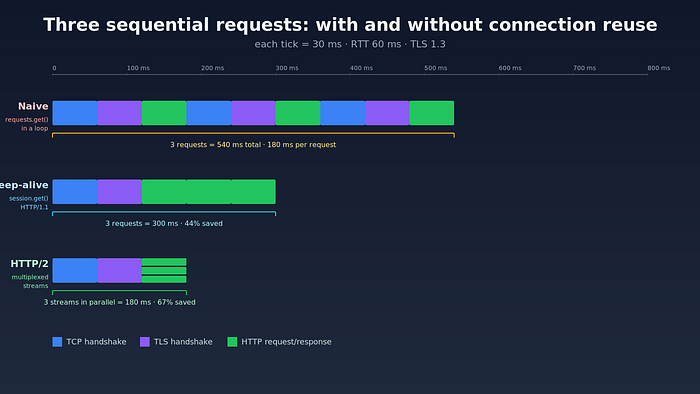
Per-request cost with and without connection reuse. The "naive" timeline is what you get from requests.get() in a loop.
Bottleneck 3: the wrong concurrency model
This is the part where most engineers reach for Go. They do not need to.
For an I/O-bound workload — and a JSON API scraper is the canonical I/O-bound workload — the question is not "which language has the fastest runtime?" but "how many requests can I keep in flight at the same time?" The CPU is idle 99% of the time. You are waiting for bytes.
There are three concurrency models that work, and one that does not.
Threads (works fine for scraping)
The Python GIL is often blamed for slow scrapers. This is incorrect. The GIL releases on I/O. A requests.get() call drops the lock for the duration of the network wait — which is essentially the entire request. A ThreadPoolExecutor(max_workers=64) will happily saturate 64 in-flight requests with negligible CPU cost.
from concurrent.futures import ThreadPoolExecutor
import requests
session = requests.Session()
session.headers.update({"User-Agent": "..."})
def fetch(url):
    return session.get(url, timeout=10).json()
with ThreadPoolExecutor(max_workers=64) as pool:
    results = list(pool.map(fetch, urls))
For up to a few hundred concurrent requests, this is the simplest correct approach. The mental model is straightforward, traceback debugging works, and you do not need to colour your functions async.
asyncio (scales further, more rope)
Above ~500 concurrent requests, threads get expensive — each thread costs ~8 MB of stack by default — and you want a single-threaded event loop. httpx and aiohttp both work, with httpx having a cleaner type story and aiohttp being measurably faster on hot paths.
import asyncio, httpx
async def fetch(client, url):
    r = await client.get(url, timeout=10)
    return r.json()
async def main(urls):
    limits = httpx.Limits(max_connections=200, max_keepalive_connections=200)
    async with httpx.AsyncClient(http2=True, limits=limits) as client:
        sem = asyncio.Semaphore(200)
        async def bound(u):
            async with sem:
                return await fetch(client, u)
        return await asyncio.gather(*(bound(u) for u in urls))
Note the semaphore. asyncio.gather(*(fetch(client, u) for u in 10_000_urls)) without a semaphore tries to start ten thousand requests at the same instant, blows past your client's max_connections ceiling, queues them all behind a backlog you cannot see, and frequently produces timeouts that look like "the API is being mean to me." It is not being mean. You are.
Multiprocessing (the trap)
For pure network I/O, multiprocessing adds startup cost, IPC cost, and connection-pool fragmentation — every worker gets its own pool, so your keep-alive rate plummets. Use it for CPU-bound parsing of the responses, not for the HTTP layer itself.
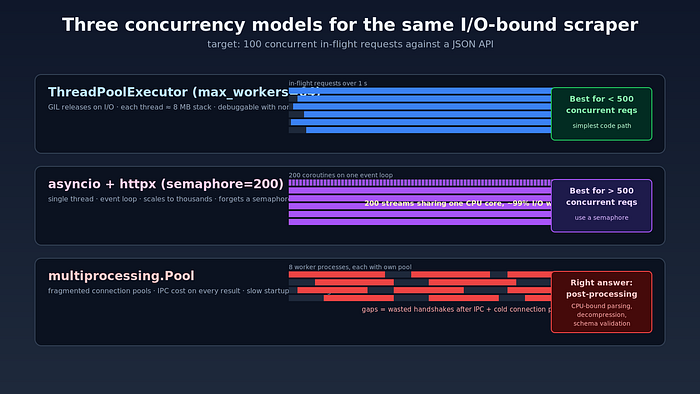
Three concurrency models for the same I/O-bound workload. Multiprocessing is the wrong answer 90% of the time.
Bottleneck 4: HTTP/1.1 head-of-line blocking
If the API supports HTTP/2 — and most modern public APIs do — you can multiplex many in-flight requests over a single TCP connection. That changes the economics significantly:
- One handshake amortized over hundreds of requests, not 64.
- No head-of-line blocking at the TCP layer for parallel streams.
- One persistent TLS session, one congestion window, one set of keep-alive headers.
Empirically, switching httpx.AsyncClient(http2=True) on a typical JSON API drops total wall-clock time on a 1,000-request crawl by 25–40%, with no other change. The bigger the per-payload size and the higher the parallelism, the bigger the win.
A few caveats. HTTP/2 over a flaky cellular connection can be slower than HTTP/1.1 because a single packet loss stalls every stream sharing that TCP connection — the head-of-line blocking moved from L7 to L4. From a stable cloud VM, this is not a problem. HTTP/3 over QUIC removes even that, but client support for scraping is still patchy as of 2026.
Bottleneck 5: you, hitting the rate limit
Eventually, none of the above matters because the API itself stops cooperating. Every public API has a rate limit. Most are not documented. Almost all of them implement some flavour of token bucket: a bucket holds N tokens, refills at R tokens/sec, and your request consumes one. If the bucket is empty you get a 429.
The naive response is exponential backoff. That works but is wasteful — you are constantly probing for the limit by hitting it. A better pattern is:
- Discover the limit with a slow ramp on a single IP.
- Cap your client concurrency at 80% of it — leave headroom for jitter.
- Respect
Retry-Afterwhen it appears in the response headers, instead of guessing a backoff time. - Watch for adaptive limits. Some APIs tighten under load. If your effective throughput drops while your concurrency is constant, the server is throttling you.
Once you are bumping the rate limit, the only knob left is more IPs. That is a different article — proxy pools, sticky sessions, residential vs datacenter — but the principle is the same as the one we started with: throughput equals concurrency divided by latency, and you can scale concurrency horizontally if a single source is capped.
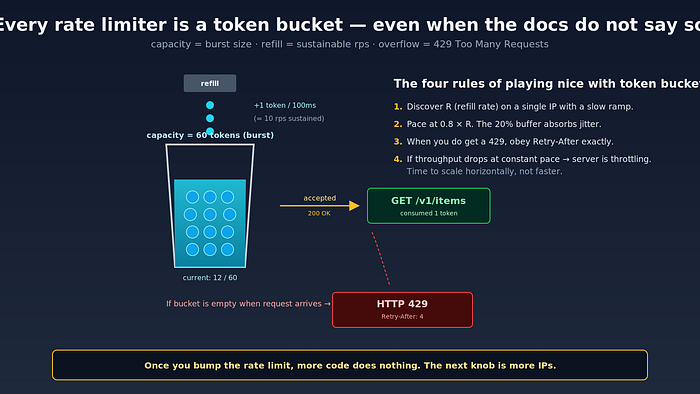
The mental model every rate limiter implements, even when the docs do not say so explicitly.
A miniature benchmark you can actually trust
Most scraping benchmarks on the internet are unreproducible because they leave out the bits that matter: client region, target region, HTTP version, concurrency, connection pool size, payload size. Here is a template that produces numbers you can compare:
# bench.py
import asyncio, time, statistics, httpx
URL = "https://api.example.com/v1/items"
N_REQUESTS = 1_000
CONCURRENCY = 100
async def one(client):
    t0 = time.perf_counter()
    r = await client.get(URL)
    r.raise_for_status()
    return time.perf_counter() - t0
async def main():
    limits = httpx.Limits(max_connections=CONCURRENCY,
                          max_keepalive_connections=CONCURRENCY)
    async with httpx.AsyncClient(http2=True, limits=limits,
                                 timeout=10) as client:
        # warmup — establish pool, prime DNS, finish TLS
        await asyncio.gather(*(one(client) for _ in range(20)))
        sem = asyncio.Semaphore(CONCURRENCY)
        async def bound():
            async with sem:
                return await one(client)
        t0 = time.perf_counter()
        latencies = await asyncio.gather(*(bound() for _ in range(N_REQUESTS)))
        wall = time.perf_counter() - t0
    p50 = statistics.median(latencies) * 1000
    p95 = statistics.quantiles(latencies, n=20)[-1] * 1000
    print(f"wall   : {wall:6.2f}s")
    print(f"rps    : {N_REQUESTS/wall:6.1f}")
    print(f"p50    : {p50:6.1f}ms")
    print(f"p95    : {p95:6.1f}ms")
asyncio.run(main())
Run it from your laptop. Then run it from a VM in the API's home region. The delta between those two numbers is the value of geography. In practice, on a typical public JSON API, I see something like:
Laptop, Paris    -> us-east-1 API:  wall 92s   rps 10.8   p50 240ms
EC2,    Virginia -> us-east-1 API:  wall  6s   rps 168    p50  18ms
That 16x is reproducible. The same code, the same client, the same library version, the same Python interpreter. The only thing that changed is the cable.
What about rewriting in Go / Rust / Bun?
It will not hurt. It will not help much either, on this workload. I have benchmarked equivalent scrapers in Python (asyncio + httpx), Node (undici), and Go (net/http) against the same target from the same region. Within margin of error, they sit within 10–15% of each other on wall-clock time for I/O-bound work. The CPU is idle during the request. The runtime barely matters.
Where Go genuinely pulls ahead is post-processing: parsing 50 MB of JSON, decompressing gzip streams, computing hashes, doing schema validation. If your scraper is "spend 200 ms on a request, then 50 ms parsing the response," then a faster runtime saves you 50 ms × N. Profile before you rewrite.
For the HTTP layer itself, in 2026, picking Python with httpx[http2] and asyncio is a perfectly reasonable default. Pick your language by what your team can maintain, not by HN comment threads.
A pragmatic checklist
If you are starting a high-throughput API scraper today, in the order that gives the biggest wins per hour of effort spent:
- Deploy in the API's region. This is the move. Do it before anything else.
- One
Session/Clientobject for the whole crawl. Connection pool size sized for your concurrency. - HTTP/2 if the target supports it. One line of config.
- Bounded concurrency. Semaphore in async,
max_workersin threads. Pick a number, measure, iterate. - Profile with
curl -w. Cheapest in the business. - Tune for the rate limit, not the network. Once you are saturating the API's quota, your job changes from "make requests faster" to "negotiate with the API politely."
- Only after all of the above: consider a different language.
The pattern, when you compress it down, is this. Network scrapers spend almost all of their wall-clock time waiting for bytes to come back. The bytes' travel time is set by physics. The number of bytes simultaneously in flight is set by your client config. Everything else is a rounding error.
The next time your scraper feels slow, do not open the language benchmarks page. Open curl -w. The seconds you are losing are not where you think they are.
If this was useful, the related piece you probably want next is on residential proxy pools and IP rotation — what you reach for once you have done everything above and the rate limit becomes the hard wall.