June 6, 2026
The Malware Analyst’s Scalpel: How Debugging Forces Malware to Reveal Its Secrets
Inside the reverse-engineering technique analysts use to pause malware, inspect memory, and control execution in real time

Pop123
8 min read
Inside the reverse-engineering technique analysts use to pause malware, inspect memory, and control execution in real time
What looks like a normal program can hide stolen credentials, encrypted payloads, sandbox checks, and command-and-control logic — until a debugger slows everything down.
Debugging is a word most programmers know well.
When software breaks, developers debug it.
They pause execution. They inspect variables. They check where the logic failed. Then they fix the bug.
But in malware analysis, debugging has a different purpose.
The analyst is not trying to fix the program.
The analyst is trying to make the malware expose itself.
Modern malware is built to hide what it does. It may encrypt strings, delay execution, detect virtual machines, avoid sandboxes, or refuse to run when analysis tools are present.
That is why interactive debugging becomes one of the most important skills in advanced malware analysis.
A debugger gives the analyst control over a running program.
It allows them to watch instructions execute one by one, inspect memory, monitor registers, and even change values during runtime to influence the path the malware follows.
In other words:
Debugging turns malware from a black box into something the analyst can slowly dissect.
Why Debugging Matters in Malware Analysis
Malware is still software.
It has logic. It has branches. It has memory. It has function calls. It has conditions that decide what happens next.
The difference is that malicious software is often written to prevent easy inspection.
A static look at the file may reveal almost nothing.
The strings may be encrypted. The imports may be hidden. The payload may not exist on disk yet. The real behavior may only appear after execution.
That is where debugging becomes powerful.
With a debugger, an analyst can observe:
- CPU register values
- stack changes
- memory regions
- function calls
- decrypted strings
- unpacked payloads
- suspicious API usage
- execution branches
This gives the analyst something static analysis cannot always provide:
Runtime truth.
A malware sample may hide everything when sitting idle.
But when it executes, it must eventually reveal something.
Debugging as Digital Surgery
A good way to understand malware debugging is to imagine surgery.
The malware is the patient. The debugger is the surgical tool. The analyst is trying to remove the "bug" without letting the program hide what it is doing.
This is why the image of a person holding a magnifying glass and a surgical tool while removing a bug from a computer is actually a perfect metaphor.

The analyst is not just watching.
They are interacting with the malware.
They can pause it before a dangerous function runs.
They can inspect what data is being passed into memory.
They can force execution down one branch instead of another.
They can modify values to bypass roadblocks inside a controlled lab environment.
That control is what makes debugging so valuable.
Without it, many advanced malware samples would remain difficult to understand.
The Three Main Types of Debuggers
Debuggers can be loosely divided into three categories:
- source-level debuggers
- assembly-level debuggers
- kernel-level debuggers
Each one operates at a different layer.
Each one gives a different type of visibility.
And each one matters depending on what kind of program is being analyzed.
Source-Level Debuggers
Source-level debuggers work directly with source code.
These are the debuggers most programmers use while building software.
They allow developers to see:
- local variables
- functions
- classes
- source lines
- logical flow
- runtime values
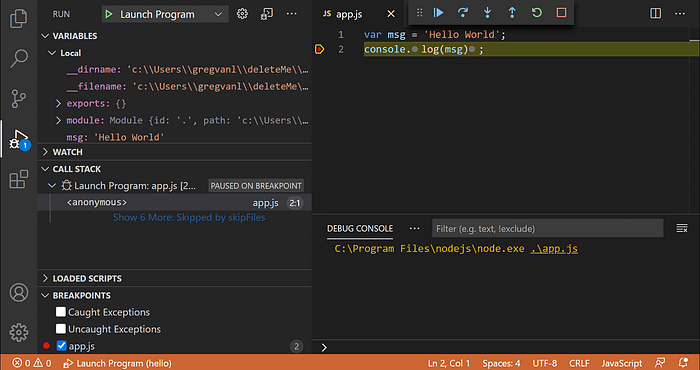
Examples include debugging tools inside IDEs such as Visual Studio, IntelliJ, Eclipse, or VS Code.
For normal software development, this is extremely useful.
The programmer can pause the program on a specific line, inspect variable values, and understand why the application is behaving incorrectly.
But malware analysis is different.
A reverse engineer usually does not have the source code.
They do not get clean function names. They do not get helpful comments. They do not get readable variable names.
They usually get a compiled binary.
That means source-level debugging is rarely the main tool for malware reverse engineering.
It is useful when source code exists.
But for real-world malware samples, analysts usually need to go deeper.
Assembly-Level Debuggers
Assembly-level debugging is where malware analysis becomes serious.
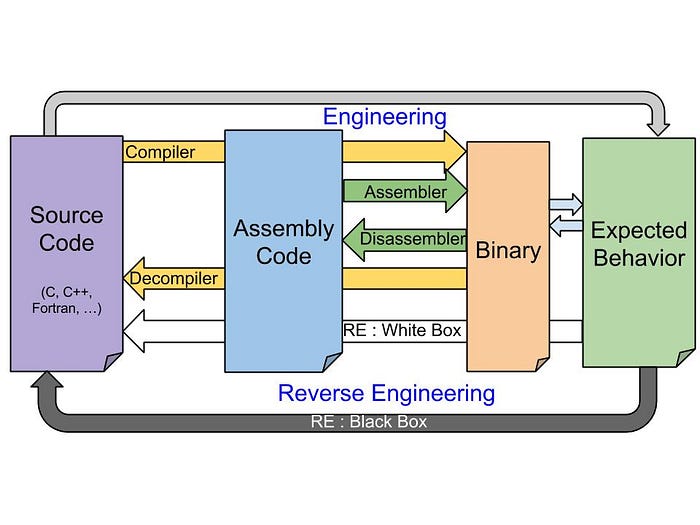
When a program is compiled, the original source code is transformed into machine-level instructions.
The clean structure disappears.
The analyst is left with assembly instructions, memory regions, registers, and execution flow.
This is the most common type of debugging used in malware reverse engineering.
Assembly-level debuggers allow analysts to inspect:
- instructions being executed
- CPU register states
- stack contents
- heap memory
- function calls
- conditional jumps
- loaded DLLs
- runtime behavior
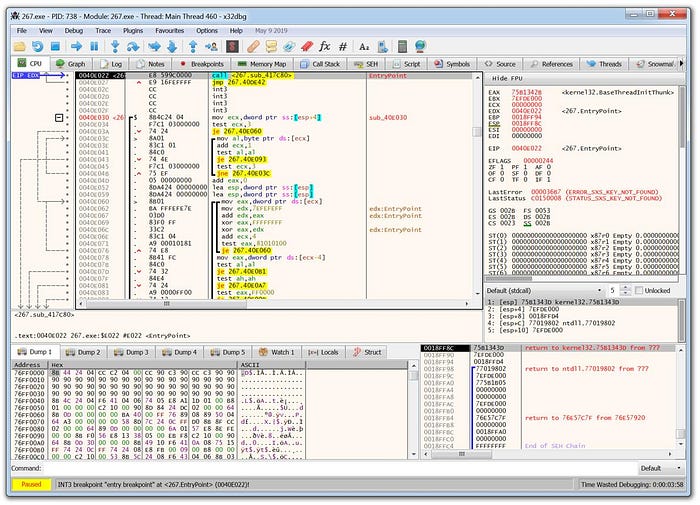
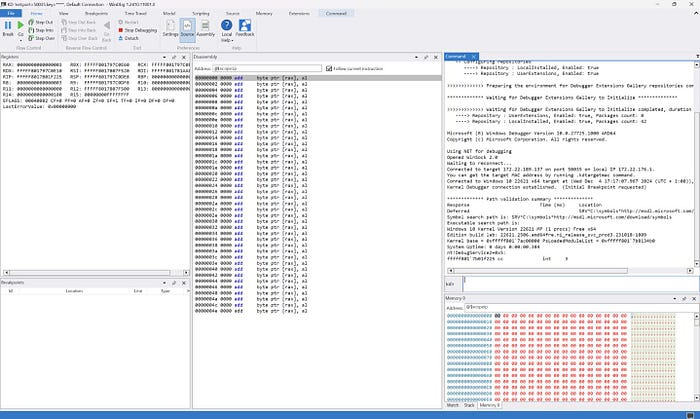
Popular tools include:
- x64dbg
- WinDbg
- OllyDbg
- Immunity Debugger
Using these tools, an analyst can attach to the malware process and control how it runs.
They can step into functions.
They can step over instructions.
They can set breakpoints.
They can inspect what changes after each instruction executes.
This is where malware begins to reveal its structure.
What Analysts Look for While Debugging
During an interactive debugging session, the analyst is usually looking for moments where the malware performs meaningful activity.
This may include:
- decrypting strings
- unpacking code
- resolving API calls
- creating files
- modifying registry keys
- connecting to a server
- injecting code into another process
- reading browser credential databases
- checking for virtual machines
- detecting analysis tools
The key idea is simple:
Malware can hide its intent in a static file.
But it cannot hide every action while running.
At some point, the code has to make decisions.
The debugger lets the analyst stand right at those decision points.
Kernel-Level Debuggers
Kernel-level debuggers operate even deeper than assembly-level debuggers.
Instead of only debugging a user-mode application, kernel debuggers allow analysts to inspect what is happening inside the operating system kernel itself.
This is important when analyzing threats such as:
- rootkits
- malicious drivers
- kernel-mode implants
- privilege escalation malware
- advanced persistence mechanisms
Kernel debugging is more complex because stopping the kernel affects the entire system.
If the kernel hits a breakpoint, the whole operating system can freeze.
That is why kernel debugging often uses two systems:
- one target system running the code
- one host system controlling the debugging session
This separation gives the analyst control without losing visibility.
Kernel-level debugging is not always needed.
But when malware operates close to the operating system itself, it becomes essential.
Why Malware Authors Try to Detect Debuggers
Malware authors know analysts use debuggers.
So they often build anti-debugging logic into their samples.
This logic is designed to answer one question:
"Am I being watched?"
If the malware detects a debugger, it may:
- exit immediately
- crash on purpose
- execute fake logic
- delay execution
- hide its payload
- refuse to decrypt strings
- avoid connecting to its command server
This makes analysis harder.
The malware may appear harmless inside the lab but behave differently on a real victim system.
That is why debugging malware is not just about pressing "run."
It is a controlled investigation.
The analyst has to understand what the malware checks, when it checks it, and how that changes the execution path.
Interactive Debugging Changes the Game
The most powerful part of debugging is interaction.
The analyst is not limited to watching passively.
They can influence the execution.
They can change variable values.
They can alter register states.
They can redirect flow.
They can force malware to continue past a failed check.
They can pause execution before a payload decrypts and then dump that payload from memory.
That is why debugging is so important in advanced malware analysis.
It gives analysts control over something that was designed to avoid control.
A Typical Malware Debugging Workflow
A professional malware debugging workflow usually happens inside a controlled lab.
Never on a personal machine.
Never on a production system.
Never on a network where the malware can reach real assets.
A typical workflow may look like this:
- Prepare an isolated virtual machine
- Take a clean snapshot
- Load the malware sample into the analysis environment
- Open the sample in a debugger
- Observe imports, memory, and execution flow
- Set breakpoints around suspicious behavior
- Run the malware step by step
- Monitor memory and register changes
- Extract runtime indicators
- Document findings safely
The goal is not to execute malware blindly.
The goal is to control the environment enough to understand the malware without allowing it to cause damage.
What Debugging Can Reveal
Debugging can expose details that may not appear during static analysis.
For example:
- hidden command-and-control domains
- decrypted configuration data
- unpacked payloads
- persistence mechanisms
- credential theft logic
- anti-analysis checks
- process injection behavior
- file system activity
- registry modifications
This is why many malware samples only become understandable after runtime analysis.
Some malware families are packed or encrypted specifically to prevent analysts from reading them directly.
But once the malware runs, it often has to unpack itself in memory.
That moment is valuable.
And a debugger lets the analyst capture it.
Debuggers Used in Malware Analysis
Some commonly used debugging tools include:
x64dbg
WinDbg
OllyDbg
Immunity Debugger
GDB
IDA Pro Debugger
Radare2 / r2dbg
x64dbg
WinDbg
OllyDbg
Immunity Debugger
GDB
IDA Pro Debugger
Radare2 / r2dbgEach tool has its own strengths.
x64dbg is popular for Windows user-mode malware analysis.
WinDbg is powerful for both user-mode and kernel-mode debugging.
GDB is widely used for Linux binaries.
IDA Pro and Ghidra are often used alongside debuggers for deeper reverse engineering workflows.
The tool matters.
But the analyst's thinking matters more.
A debugger only shows what is happening.
The analyst still has to understand why it is happening.
The Real Skill: Reading Execution Flow
Debugging malware is not only about knowing tools.
It is about reading execution flow.
A good analyst learns to recognize patterns:
- suspicious jumps
- unusual memory permissions
- decrypted buffers
- API resolution
- packed code sections
- process injection routines
- sandbox checks
- credential access behavior
This skill takes time.
At first, assembly looks overwhelming.
But slowly, patterns begin to appear.
A conditional jump becomes a decision.
A register value becomes a clue.
A memory buffer becomes a hidden payload.
A function call becomes a behavior.
That is when debugging becomes less about stepping through instructions and more about understanding intent.
Final Thoughts
Malware debugging is one of the most important skills in advanced reverse engineering.
It gives analysts the ability to pause a malicious program, inspect its internal state, and control how it executes.
Source-level debuggers help developers fix software.
Assembly-level debuggers help malware analysts understand compiled binaries.
Kernel-level debuggers help researchers investigate threats operating deep inside the operating system.
Together, they form one of the most powerful toolsets in malware analysis.
Modern malware is built to hide.
Debugging is how analysts force it to speak.
References & Further Reading
- Microsoft WinDbg Documentation
- x64dbg Official Documentation
- Malware Unicorn Reverse Engineering Tutorials
- Practical Malware Analysis — No Starch Press
- MITRE ATT&CK Framework
- Ghidra Software Reverse Engineering Framework
- IDA Pro Debugger Documentation
If You Enjoyed This Writeup
Malware analysis is one of the most technical and fascinating areas of cybersecurity.
If this breakdown helped you understand how debugging fits into reverse engineering, consider sharing it with someone learning malware analysis, leaving your thoughts, or following for more cybersecurity writeups.
The deeper malware hides, the more valuable debugging becomes.