
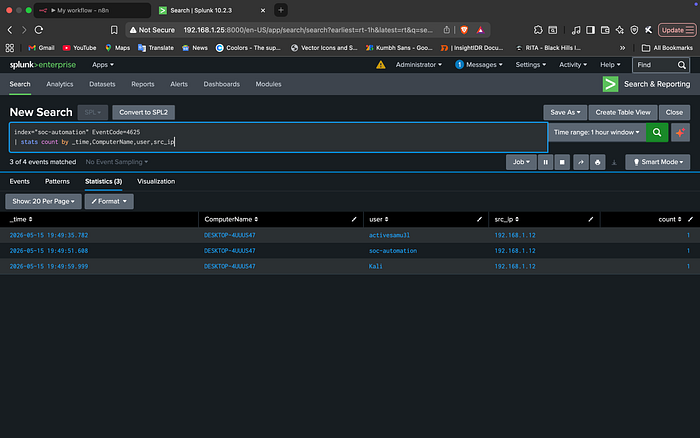
In any Security Operations Center (SOC), the noise is relentless. Windows Event 4625 (Failed Logon) is one of the most frequent alerts an analyst faces. Individually, they are noise; in a cluster, they are a brute-force attack.
The standard manual triage process is a "pivot-heavy" grind: identify the IP in Splunk, check its reputation in AbuseIPDB, determine if the targeted user exists, and finally, summarize the risk. When this happens 50 times a shift, critical details get missed. I wanted to build a "reasoning engine" that doesn't just move data, but actually contextually enriches it before an analyst even sees it.
The Blueprint: A Modern SOC Architecture
To solve this, I designed a pipeline that bridges the gap between raw telemetry and actionable intelligence.
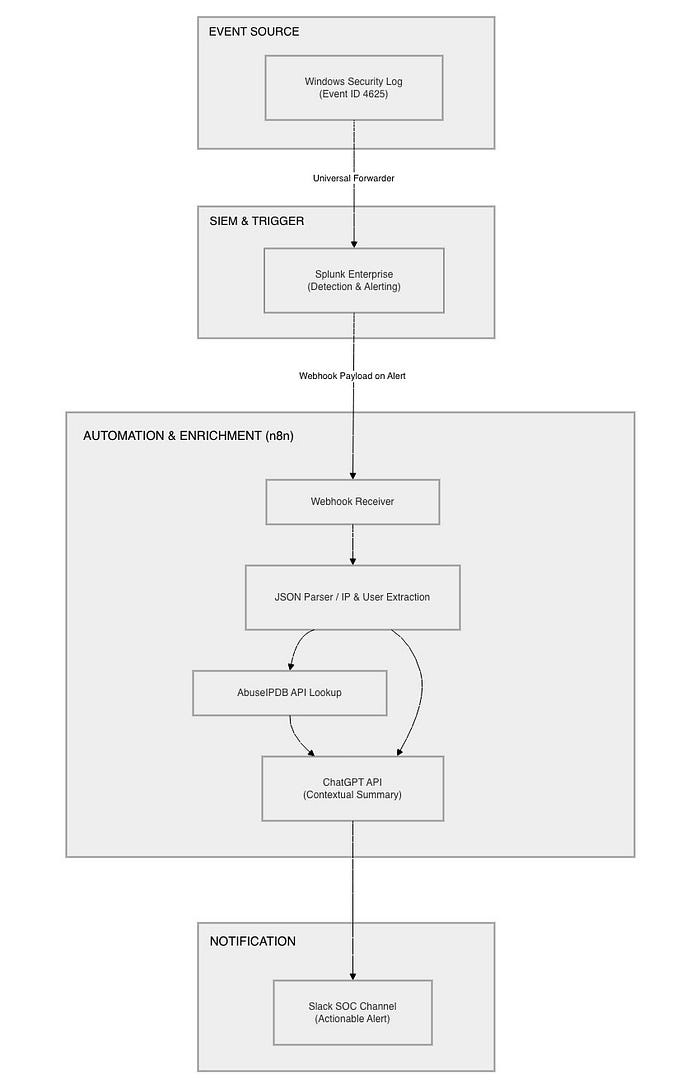
The logic is simple but powerful:
- The Source: Windows endpoints forwarding logs.
- The SIEM: Splunk Enterprise for detection logic.
- The Orchestrator: n8n acting as the "nervous system."
- The Brain: ChatGPT using Agentic "Tool-Use" for reasoning.
- The Interface: Slack for immediate analyst notification.
Building the Lab: From Ubuntu to Windows
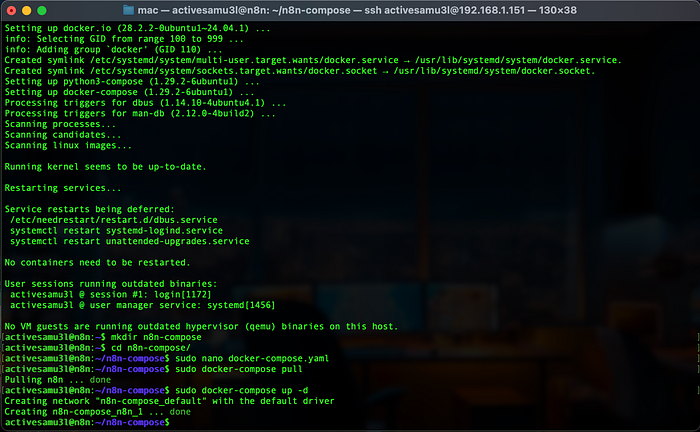
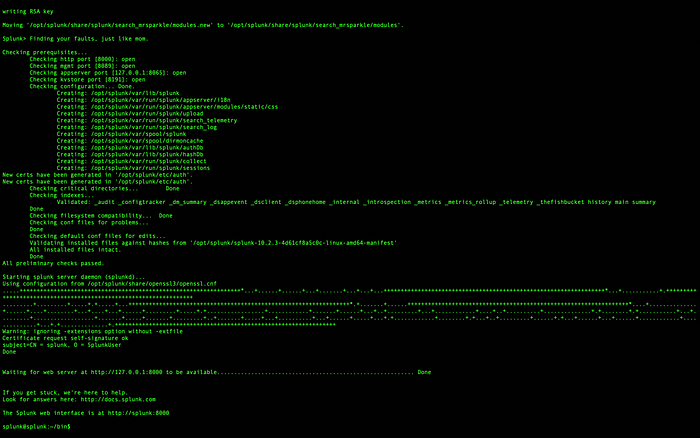
Every engineering project is only as good as its foundation. I built this entirely on-premises, deploying Splunk Enterprise and n8n on dedicated Ubuntu servers to simulate a real-world enterprise environment.
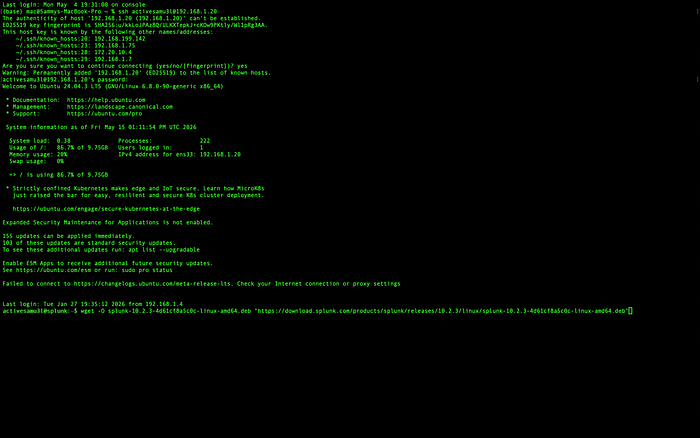
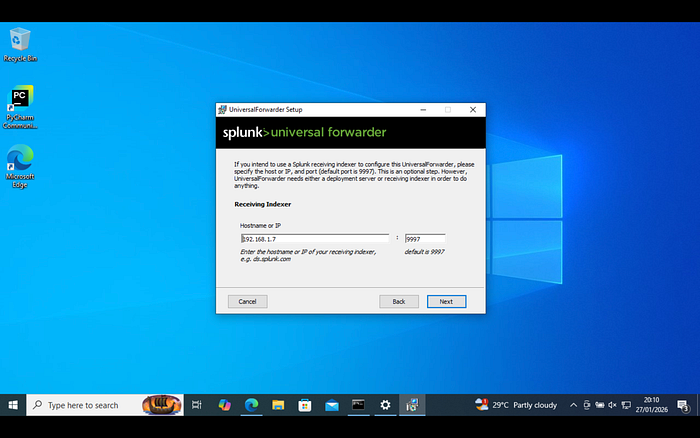
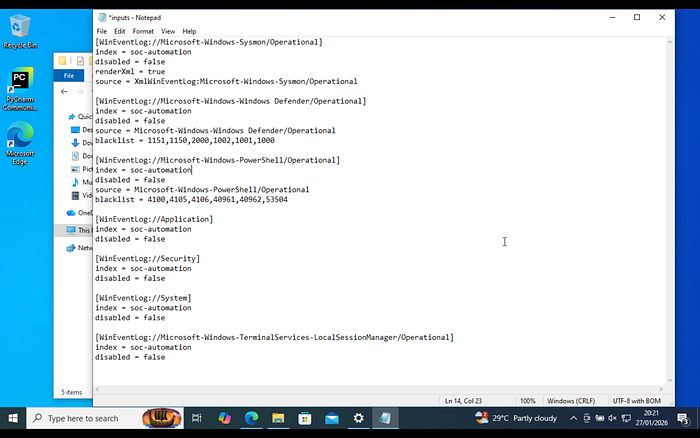
On the Windows side, I configured the Universal Forwarder to ship Security Logs back to the SIEM. This ensures that the detection engine has visibility into every failed login attempt across the environment.
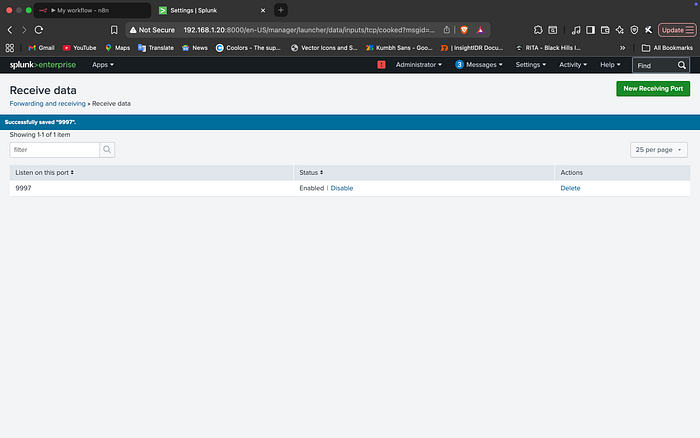
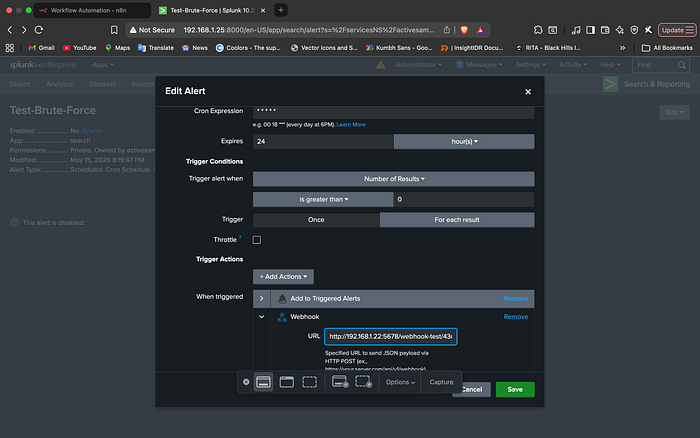
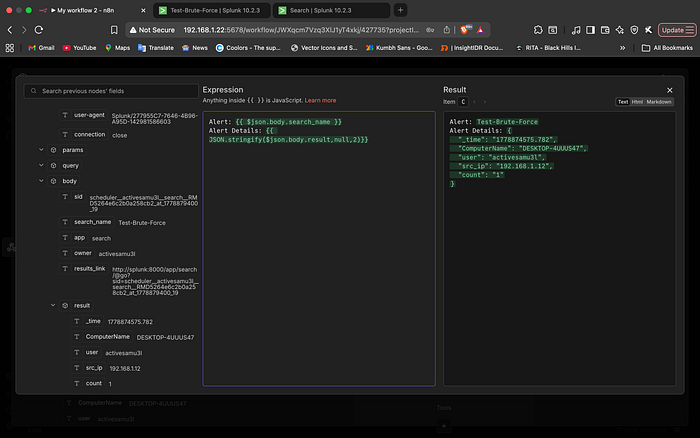
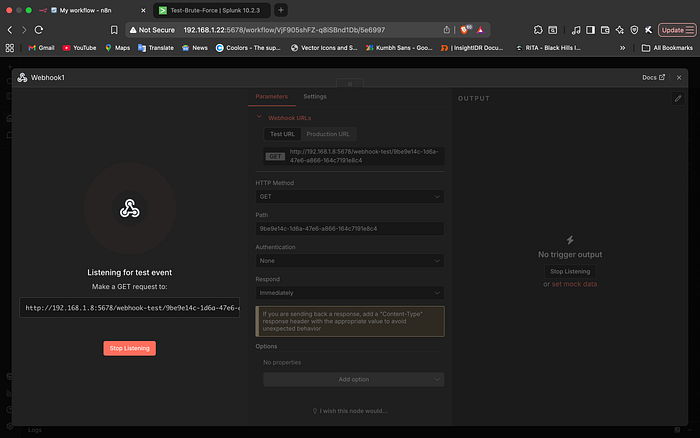
Once the logs were flowing, I crafted a Splunk alert that triggers a Webhook POST request whenever a brute-force threshold is met. This moves the data from the SIEM into the orchestration center

The final pieces of the puzzle involved configuring the "edges" of the workflow: ChatGPT and Slack.
- ChatGPT: I connected the OpenAI API and crafted the system prompt that instructs the model to act as a Tier 1 SOC Analyst — defining its persona and reporting logic.
- Slack: I created a dedicated Slack App with an Incoming Webhook to ensure the pipeline had a clean, formatted destination for the final reports.
With all the endpoints ready, I used n8n as the "glue" to tie the entire lifecycle together.

The "Agentic" Shift: Reasoning Over Rules
What makes this workflow "Agentic" rather than just a basic automation script is the Reasoning Loop.
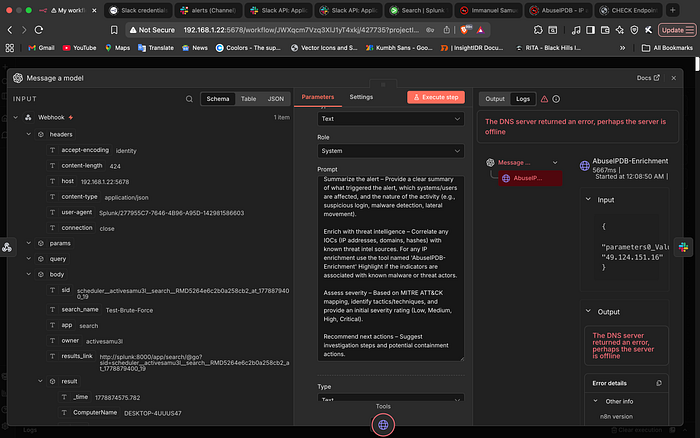
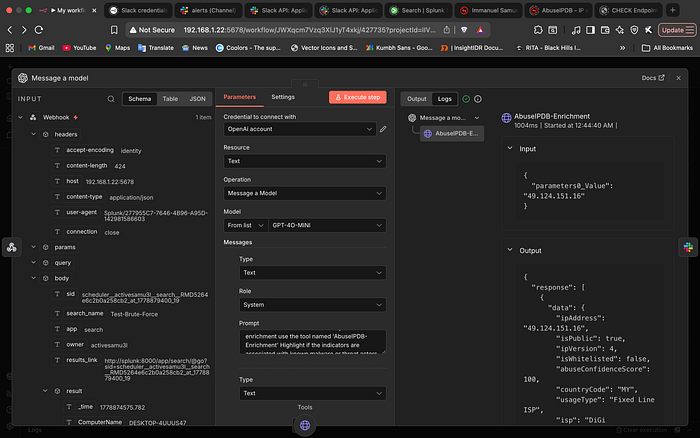
In 2026, we are moving away from rigid "If/Then" chains. Instead of hard-coding a path that always calls an API, I utilized n8n's AI Agent capabilities. I provided ChatGPT with the AbuseIPDB API as a "Tool." When the payload hits the AI node, the model analyzes the data and "realizes" it cannot fulfill the summary request without more context. It autonomously decides to call the AbuseIPDB tool, gathers the reputation data, and then synthesizes everything into a human-readable report.
The Interface: Engineering a Secure Slack Integration
A SOC workflow is only as effective as its delivery mechanism. I chose Slack for this project to ensure that high-fidelity alerts land exactly where the analysts are already working. However, simply using a webhook wasn't enough; I wanted to build a formal Slack App to ensure secure, scoped communication.
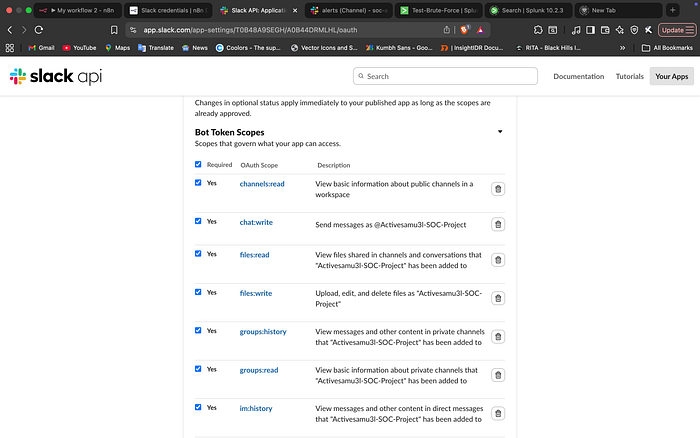
1. Designing for Least Privilege
In a production environment, you never give a bot more access than it needs. I navigated the Slack API dashboard to define specific OAuth Scopes. By selecting only chat:write, channels:read, and groups:read, I ensured the bot could post alerts without having the power to read sensitive private messages or modify workspace settings.
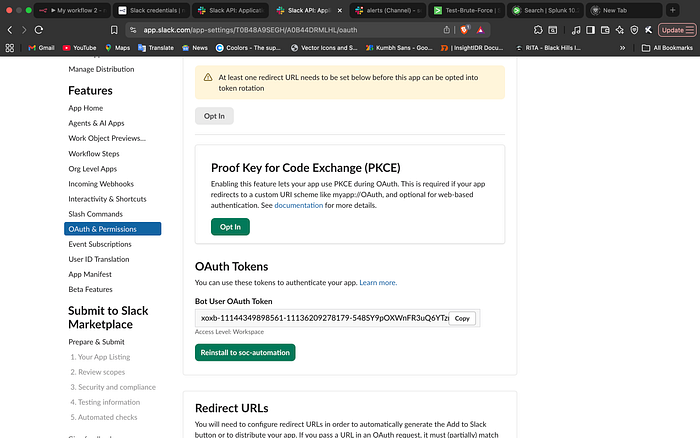
2. The Handshake: OAuth & Token Generation
Once the scopes were defined, I authorized the app to my workspace. This generated the Bot User OAuth Token, which serves as the secure key for n8n to communicate with Slack.
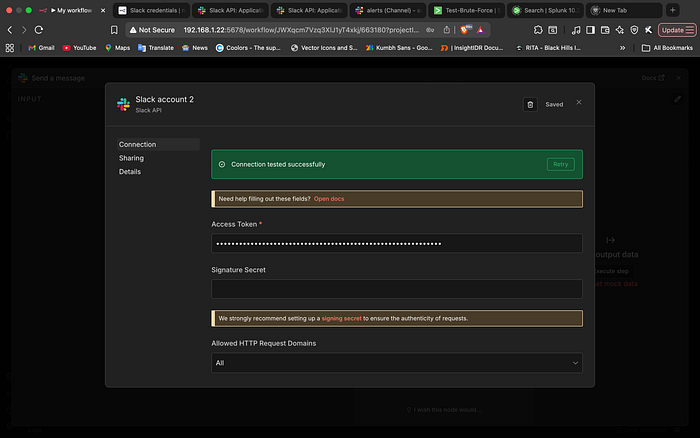
3. Final Integration in n8n
With the token ready, I finalized the Slack node in n8n. The connection test was successful, and I mapped the final "Reasoning Text" from ChatGPT to the designated #alerts channel.
Lab Realities: Navigating Simulation and Synthetic Data
Developing in an isolated on-prem lab presents a unique hurdle: internal IPs (192.168.x.x) have no reputation in public databases.
To validate the enrichment logic, I implemented a Simulation Layer. I strategically injected a known malicious external IP into the workflow payload. This allowed me to test exactly how the AI Agent would pivot when it encountered a real-world threat, ensuring the summary delivered to Slack was contextually rich and actionable. This "Synthetic Data Injection" is a critical skill for testing security pipelines in isolated environments without exposing lab assets to the open internet.
The Struggle: Troubleshooting the Pipeline
Engineering is rarely a straight line. Building this in an on-premises lab meant I wasn't just dealing with code; I was dealing with the underlying infrastructure. Here are the four most critical hurdles I had to clear:
1. Networking Volatility: The "Stale IP" Headache
Since the setup was on-prem, there were times I had to restart or respawn the Splunk and n8n VMs. In a lab environment without static IP reservations, this meant the IPs changed. This ripple effect broke the entire pipeline:
- The Fix: I had to update the
docker-compose.yamlfor n8n and reconfigure the Universal Forwarder's output on the Windows VM to point to the new Splunk IP. - The Lesson: I learned the importance of checking the "handshake" first. I spent too much time wondering why a GET request to the webhook was failing, only to realize n8n was still listening for an IP that no longer existed.
2. The DNS Deadlock: Container Networking
One of the most frustrating moments was when the n8n workflow was technically "perfect," but the AI node kept failing. The error message was vague: "The DNS server returned an error."
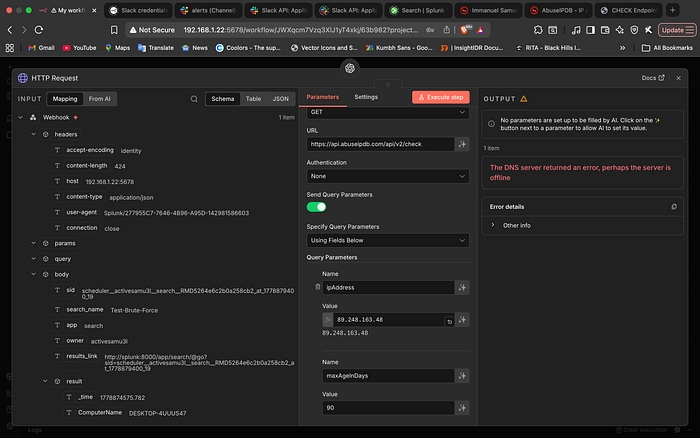
I had to dive into the terminal to diagnose the issue. I discovered that while the n8n container could ping a public IP like 8.8.8.8, it couldn't resolve google.com or the AbuseIPDB API endpoint.
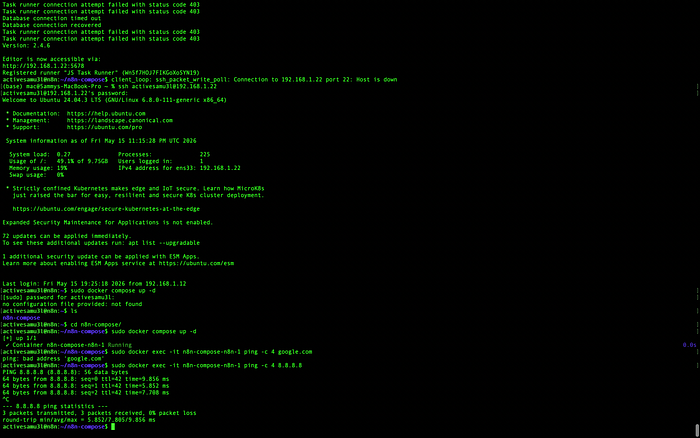
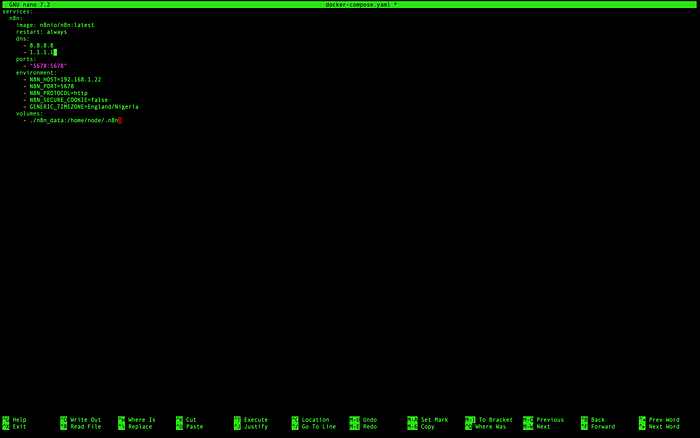
- The Fix: I modified the
docker-compose.yamlto explicitly define the DNS servers for the n8n container, ensuring it could resolve external threat intelligence APIs.
3. Permissions and Persistence: The Linux/Windows Gap
Finally, I hit the classic "Permission Denied" wall on both ends of the stack:
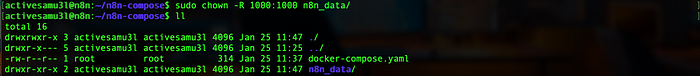
- n8n Data: I had to use
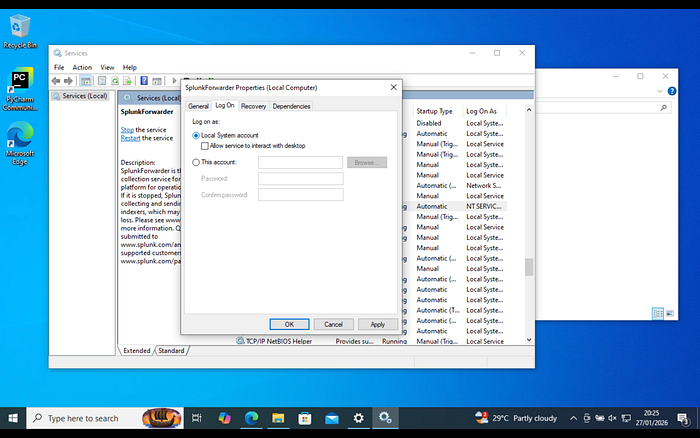
chownto fix permissions on then8n_datafolder to ensure the container could persist its configuration. - Universal Forwarder: On the Windows side, the UF was struggling to read certain security logs. I had to pivot to the Windows Services menu and ensure the service was running as the Local System account rather than a restricted service account.
4. The "Invisible" Bot: The 'not_in_channel' Error
One of the most common hurdles in Slack automation is the "not_in_channel" error. Even though the bot was authorized to the workspace, the first few test runs failed because the bot hadn't been manually invited to the #alerts channel.
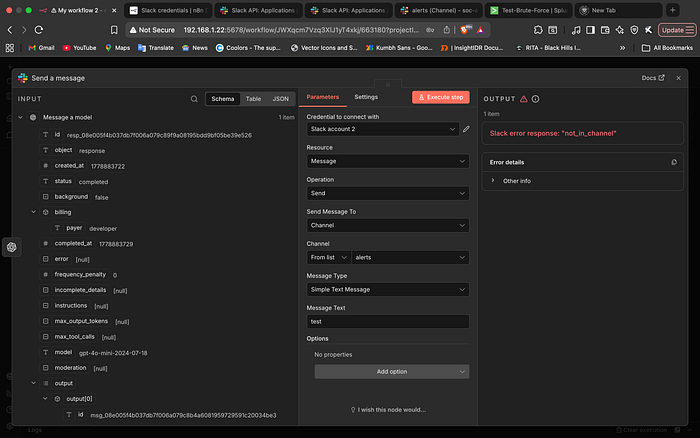
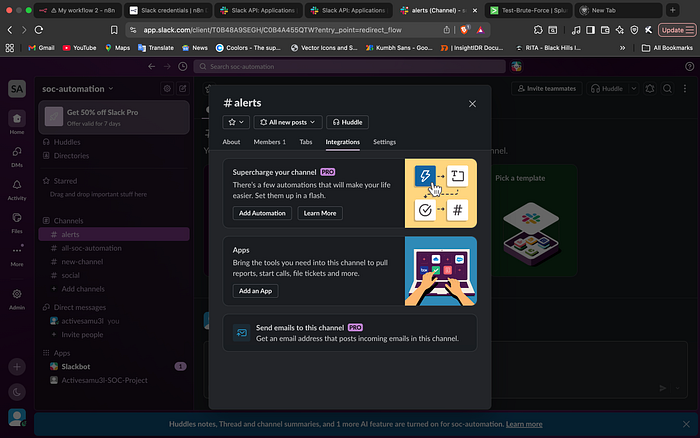
- The Fix: I had to navigate to the channel settings and manually add the "Activesamu3l-SOC-Project" app to the conversation. This was a great reminder that API permissions (Scopes) and Application Presence (Membership) are two different layers of security.
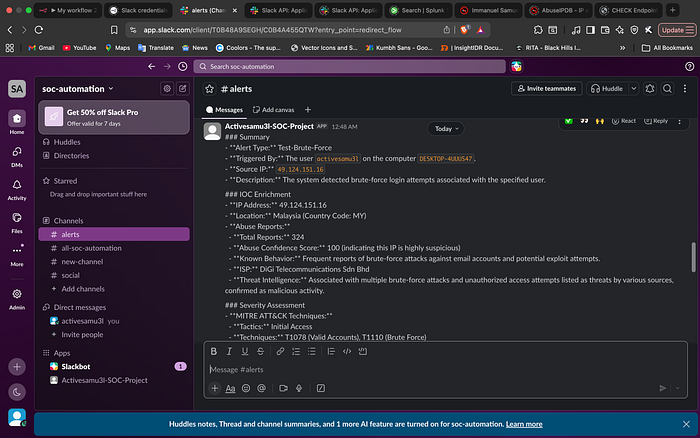
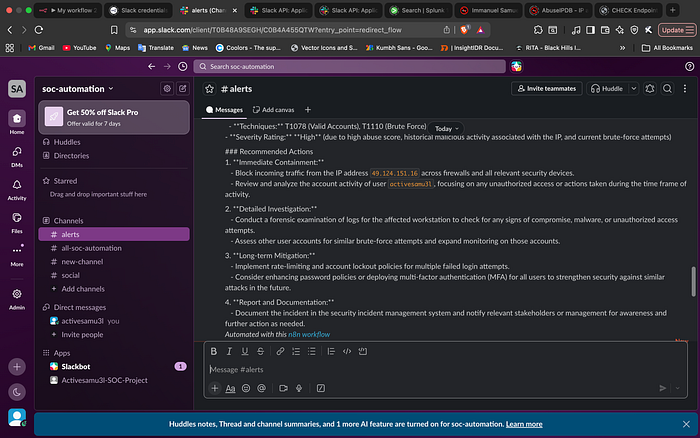
Real-World Output: The Slack Notification
The success of the project is measured by the final Slack notification. By the time the alert hits the channel, the analyst doesn't have to pivot to a single other tool. They have the user, the count, the IP reputation, and a high-level summary of the risk provided by the AI Agent.
Conclusion and Future Directions
This Proof of Concept (PoC) proves that even a lightweight, low-cost stack can significantly cut down triage time. By moving the "thinking" part of the process to an AI Agent, we allow analysts to focus on actual investigation rather than repetitive data entry.
While this iteration focuses on enrichment and notification, the architecture is designed for modularity. A logical evolution for this pipeline in a production environment would be the transition from a passive notification system to an Active Response model.
By integrating "Action Buttons" into the Slack message, an analyst could theoretically trigger an automated block on a firewall or isolate a compromised host with a single click. Even without that final automated step, the value is clear: we've moved from raw, noisy logs to a high-fidelity alert that is ready for a human decision in seconds.