
Introduction
JavaScript is the most honest part of any modern web application. It tells you routes that don't appear in the nav, API endpoints that aren't documented, auth logic that wasn't designed for public eyes, and third-party integrations that were set up and forgotten.
This is not a theory article. This is the exact workflow I use on every new program — passive-first, hypothesis-driven, and built around real tools with real output. Let's get into it.
This article is written strictly for authorized security research within in-scope bug bounty programs. Never perform any of these techniques on targets you do not have explicit written permission to test.

Phase 1 — First 30 minutes on a new target
Phase 1: The First 30 Minutes
Before touching any active scanning tool, I open three browser tabs and start with what's already public.
Goal
-Build a JS inventory without touching the server
-Understand the tech stack from script filenames and bundle patterns
-Find JS files that the current version of the site doesn't link to anymore
-Identify which JS files are worth reading vs which are vendor noise
Step 1: View Page Source (not DevTools — actual source)
Open view-source:https://target.com in your browser. Do not use DevTools yet. Raw source shows you exactly what the server is returning — no JavaScript execution, no dynamic injection.
Look for every <script src="…"> tag. Build a list. Pay attention to:
- Hashed filenames like main.a3f9c1.js — these are Webpack/Vite bundles
- Descriptive filenames like admin-panel.js, checkout-flow.js — these are gold
- External CDN scripts — note them, they're usually not your target
- Inline <script> blocks — these sometimes contain config, API keys, or environment flags
Step 2: DevTools Network Tab — capture everything on load
Open DevTools (F12), go to the Network tab, filter by JS, then hard-reload (Ctrl+Shift+R). You'll now see every JS file that actually loads — including lazy-loaded chunks triggered by the app framework.
Sort by size descending. The large files are where business logic lives. The small files are often configuration shims or polyfills — skip them initially.
Click the three-dot menu and export the HAR file. This gives you a timestamped record of everything that loaded, useful for comparison later.
Step 3: Wayback Machine — what JS existed that doesn't now
Go to https://web.archive.org/web/*/target.com/static/js/*
Filter by JS file type. You're looking for:
- JS files from 12–36 months ago that no longer exist on the live site
- Different bundle hashes from the same period as a reported incident or feature deprecation
- Admin or internal paths that appeared briefly and were removed
Historical JS files frequently contain logic that was removed from production but never removed from the API backend. An endpoint referenced in a 2-year-old JS file often still responds.
Phase 2 — Passive intelligence gathering
Phase 2: AlienVault OTX, VirusTotal, and Source Intelligence
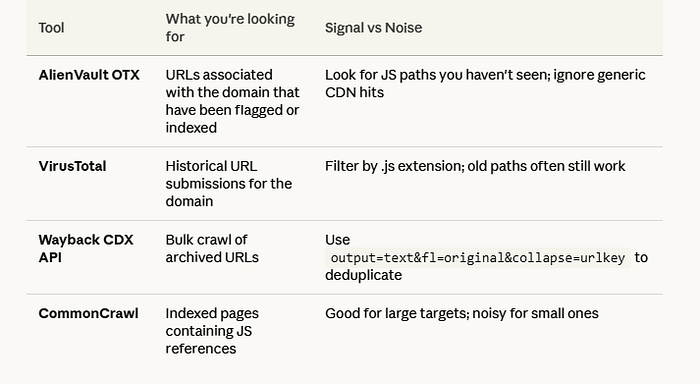
The Wayback CDX API query you should memorize
https://web.archive.org/cdx/search/cdx?url=target.com/*&output=text&fl=original&collapse=urlkey&filter=mimetype:application/javascriptThis returns a deduplicated list of every JS URL ever crawled for the domain. Pipe it to a file. This is your master JS inventory for passive analysis. It costs you nothing and touches the target zero times.
Phase 3 — Collecting and deduplicating
Phase 3: Collecting JS Files — Tools and Workflow
Tool: getJS
getJS — url https://target.com — complete | tee target_js_live.txtgetJS crawls the page and extracts every JS URL it can find, including dynamically injected ones. The — complete flag resolves relative paths to full URLs. This is your live-site inventory.
Tool: gau (GetAllUrls)
gau target.com | grep "\.js$" | sort -u | tee target_js_passive.txtgau pulls from Wayback, OTX, and CommonCrawl simultaneously. The grep filters to JS only. sort -u deduplicates. Now you have historical URLs you can compare against what's live.
Deduplication and tagging
cat target_js_live.txt target_js_passive.txt | sort -u > all_js_urls.txt
comm -23 <(sort target_js_passive.txt) <(sort target_js_live.txt) > historical_only.txt
historical_only.txt contains JS URLs that exist in historical data but not on the current live site. These are your highest-priority files to check manually. Each one is a potential ghost endpoint.
Phase 4 — Triage: which 20 of 200 files matter
If I Had 200 JS Files — Which 20 Would I Review First?
This is the question that separates disciplined hunters from people who burn 12 hours on vendor libraries. Here's my exact triage logic:
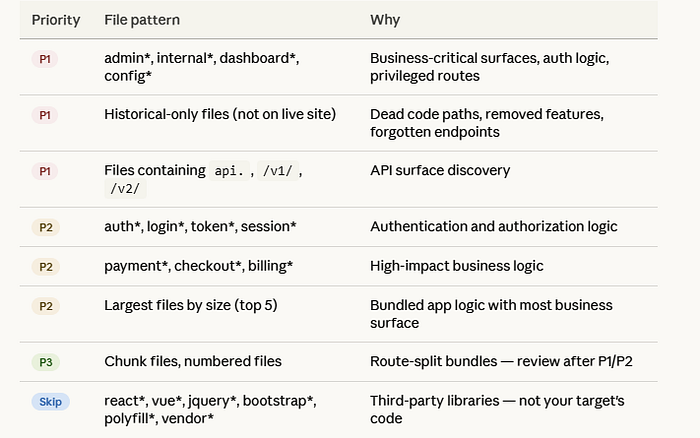
Vendor library files are almost never where your bug is. Spending 3 hours reading React internals is not recon — it's procrastination.
Phase 5 — Reading JS: beautification and analysis
Phase 5: JS Beautification and Manual Reading
Step 1: Beautify before you read
Minified JS is unreadable. Run every file through a formatter before analysis:
js-beautify -f target_bundle.js -o target_bundle_pretty.jsOr use the browser: in DevTools Sources tab, click the {} (pretty-print) button at the bottom left of any JS file. Instant readability.
Step 2: Source maps — if the target exposes them, use them
Check if main.js.map exists alongside the bundle. Source maps reconstruct the original developer-written code — variable names, file structure, comments. They're occasionally left deployed by accident.
curl -s https://target.com/static/js/main.a3f9c1.js.map | jq '.sources[]'If this returns a list of files, you have the full source tree. This is an immediate P2 finding on its own (exposed source maps), and your recon quality just jumped dramatically.
Step 3: What to search for inside JS files
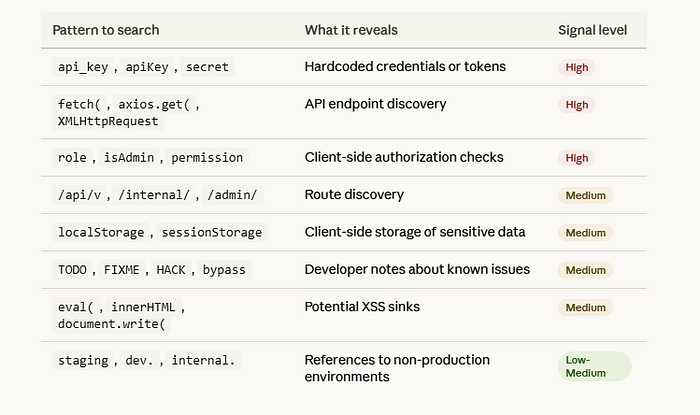
Practical grep workflow for batch analysis
grep -rh "api_key\|apiKey\|secret\|token\|password" ./pretty_js/ | sort -u > secrets_candidates.txt
grep -rh "fetch(\|axios\.\|XMLHttpRequest" ./pretty_js/ | grep -o '"[^"]*api[^"]*"' | sort -u > api_endpoints.txt
grep -rh "isAdmin\|role.*===\|permission" ./pretty_js/ > authz_logic.txt
You now have three targeted files to review manually instead of reading every line of every file.
Phase 6 — Current vs historical comparison
Phase 6: Current vs Historical JS Comparison
This is one of the highest-ROI activities in JS recon and almost nobody talks about it. The idea is simple: compare what's in an old JS file against the current version. Features get removed from the frontend — but the backend API often keeps accepting those requests.
Workflow
curl -s "https://web.archive.org/web/20230101000000*/target.com/static/js/main.js" \
  | grep -o 'https://web.archive.org/web/[^"]*main[^"]*\.js' \
  | head -5 > archived_js_urls.txt

while read url; do
  filename=$(echo "$url" | md5sum | cut -d' ' -f1)
  curl -s "$url" -o "archive_${filename}.js"
done < archived_js_urls.txt
Then diff the endpoints found in old files vs current files:
diff <(grep -oh '"\/api\/[^"]*"' current_bundle_pretty.js | sort -u) \
     <(grep -oh '"\/api\/[^"]*"' archive_*.js | sort -u)
Lines appearing only in the archive output are endpoints that were removed from the frontend. Manually test each one with authentication. You'd be surprised how many still respond with 200.
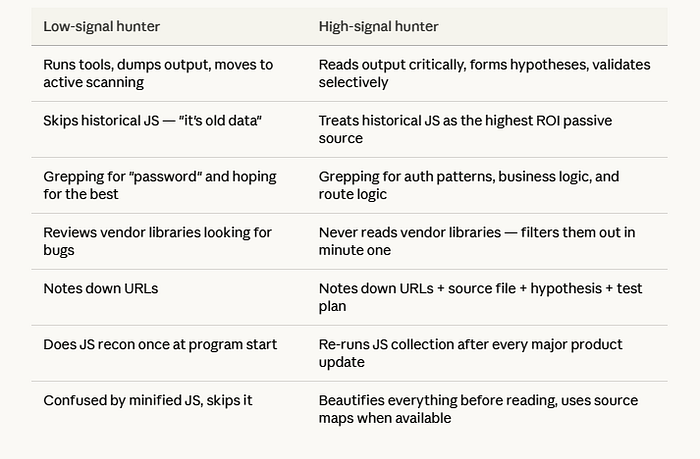
What top hunters teach us
What Public Top-Hunter Writeups and X.com Recon Threads Teach Us About JavaScript Recon
Reading through high-quality public recon content from experienced hunters reveals a consistent set of principles that separate their work from low-signal hunters. These aren't tips — they're a mindset shift.
1. Collect with intent, not volume
Low-signal hunters collect 10,000 URLs and call it recon. High-signal hunters collect 200 URLs with context attached to each one. The question is never "how many JS files did I find?" — it's "which of these JS files touches auth, payment, or admin surfaces?"
2. Business context drives prioritization
Before reading a single line of JS, elite hunters understand what the application does commercially. A fintech app with a transfer.js file and a SaaS admin panel with a user-management.js file are both high-priority — because they map to high-impact business operations, not just because of naming conventions.
3. Historical assets are underrated
Top hunters consistently report findings based on Wayback Machine data. The pattern is always the same: endpoint removed from frontend, endpoint still active on backend, authentication check missing because the feature was "deprecated." Checking historical JS is free passive recon that most hunters skip.
4. Raw output is not insight
Running linkfinder and dumping 800 endpoints into a file is not recon — it's data collection. Insight is when you look at those 800 endpoints, notice that /api/v2/admin/users doesn't match any documented API surface, and form a hypothesis about why it exists and whether it enforces authorization.
5. Document the clue, not just the finding
The best hunters note the reasoning behind every lead. Not just "found endpoint X" but "found endpoint X in file Y which was only present in builds from Q3 2022, suggests this was part of a deprecated admin migration that may not have been fully decommissioned on the API side." That note tells you how to validate the hypothesis.
6. Revisit after each product update
JS recon is not a one-time activity. Targets deploy new bundles constantly. Setting a reminder to re-run your collection workflow every few weeks on active programs frequently surfaces new endpoints introduced with product updates.
Note-taking template
# 🛠️ JS Reconnaissance Report: [Program Name]
**Date:** 2026-04-08
**Scope:** `*.target.com`

---

## 📊 Inventory & Surface Area
* **Live JS Files:** [Count]
* **Historical-only Files:** [Count] (e.g., `legacy-auth.js`, `v1-dashboard.js`)
* **Source Maps:** [Exposed / Not Found]
    * *Note: If exposed, run `restore-source-tree` immediately.*

## 🎯 Priority Analysis
| File | Priority Logic | Key Findings / Indicators |
| :--- | :--- | :--- |
| `filename.js` | [Keywords: admin, config, v1] | [Endpoints, hardcoded keys, logic] |

## 🔍 API Endpoint Discovery
* `[Endpoint]` — [Source File + Line] — [Auth Requirement]
* `[Endpoint]` — [Source: WayBack/Historical] — [Hypothesis: Hidden Functionality]

## 🧪 Leads & Hypotheses
1.  **Hypothesis Name:** [e.g., IDOR on Legacy Export]
    * **Source:** [File Name]
    * **Status:** 🟡 Pending / 🔴 Dead End / 🟢 Confirmed
    * **Test Plan:** [Step-by-step validation]

2.  **Hypothesis Name:** [e.g., Client-side Role Enforcement]
    * **Source:** [File Name]
    * **Status:** 🟡 Pending

## 📋 Next Steps
- [ ] Map historical endpoints to current API documentation.
- [ ] Run `secretfinder` or custom regex for API keys/tokens.
- [ ] Manually verify "hidden" parameters found in JS objects.
Advanced JS Recon Checklist
- Viewed raw page source (not DevTools) for all script tags
- Captured full network JS load via DevTools HAR export
- Queried Wayback CDX API for full historical JS URL list
- Ran gau and getJS, deduplicated, created historical-only list
- Checked for exposed source maps (.js.map files)
- Triaged 200+ files by name pattern — skipped all vendor libraries
- Beautified all P1/P2 files before reading
- Grepped for: api_key, apiKey, secret, fetch(, isAdmin, /api/v, eval(
- Extracted all API endpoint strings from top priority files
- Diffed current bundle vs historical bundle for new/removed endpoints
- Tested each historical-only endpoint with authenticated session
- Noted all client-side auth checks as IDOR hypotheses
- Checked developer comments for TODO/FIXME/HACK notes
- Searched for staging/dev environment references
- Documented all leads with hypothesis and test plan — not just URLs
- Set reminder to re-run collection workflow in 2–3 weeks
What Separates Top Hunters from Low-Signal Hunters
Conclusion
JavaScript recon is not about running the most tools. It is about reading the right files with the right questions in mind. Every application leaks its architecture through its JavaScript — routes, roles, endpoints, integrations, and forgotten features are all sitting in plain text waiting to be read.
The workflow described here — passive collection first, historical comparison, triage by business surface, hypothesis-driven manual review — is the same pattern used by hunters who find high-severity bugs consistently. None of it requires special access. All of it requires discipline.
The bug is rarely where you scan first. It is in the endpoint nobody remembered was there.
Build your inventory. Read the right files. Form hypotheses. Document everything. Go test.