

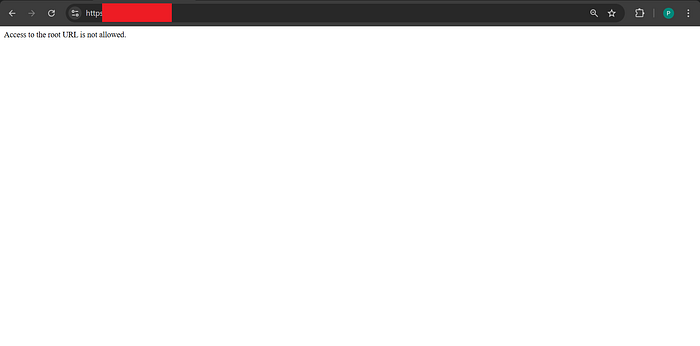
Hi everyone, I've been uploading material related to cybersecurity for a while now. So today I want to share how I discovered sensitive information exposure on a website that initially only responded with "Access to the root URL is not allowed." Honestly, at first, I couldn't believe it was possible.
Disclaimer: "All information contained in this article is for educational purposes only. All criminal acts are matters for which each perpetrator must be held responsible."
BRIEF EXPLANATIONI
can describe the flow of how I found it like this:
Misconfiguration → Information Disclosure → Attack Surface Expansion
In this discovery, I found 3 things in one place with the following explanation:
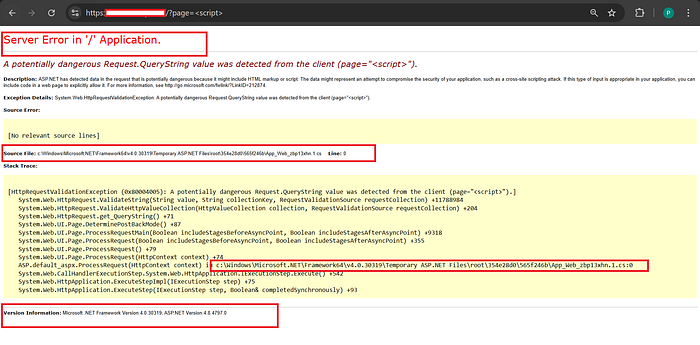
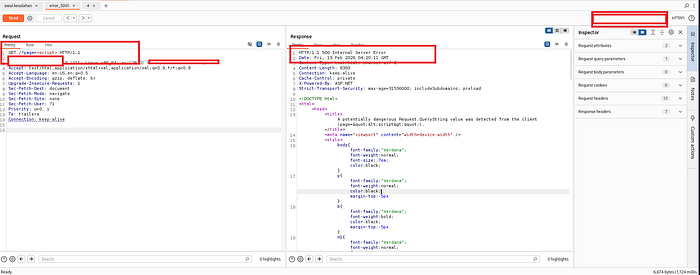
- Verbose ASP.NET Error ==>Information Disclosure
- trace.axd exposure ==> Debug Feature Exposure
- HTTP TRACE Enabled ==> Cross-Site Tracing (XST)
the root of the problem is: The production server is running the developer configuration (development/debug mode).
ROOT CAUSE
It all started from one very trivial thing, the target server was still using the development configuration on the public server.|
<configuration>
    <system.web>
        <customErrors mode="Off"/>
    </system.web>
</configuration>
With code like that, every error will be openly displayed to other users. This is clearly very dangerous.
TESTING PROCEDURES
- run burp suite and capture the request
2. Burpsuite capture analysis, you can try some testing first. It's okay to get 404, 403, 301 or even 200 results. [Let's do mapping first]
3. If you find "__VIEWSTATE __EVENTVALIDATION" in your BurpSuite, you can decode it first in case it contains other useful information. I usually use this one: https://www.httpdebugger.com/tools/viewstatedecoder.aspx
4. try testing by entering the default ASP.NET endpoint (if any are open the vulnerability increases and if any errors are not made correctly there is a possibility that sensitive data will be exposed)
/trace.axd
/elmah.axd
/WebResource.axd
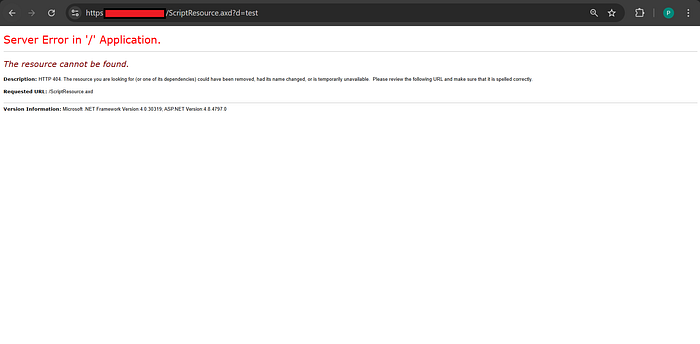
/ScriptResource.axd
/App_Data/
/bin/or more complete below:
/trace.axd
/elmah.axd
/WebResource.axd
/ScriptResource.axd
/glimpse.axd
/Glimpse.axd
/bin/
/App_Data/
/App_Code/
/App_GlobalResources/
/App_LocalResources/
/App_WebReferences/
/App_Browsers/
/App_Start/
/Views/
/web.config
/Web.config
/Global.asax
/packages.config
/appsettings.json
/appsettings.Development.json
/bundleconfig.json
/project.json
/*.asmx
/*.svc
/*.ashx
/*.axd
/swagger/index.html
/swagger/v1/swagger.json
/api/values
/api/help
/Account/Login
/Account/Register
/Account/ForgotPassword
/Identity/Account/Login
/Identity/Account/Manage
/.well-known/microsoft-identity-association.json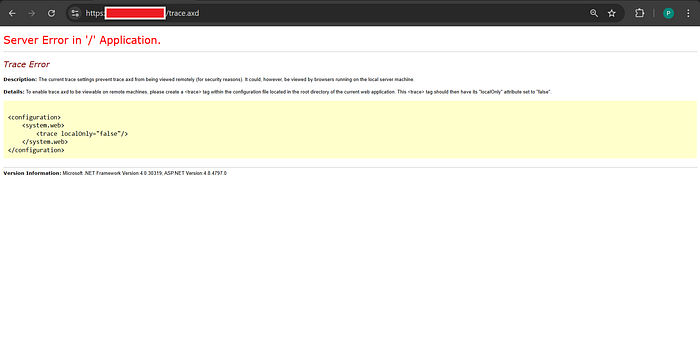
5. My suggestion is don't just look at the page, try to do a deeper analysis with Burp Suite, you will find interesting things in it.
6. After some time of experimenting, I finally came to something interesting in my opinion. That is, I found a response of 500 and also a response of 200.(by manipulating some other things)
7. Don't forget to also test the request, maybe there is something interesting in it.
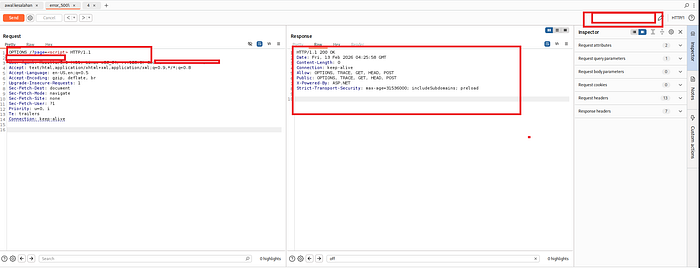
Request TRACE is one of the HTTP methods used for diagnostic and debugging purposes, where the server returns (reflects) the received request message back to the client in the body of a 200 OK response.
CONCLUSION
The discovered vulnerability occurs because the production ASP.NET server is still running in debugging mode, leaking internal system details and enabling malicious HTTP methods. This allows attackers to understand the application's structure and prepare advanced attacks such as session hijacking or ASP.NET-specific exploits.