

Introducing the Security Detection Workbench — A web dashboard that lets you chat with your coverage, detections and 10000+ detections and live threat intelligence from threadlinqs and community detection rules. Create your own/run automated workflows to expedite a broad range of security engineering work with a combination of 100+ MCP tools and much more.
The Problem: Detection Sprawl
If you work in security, you know the pain. Your Sigma rules live in one repo. Splunk ESCU detections live in another. Elastic rules are in a third. KQL queries? Scattered across two more community repos. That's five repositories, four query languages, and zero unified way to search across all of them.
When a new CVE drops or a threat report lands in your inbox, the clock starts ticking. You need to answer one question fast: do we have detection coverage for this? But answering that means opening multiple browser tabs, running different searches in each repo, mentally cross-referencing results, and hoping you didn't miss something. Your own custom detections and Seven thousand community detection rules exist out there. Finding the right one shouldn't take fifteen minutes of tab-switching.
Detection_Workbench is a platform that solves this. One interface. One search. All your detections, live threat intelligence, and coverage analysis in a single pane of glass. Enriched with advanced CTI, Behavioral Indicators, Detections, Threat Simulations and several correlation and attribution datapoints from threadlinqs. Giving analysts superpowers in terms of efficiency, time-saving and decreasing threat coverage turnaround from days to hours.
TLDR; What Is the Threadlinqs Platform?
Before we get to the workbench, it helps to understand what powers the intelligence side. Threadlinqs is a real-time threat intelligence platform purpose-built for detection engineers. It doesn't just aggregate threat reports — it breaks them down into structured, actionable context that is easily digestible for both analysts and machines.
Every threat that enters the platform is decomposed into discrete layers: an overview with attribution and severity, extracted indicators (domains, IPs, file hashes, behavioral patterns), a full campaign timeline tracing the threat actor's activity from first sighting to public disclosure, mapped detections with ready-to-deploy rules across Splunk SPL, KQL, and Sigma, and executable simulations for safe lab-based validation.
Beyond individual threats, the platform provides cross-cutting analytical capabilities: DNS enrichment with infrastructure mapping and cross-threat correlation (revealing shared hosting between seemingly unrelated campaigns), an interactive canvas that visualizes relationships between IOCs, threats, and C2 beacons, a MITRE ATT&CK coverage map that shows technique coverage across your entire detection library, and searchable detection and simulation libraries spanning 300+ of ready-made rules and lab scripts.
This is the context that flows into the workbench. When you ask the detection workbench to check your coverage against recent threats, it isn't pulling a list of CVE numbers from an RSS feed — it's pulling fully structured intelligence with MITRE mappings, behavioral indicators, attribution chains, and pre-built detections. That depth of context is what makes the difference between a generic coverage report and one that actually tells you what to do next.
What Is the Security Detection Workbench?
The Threadlinqs Security Detection Workbench is a full-featured web dashboard that sits on top of two MCP (Model Context Protocol) servers. Instead of building custom integrations for every tool, MCP provides a standardized way to expose capabilities as "tools" that any compatible client can call.
The workbench spawns two MCP servers as persistent background processes:
- security-detections MCP (74 tools) — From Michael Haag. Indexes and searches 7,283+ detection rules across Sigma, Splunk ESCU, Elastic, and KQL formats using a local SQLite FTS5 full-text search engine.
- threadlinqs-intel MCP (32 tools) — Connects to the Threadlinqs threat intelligence platform for real-time threat feeds, C2 infrastructure tracking, IOC enrichment, and MITRE ATT&CK mapping. NPM package
That gives you 106 tools, 10,000+ indexed detections across 4 formats, 22 pre-built workflows, and 2 MCP servers — all accessible from a single browser tab.
Feature Walkthrough
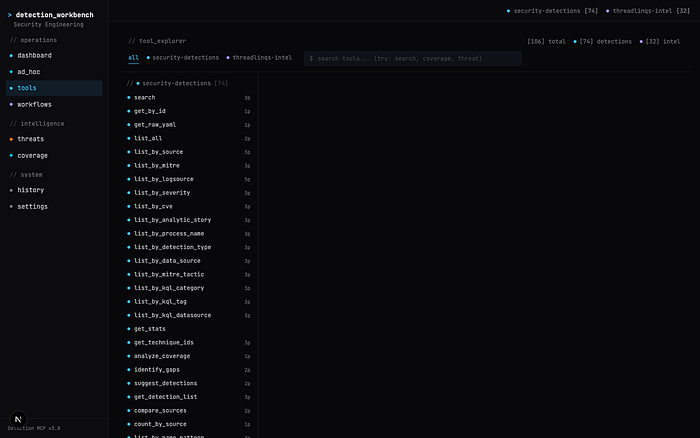
106 Tools at Your Fingertips
The Tools page gives you a searchable, filterable view of every capability across both MCP servers. Each tool shows its server origin, input schema, and a description of what it does. Need to search for ransomware-related detections? Type it in the search bar and instantly see every relevant tool — from search to get_coverage_by_tactic to get_technique_coverage. You can browse by server, inspect parameter schemas, and run tools directly from the UI.
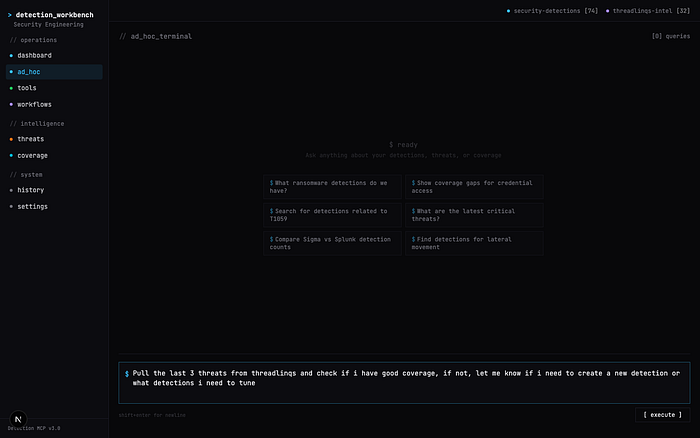
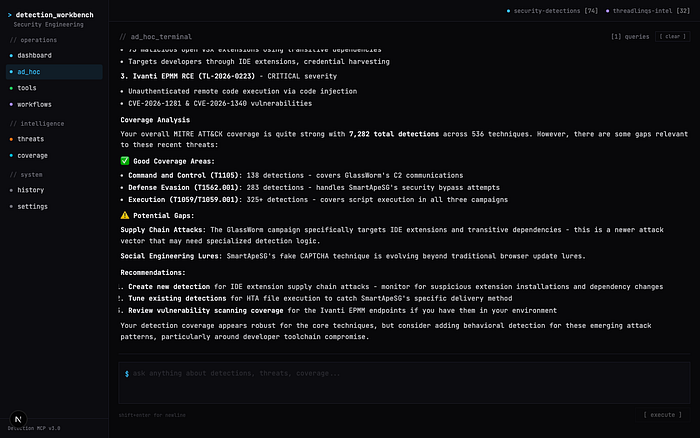
Natural Language Queries
The ad hoc terminal is where the workbench truly shines. Type a question in plain English and the platform uses a three-phase LLM pipeline to answer it:
- Plan — the LLM reads your question and decides which MCP tools to call
- Execute — the platform calls those tools against your local detection index and the Threadlinqs intelligence API
- Synthesize — the LLM combines all the tool results into a coherent, actionable response
Every tool invocation appears as a live badge showing which server and tool ran, whether it succeeded, and how long it took. No black boxes — you see exactly what happened behind the scenes.
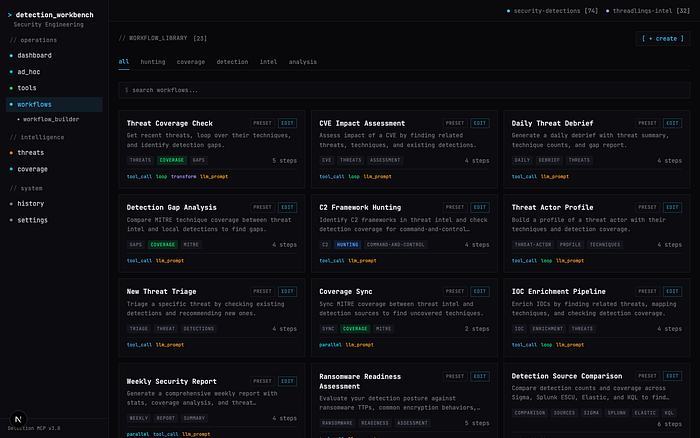
22 Pre-Built Workflows
For recurring operations, the workbench ships with 22 pre-built workflows organized by category. These aren't simple scripts — they're multi-step orchestrations that chain together MCP tool calls, data transformations, LLM analysis, conditionals, loops, and parallel execution.
Some highlights:
- Threat Coverage Check — pull the latest threats, extract MITRE techniques, and check your detection coverage against each one.
- Ransomware Readiness Assessment — audit your detection stack against known ransomware TTPs and latest ransomware activity from threadlinqs.
- Lateral Movement Hunt Plan — generate a hunting plan based on your current lateral movement coverage gaps.
- Credential Theft Detection Audit — map your credential access detections against the full T1003 sub-technique tree.
- Daily Threat Debrief — generate a morning brief of new threats with coverage impact analysis.
Each workflow supports six step types: tool_call, transform, llm_prompt, conditional, loop, and parallel. You can execute any preset with custom parameters, view step-by-step progress, and drill into individual results.
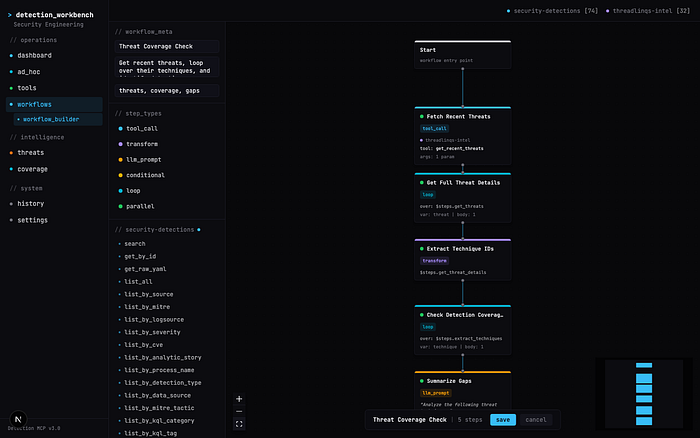
Visual Workflow Builder
Don't see a workflow that fits your use case? Build your own. The visual workflow builder provides a drag-and-drop React Flow canvas where you can wire together tools from both MCP servers into custom pipelines. Each node represents a step — connect them to define execution order, add LLM analysis steps for automated reasoning, and include conditional branches for different outcomes.
The tool palette on the left gives you access to all 106 tools across both servers. Drag a tool onto the canvas, configure its parameters in the inspector panel, and connect it to the next step. You can build sophisticated multi-step workflows that combine detection searches, threat intelligence lookups, coverage analysis, and LLM-powered summarization — all without writing code.
Live Threat Intelligence + MITRE Coverage
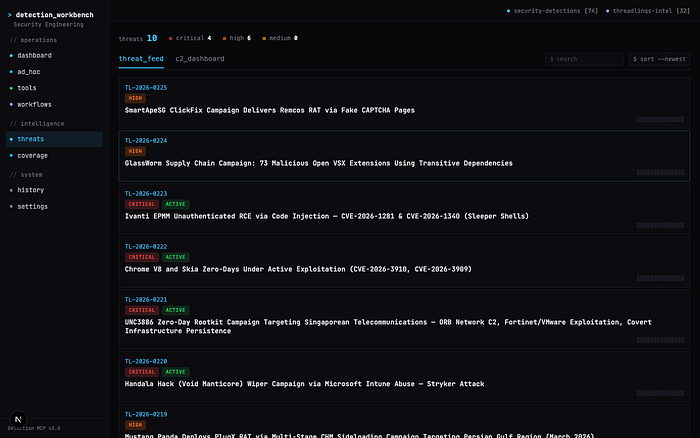
The Threats page surfaces real-time intelligence from the Threadlinqs platform — active threats categorized by severity (critical, high, medium), attributed to threat actors and nation-states, and tagged with MITRE ATT&CK techniques. Each threat links directly to coverage analysis so you can instantly see whether your detection stack is prepared.
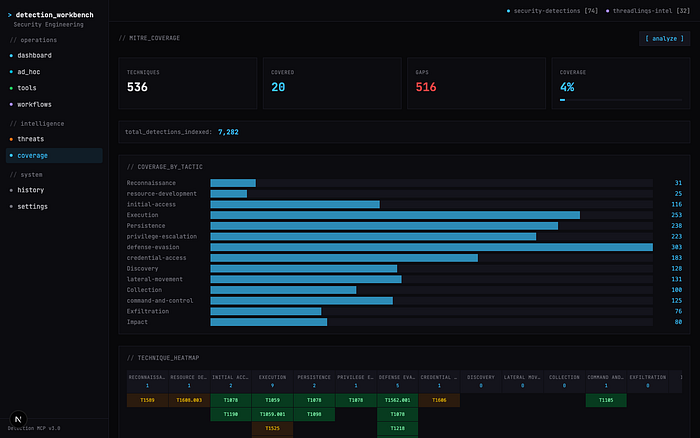
The Coverage page takes this further with a MITRE ATT&CK heatmap. Click "Analyze" and the workbench maps your entire detection library against the ATT&CK framework, highlighting which techniques you cover and which ones are gaps. This isn't theoretical — it's built from your actual indexed rules, giving you an honest picture of your detection posture.
Security Architecture: Built by Security Professionals, for Security Professionals
The Detection_Workbench was built with one non-negotiable principle: your detection content never leaves your machine.
Here's how the security model works:
- All detections are local. The security-detections MCP server indexes rules from repos cloned to your local disk. The SQLite database lives at
~/.cache/security-detections-mcp/detections.sqlite. No detection content is uploaded anywhere. - Threadlinqs traffic is one-directional. The threadlinqs-intel MCP server pulls threat intelligence data from the Threadlinqs API. It is a read-only, pull-only connection — no data from your environment is ever sent to Threadlinqs or any external service.
- The only outbound network calls are LLM traffic. When you use the ad hoc terminal or LLM-powered workflow steps, those prompts go to your configured LLM provider. Everything else stays local.
- No telemetry, no analytics, no phoning home. The workbench runs on localhost. It spawns MCP servers as local child processes over stdio transport. Your detection rules, coverage data, and query history never leave your machine.
This architecture wasn't accidental. It was a deliberate design choice. Your rule logic reveals what you can and cannot detect — that's not something that should ever transit a third-party server.
Getting Started
Step 1: Clone and Build
git clone https://github.com/threadlinqs-cmd/Threadlinqs-Security-Detection-MCP.git
cd Threadlinqs-Security-Detection-MCP
npm install && npm run build
Requirements: Node.js 20+, npm 9+, and build tools for native modules (xcode-select --install on macOS, build-essential on Linux).
Step 2: Add Your Detection Content
The MCP server indexes detection rules from community repositories that you clone locally. Download as many or as few as you want:
mkdir -p detections && cd detections
# Sigma rules (~3,000+ rules) - SIEM-agnostic, recommended starting point
git clone --depth 1 https://github.com/SigmaHQ/sigma.git
# Splunk ESCU (~2,000+ detections, ~330 analytic stories)
git clone --depth 1 https://github.com/splunk/security_content.git
# Elastic detection rules (~1,500+ rules)
git clone --depth 1 https://github.com/elastic/detection-rules.git
# KQL hunting queries (~400+ queries)
git clone --depth 1 https://github.com/Bert-JanP/Hunting-Queries-Detection-Rules.git kql-bertjanp
git clone --depth 1 https://github.com/jkerai1/KQL-Queries.git kql-jkerai1
cd ..
Then point the workbench at these directories by setting environment variables in your configuration. The paths go into the MCP server config under keys like SIGMA_PATHS, SPLUNK_PATHS, ELASTIC_PATHS, and KQL_PATHS. You can also add your own internal detection repos — any directory containing .yml, .yaml, or .toml detection files will be indexed automatically.
The server rebuilds its SQLite index on startup, so adding or updating detection repos is as simple as pulling the latest changes and restarting.
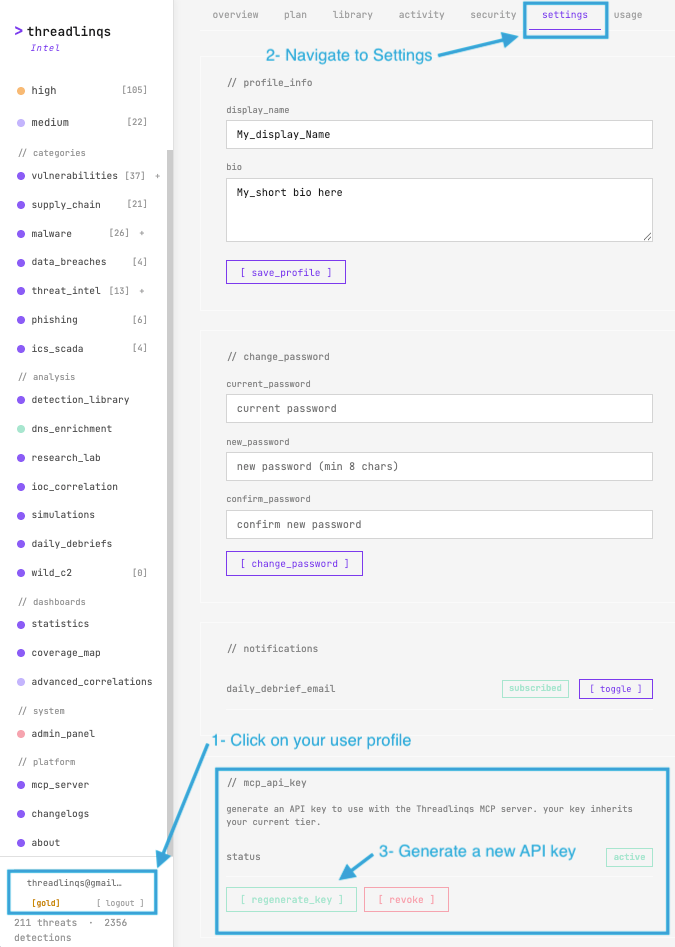
Step 3: Get Your Threadlinqs API Key
To connect the threat intelligence server, you need a Threadlinqs API key:
- Sign up at threadlinqs.com — a 7-day free trial is available to get started immediately
- Go to your profile at intel.threadlinqs.com/profile
- Click the settings tab
- Scroll to the mcp_api_key section and click [ regenerate_key ] to generate your key
- Copy the key and set it as the
THREADLINQS_API_KEYenvironment variable in your configuration
Step 4: Launch the Workbench
cd workbench
npm install
PORT=6543 npm run dev
Open http://localhost:6543 in your browser and set up your API keys in the settings tab. The workbench will spawn both MCP servers, index your detection content, and you're ready to go. Check the Settings page to verify both servers show "connected" with green status dots.
Real-World Use Cases
SOC Analyst: New CVE Response
A critical CVE drops. You open the ad hoc terminal, type: "Do we have detections for CVE-2024-XXXXX?" The platform searches across all four detection formats, checks the Threadlinqs threat feed for related threat activity, and returns a consolidated answer with links to every matching rule — in seconds.
Detection Engineer: Gap-to-Rule Pipeline
You run the Detection Gap Analysis workflow. It maps your current rules against ATT&CK, identifies uncovered techniques, prioritizes them by threat prevalence from Threadlinqs intelligence, and gives you a ranked list of what to build next. No spreadsheets, no manual cross-referencing.
Security Manager: Weekly Reporting
Every Monday morning before standup, you run the Weekly Security Report workflow. It generates a summary of new threats from the past week, maps them against your detection coverage, highlights any new gaps, and produces a formatted brief you can share with your team. What used to take an hour of manual work now runs in under a minute.
Under the Hood
For those curious about the technical architecture:
- MCP Protocol — JSON-RPC 2.0 over stdio transport. Each tool has a typed schema (inputs and outputs). The workbench communicates with both servers via
StdioClientTransport, spawning them as persistent child processes. - Detection Index — SQLite with FTS5 full-text search. Rules are parsed from their native formats (YAML for Sigma/Splunk/Elastic, TOML for some Elastic rules, markdown for KQL) and indexed with searchable metadata: title, description, MITRE mappings, severity, data sources.
- Workflow Engine — supports six step types with variable interpolation between steps. Parallel steps run concurrently and merge results back into the main execution context. LLM steps use configurable model providers.
- Frontend — Next.js 15 with App Router, Tailwind CSS, React Flow for the visual builder. The terminal aesthetic was designed to match the Threadlinqs Intel platform at intel.threadlinqs.com.
The entire workbench is open source under the Apache-2.0 license. Inspect every line of code, verify the security model, and extend it to fit your needs.
Credits
This platform was built by combining two open-source projects:
- Michael Haag — creator of the Security Detections MCP server that powers the local detection indexing engine. The original project indexes 7,283+ community detection rules across Sigma, Splunk, Elastic, and KQL into a fast, searchable SQLite interface accessible via MCP. GitHub: github.com/MHaggis/Security-Detections-MCP
- Hatim Bakkali — Maintainer of the Threadlinqs threat intelligence platform and the unified workbench that brings detection search, threat intel, workflow automation, and visual analysis together in a single web dashboard. GitHub: github.com/threadlinqs-cmd/Threadlinqs-Security-Detection-MCP
Together, these projects demonstrate what becomes possible when you connect structured security data through open protocols. 103 tools. 7000+ detections. 1 interface. 0 tab-switching.