In Part 2, we built the brain (Wazuh). Now, we need a heart: a telemetry-rich endpoint that feeds the SIEM with high-fidelity data. In this phase, we will transform a standard Windows 11 VM into a monitoring target.
Creating a Windows Virtual Machine
My entire setup is created in VMware Workstation however, if you prefer to use any other hypervisor such as VirtualBox then feel free to move ahead with it. By this point, I'm assuming that you already know how to set up a virtual machine and thus that will be skipped here. I've chosen to go ahead with Windows 11 but other versions of windows will work as well.
Sysmon: Visibility Beyond the Surface
Standard Windows Event Logs are often insufficient for modern threat hunting. They might tell you that a process started, but they won't tell you the command line arguments, the file hash, or the parent process. This is where sysmon comes in.
What is Sysmon? > System Monitor (Sysmon) is a Windows system service and device driver that remains resident across reboots to monitor and log system activity. It captures deep forensic data — like network connections and process creation with full hashes — and writes them to the Windows Event Log for ingestion.
Installing Sysmon
We don't want to log everything (noise). We want to log malicious patterns. For this we'll use sysmon with the industry-standard Olaf Hartong configuration to filter our telemetry.
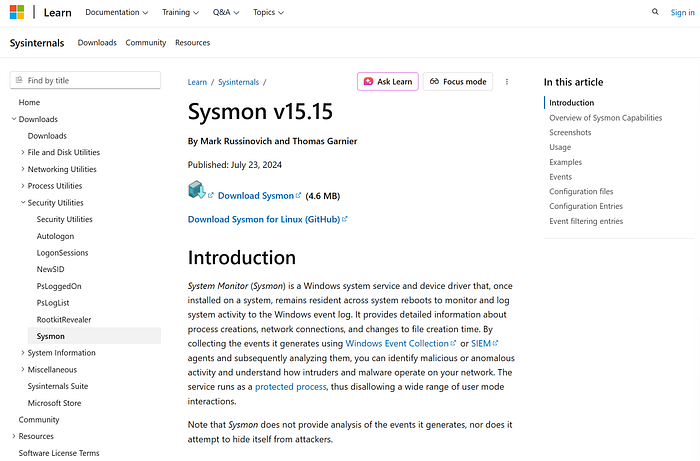
Download the sysmon package from the sysinternals page provided here. At the time of creating this article, the latest version was v15.15. If you come across a different version then that would work fine as well.
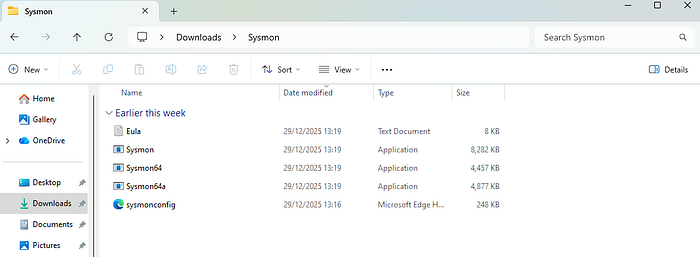
This will be downloaded as a zip file so feel free to extract it in your system. Before installing it we also need a config file which will provide instructions on the type of data that we would like to monitor here. Download the following file from the creator olafhartong here.
Save this xml file in the same directory where sysmon was extracted previously.
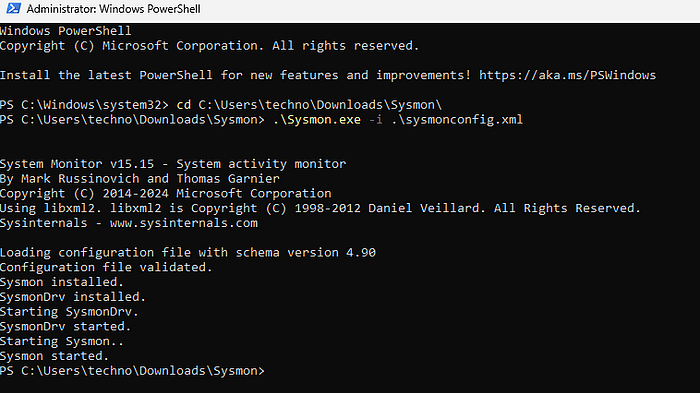
The following steps can now be followed for installing sysmon:
- Start a powershell session in administrator mode.
- Change directory to the folder where sysmon was extracted.
- Install sysmon while using the config file.
.\\Sysmon64.exe -i .\\sysmonconfig.xml
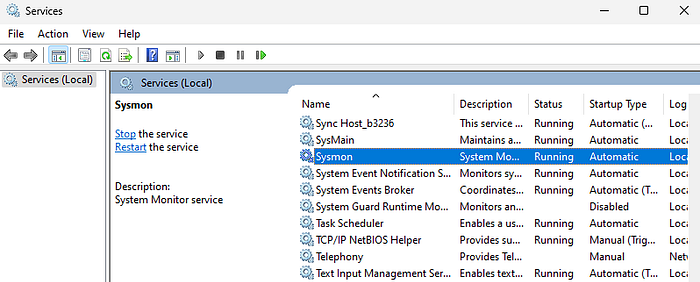
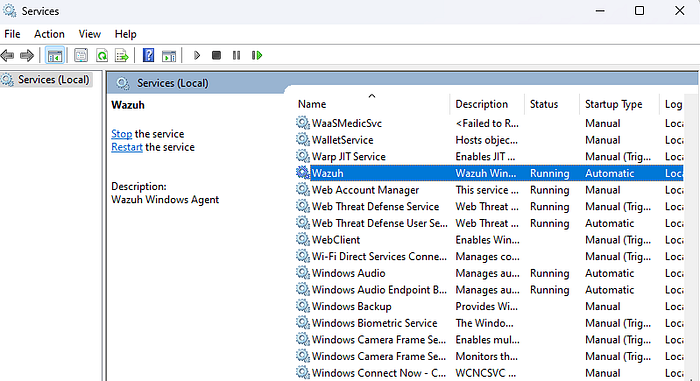
4. Check if sysmon is running: This can be done via the service named Sysmon running on the system
Deploying the Wazuh Agent
With telemetry being generated locally, we need a courier to ship it to our SIEM. Wazuh will be responsible for capturing the sysmon logs and sending them to the Wazuh Manager.
- Switch to the windows user system and log into Wazuh Dashboard.
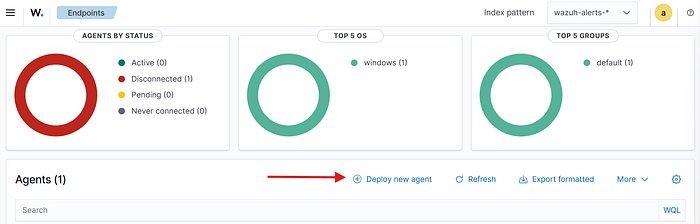
- Move to the agent management windows Hamburger icon → Agents management → Summary
- Browse to the deploy agent page
4. Configure the Wazuh Agent: For my use case, I'll choose the operating system to be windows and specify the server address of the Wazuh machine.
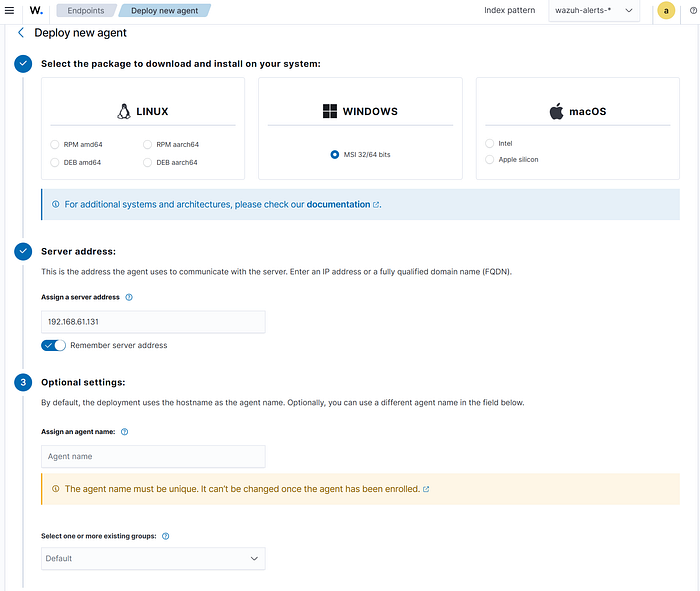
5. Download the Wazuh Agent: You can choose to assign a name to this agent or keep it blank. After this you'll be provided with the PowerShell command to download and install the agent. Do note that this requires PowerShell to be run with admin privileges.
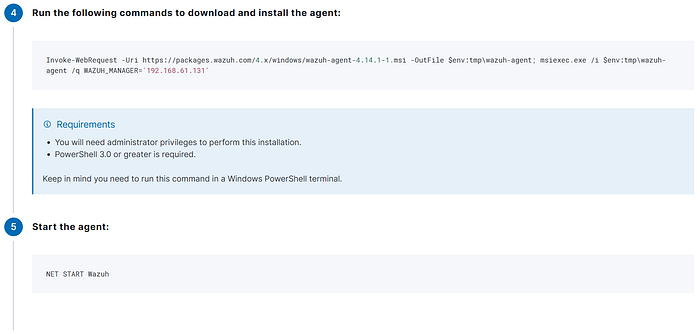
6. Start the service: With the agent installed, the last step is to start it's service after which it'll be visible in Wazuh Dashboard.
Configuring the Data Pipeline
Right now, the Wazuh agent is only shipping standard logs. We must explicitly tell it to watch the Sysmon channel.
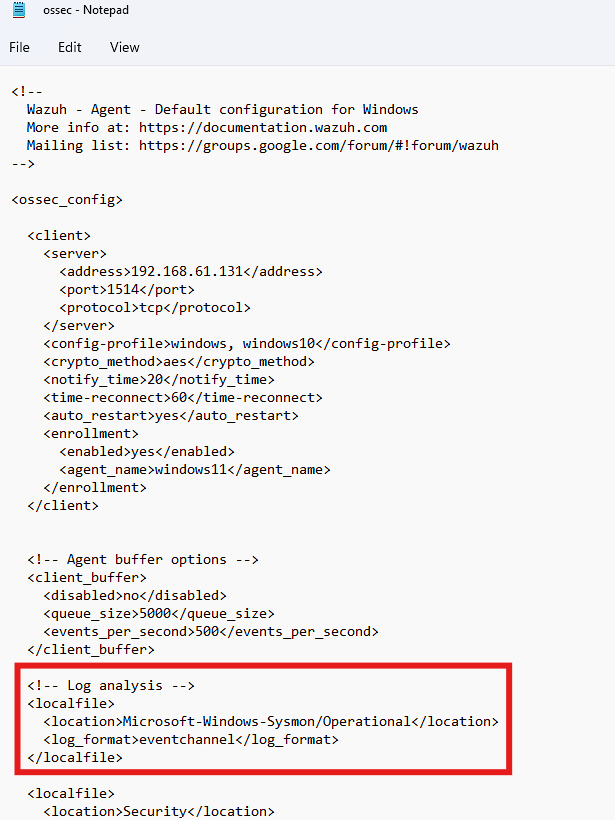
- Open the config file of Wazuh agent Run notepad with admin privileges → Open the config file at C:\Program Files (x86)\ossec-agent\ossec.conf
- Remove the 2nd and 3rd <localfile> tags under Log analysis section.
- Replace <location>Application</location> to <location>Microsoft-Windows-Sysmon/Operational</location in the first <localfile> tag under Log analysis section.
- This is actually the name of the header which stores sysmon logs. This can be seen at Event Viewer → Application and Services Logs → Microsoft → Windows → Sysmon → Operational → Right click → Properties → Full Name
4. Restart Wazuh service Services → Wazuh → Right click → Restart
Preparing for the Attack: Blindfolding Defender
In a real-world scenario, Windows Defender would kill Mimikatz instantly. Since this is a lab focused on Detection Engineering rather than exploit obfuscation, we need to create a "safe zone."
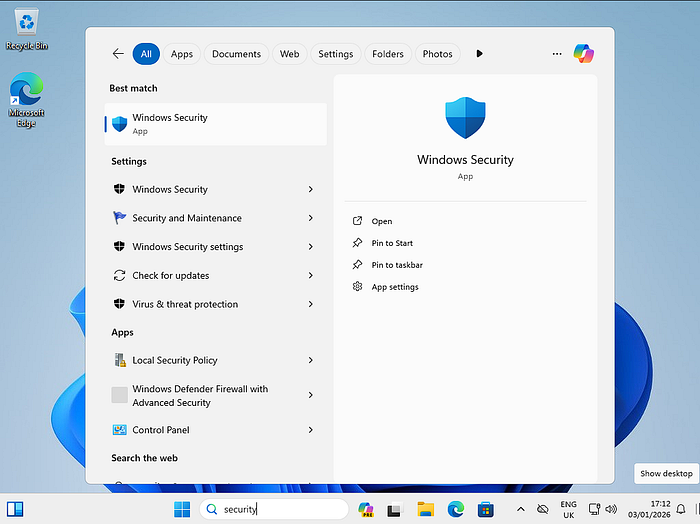
- Search for Windows Security.
2. Move into the settings of Virus and threat protection Hamburger Icon → Virus and threat protection → Manage settings

3. Disable every protection.
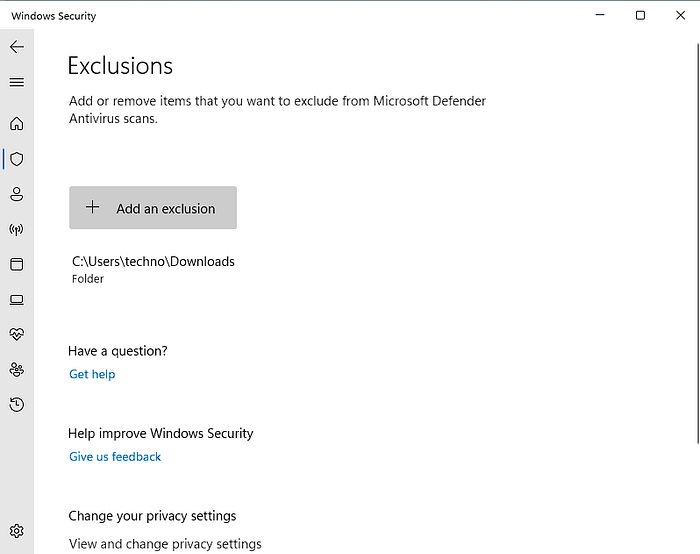
4. Create an exclusion for the Downloads folder Exclusions → Add or remove exclusions → Add an exclusion → Folder → C:\Users\<username>\Downloads
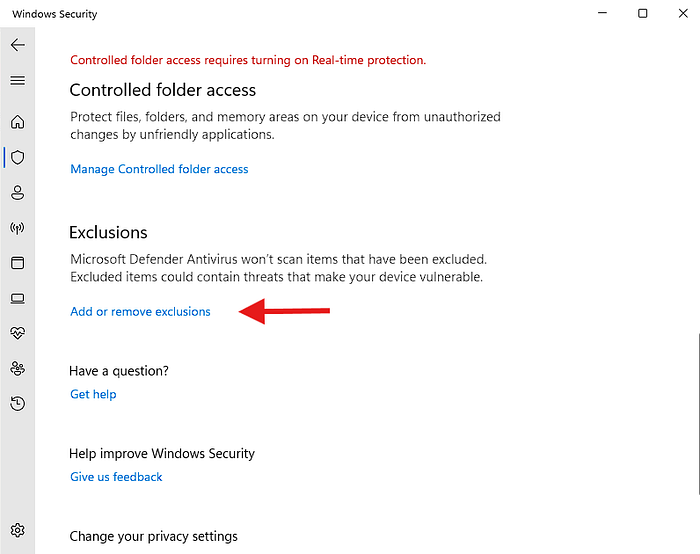
5. The exclusion would look as shown below.
Download Mimikatz
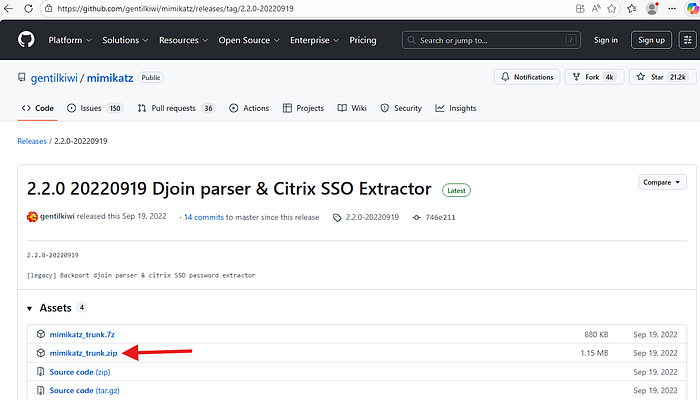
- Browse to the GitHub repository of gentilkiwi https://github.com/gentilkiwi/mimikatz
- Go to the latest version of mimikatz Releases → Latest

3. Download its trunk.zip version: If this gets blocked by Microsoft Defender SmartScreen then allow it.
Execution & Validation
Now comes the moment of truth. We will execute Mimikatz and check if our "Brain" in Part 2 catches it.
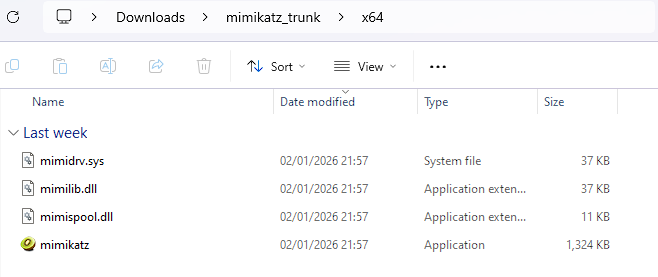
- Extract this mimikatz zip file and move into x64 folder
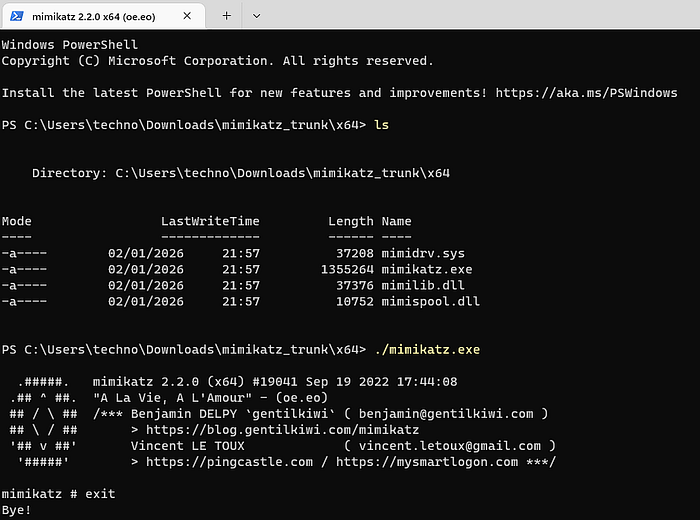
2. Open a terminal/PowerShell window here.
3. Execute mimikatz
4. Now if everything was done correctly, it would create a detection in Wazuh. This would be under Explore → Discover while switching the index to wazuh-archives*

Coming Up Next: With the detection created, now comes it's handling. For this we'll be deploying our case management system with TheHive and giving it the superpowers of automated analysis and threat intelligence.