

Once fail2ban and Suricata were working together — spotting trouble and slapping temporary bans on bad actors — I realized I was missing one big ingredient: context.
It's one thing to know an IP just got banned for hammering your box. It's another to know whether that IP has a history, a reputation, a rap sheet out there on the wider internet. That's what VirusTotal brings to the table — crowdsourced threat intelligence in a neat little API.
So I started by doing the simple, human thing:
- Signed up for a free VirusTotal account.
- Grabbed my API key from my profile and tucked it away safe.
- Wrote a small shell script —
vt_check_ip.sh—that lets the Pi ask, in plain terms: "Who is this IP really?"
Feed it an address and it'll:
- Call the VirusTotal API.
- Pull back how many engines think it's malicious.
- How many think it's suspicious.
- Where it's from.
- Who owns the ASN.
And then it logs all that to vt_checks.log, a little ledger of everyone who had the nerve to get banned and how the rest of the world feels about them.
To make it less abstract, here's what a real check looks like when that AWS scanner IP runs through the script:
[2026-01-24 22:15:33] IP: 3.169.231.53
Country: United States
ASN: AS16509 (Amazon.com, Inc.)
Malicious: 12/90 engines
Suspicious: 5/90 engines
Threat Level: MEDIUM
That right there is the difference between "some random IP hit my box" and "a cloud-hosted scanner with a history of bad behavior just probed my SSH port, got banned, and had its record checked for the next defender."
Rate Limits: Why Polite Waiting Keeps You in the Game
Because VirusTotal's public API has limits — about 4 requests a minute and 500 a day for the free tier — you better believe I added some polite waiting between calls.
That matters more than it sounds. If I ever get hit by a handful of scanners at once — say five or six noisy IPs all getting banned in a short burst — the Pi can't just spam VirusTotal like a panicked rookie. It needs to queue those checks and space them out, or I'd blow through my daily quota before lunch and spend the rest of the day flying blind.
So the little lock file and that 15-second delay aren't just politeness; they're how this tiny SOC keeps its eyes open all day instead of falling asleep after the first storm.
When a Ban Becomes a Reputation Check
It wasn't enough for me to run that script by hand, though. If I'm going to pretend this Pi is a mini security operations center, it needs to react on its own.
So I wrote a custom fail2ban action, virustotal-check.conf, that does something simple and powerful:
Every time fail2ban bans an IP in the suricata jail, it calls:
/home/cyberblade/vt_check_ip.sh <ip>That means banning someone doesn't just close the door — it also checks their record and writes what it finds. Over time, vt_checks.log turns into a kind of threat scrapbook: timestamps, countries, AS owners, malicious counts, suspicion counts—all attached to the IPs that tried their luck.
At this point, the whole thing runs like a little assembly line:
Suricata detects suspicious activity
    ↓
fail2ban analyzes the alert pattern and decides to ban
    ↓
custom virustotal-check action fires on ban
    ↓
vt_check_ip.sh queries VirusTotal API
    ↓
results are logged to vt_checks.log and cached on disk
    ↓
vt_web_dashboard.sh (via cron) reads the cache every minute
    ↓
generates /var/www/html/vt_dashboard.html
    ↓
browser displays the current threat landscape
From packet on the wire to a colored badge on the dashboard, it's all stitched together with small, simple pieces that each do one thing well.
Writing Back to the Neighborhood: Submitting Context
Checking an IP is one thing. Contributing back is another.
So I wrote a second script — vt_submit_and_check.sh—that not only checks an IP, but, when it doesn't have much of a history, adds a comment to VirusTotal:
"Suricata on a home network saw this IP performing SSH port scans on this date."
Here's why that matters: VirusTotal's value comes from millions of little observations donated by defenders all over the world. When I add context like "Suricata detected port scanning from this IP targeting SSH on a Raspberry Pi sensor", I'm not just journaling my bad day — I'm handing the next defender a clue. Maybe they'll see that same IP next week on a totally different network, check VirusTotal, and now they've got more than just a raw score — they've got behavior.
That's how collective defense slowly takes shape: not from one giant magical feed, but from thousands of small, honest reports about what we've each seen on our little corners of the internet.
With reputation checks running automatically and context flowing back to VirusTotal, the machinery was humming. But I wanted more than logs scrolling in the background — I wanted visibility.
Building the Command Line Dashboard
I started with a CLI dashboard — vt_dashboard.sh—that gives me a live view right in the terminal:
- It pulls the list of currently banned IPs from fail2ban.
- For each one, it either pulls cached VT data or makes a new request (respecting rate limits).
- It prints a clean table: IP, country, AS owner, malicious count, suspicious count, and a threat level badge.
- It shows total bans, active bans, and today's VT API usage.
Run it once for a snapshot. Run vt_dashboard.sh -c and it refreshes every 30 seconds like a little command-line SOC wallboard.
Giving the Pi a Face: The Web Dashboard
CLI is good for me. But I wanted something I could pull up on a browser anywhere in the house — a web-based dashboard that looked like a tiny SOC screen.
So I brought in nginx, set /var/www/html as my web root, and wrote vt_web_dashboard.sh.
Open a browser and hit:
http://10.0.0.100/vt_dashboard.html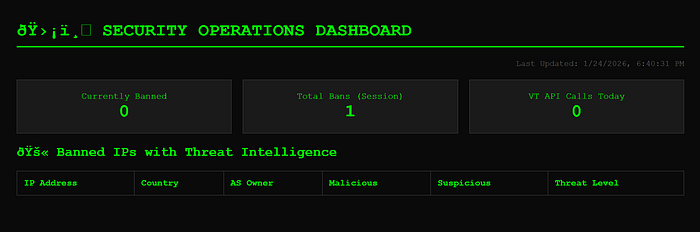
And there it is: a little Security Operations Dashboard built on a Pi. At the very top, three stat boxes stare back at you — something like:
- Total Bans (session): 247
- Currently Banned: 3
- VT API Calls Today: 42
Under that sits a table of banned IPs. Each row shows:
- The IP address
- Country (pulled from VT)
- AS owner (trimmed so it fits cleanly)
- Malicious and suspicious counts
- And a threat badge on the end — 🔴 HIGH for noisy, well-known badness, 🟡 MEDIUM for "keep an eye on this," and 🟢 LOW for guests that might just be curious rather than outright hostile.
It looks like an old-school terminal wallboard: dark background, green text, clean lines. But behind that retro look is a live view of who's been knocking, who got the door slammed on them, and how dangerous the rest of the world thinks they are.
Then I hooked it up to cron to run every minute, so the dashboard is always fresh:
* * * * * /home/cyberblade/vt_web_dashboard.shWhat Day 4 Really Means
On paper, Day 4 was "add threat intelligence and a web dashboard." In reality, it was about teaching this project how to:
- See: Suricata watching the wire.
- Decide: fail2ban turning patterns into bans.
- Ask: VirusTotal answering, "Who is this, really?"
- Contribute: Adding context back to the threat intel ecosystem.
- Show: Dashboards — CLI and web — turning all that into something human-readable.
Somewhere in all that testing — banning myself on purpose to validate the VT integration — I managed to lock myself out again. That Pi stayed on brand: do exactly what I told it to, not what I meant. But every lockout is proof the system works — and a reminder to always test automation with short ban times and backup access.
Now, when some scanner out there decides my little Pi looks like an easy mark, it doesn't just take the hit. It detects, reacts, checks the threat's reputation, contributes context to the community, logs the story, and displays it on a dashboard I can pull up from the couch.
Next up, I'll be walking through what VirusTotal is actually telling me about these banned IPs:
- Are cloud providers like AWS and Azure over-represented in my threat data?
- What's the difference between IPs with zero malicious flags that still deserve attention versus ones that light up the board?
- Do patterns emerge when you watch this for a week — same ASNs, geographic clusters, timing patterns?
- How to use enrichment data to tune Suricata rules smarter, not just blocking everything but understanding what you're seeing?
The Pi isn't just reacting anymore. It's starting to think. And that's when things get really interesting.