In many enterprise networks, deploying agents on every network device is either impossible or impractical. Agentless monitoring allows us to collect logs remotely without installing anything on the firewall, making it an efficient solution for devices like routers, firewalls, and switches.
This is exciting because it allows you to:
- Gain visibility into network traffic and firewall events.
- Learn to create rules, alerts, and dashboards in Wazuh without touching production systems.
- Understand Syslog forwarding and log normalization — core skills in security monitoring.
As a SOC intern, one of the most valuable skills you can develop is the ability to integrate security tools for centralized monitoring. In this Home lab project, I deployed pfSense in a virtual environment and integrated it with Wazuh using Syslog. This setup allowed me to monitor firewall activity, detect suspicious traffic, and validate custom rules — all without installing agents on pfSense.
Setting Up pfSense in a Virtual Machine
- Mounted the pfSense ISO and installed with default settings.
- Configured LAN interface with a static IP: 192.168.1.128/24.
- Verified DHCP range for VMnet1 to ensure proper IP assignment for lab machines.
PfSense Installation and Configuration in a Virtual Machine (VM):
This section explains how pfSense was deployed in a virtual environment and integrated with Wazuh for security monitoring and log analysis.
Created a new VM in VMware with: Open VMware → Create New VM
Recommended settings:
· Name → Pfsense
· RAM → 2 GB minimum
· Disk → 20 GB (dynamic is fine)
Before we can install pfSense, we need to mount the ISO file to the virtual machine

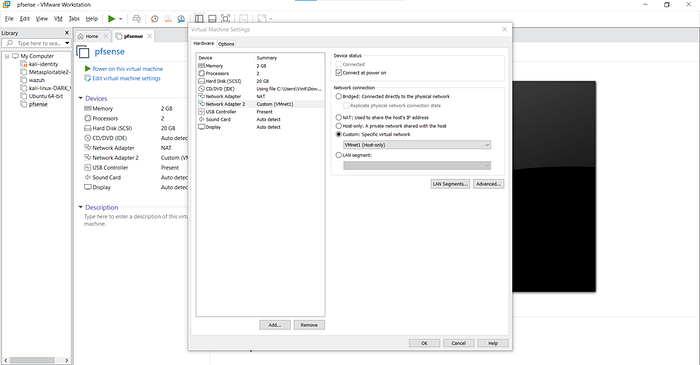
Network Adapters: pfSense requires two network adapters for proper lab setup. The first adapter should be set to NAT to allow internet access from your virtual environment.
- Adapter 1 → NAT (Internet access)

- Adapter 2 → Host-Only (VMnet1)
For the second adapter, we'll use: VMnet1 (Host-Only)
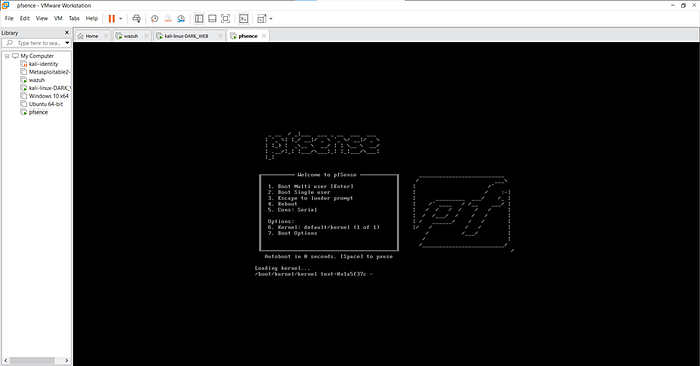
Go ahead and: Select the pfSense VM and Click Start / Power On
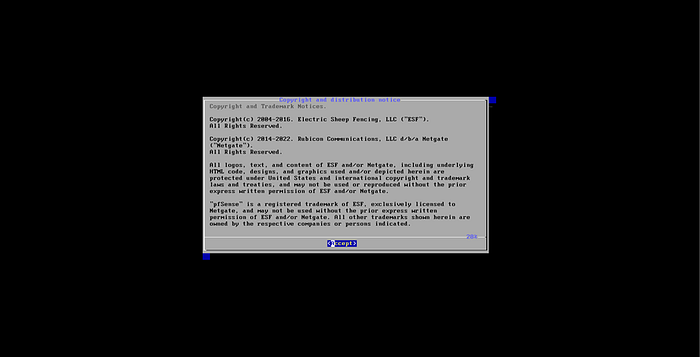
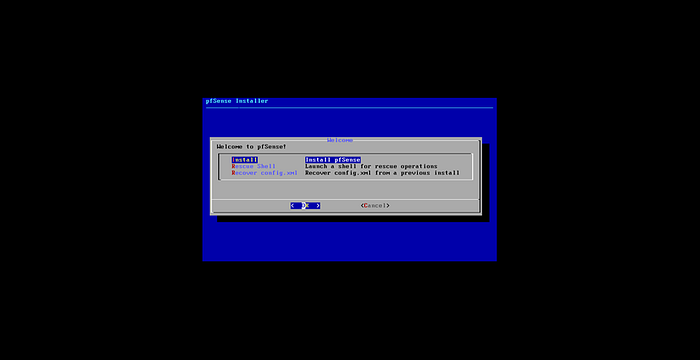
Once the pfSense installer loads, you'll see the license agreement screen. Nothing special here. Click Accept
Select "Install pfSense" After accepting the license, you'll land on the installer menu. Now simply choose: Install pfSense
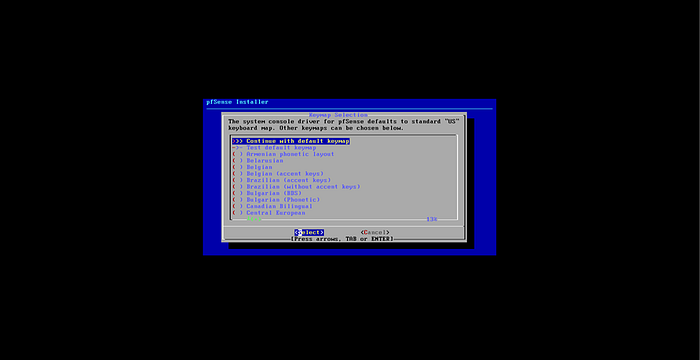
Next, pfSense will ask you to select a keymap (keyboard layout). Unless you're using something custom, there's no need to change anything. Continue with default keymap
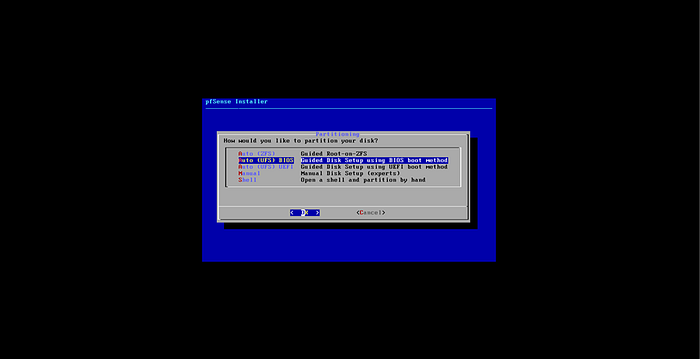
Next, pfSense will ask how you want to partition the disk. Since this is just a lab VM, we don't need anything fancy. Select Auto (UFS) BIOS
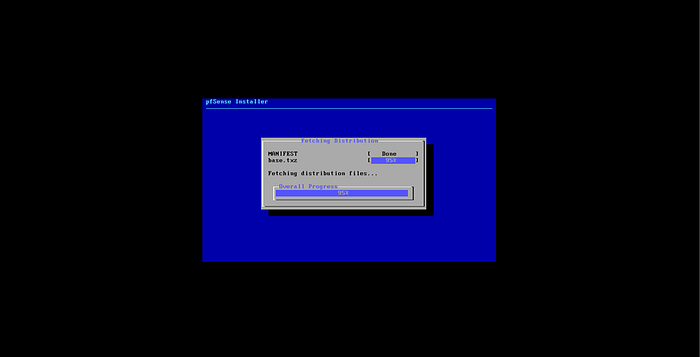
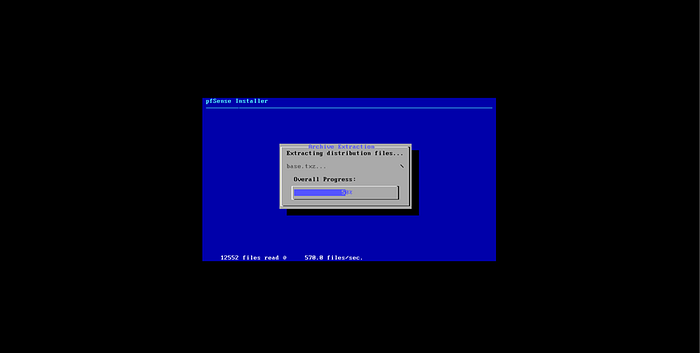
This process may take a few minutes to complete, as pfSense applies all settings and loads services — grab a cup of tea and let it run.
Select No
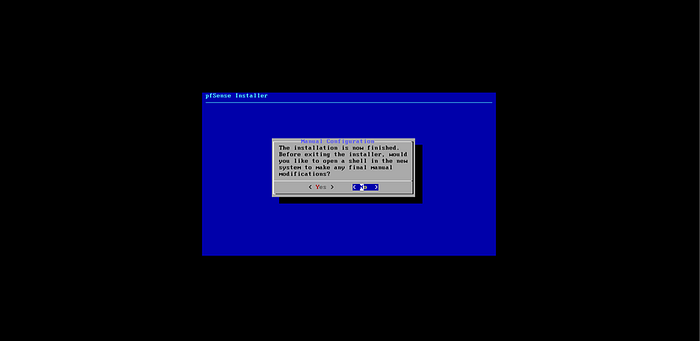
Once the installation completes, you'll see the final screen with a few options. Choose Reboot
This will restart the VM and boot pfSense from the newly installed disk instead of the ISO.

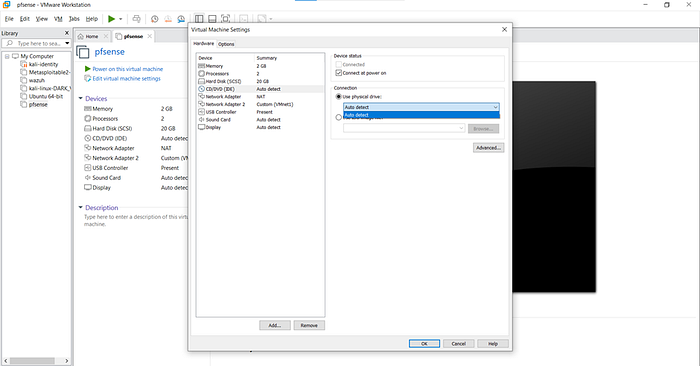
Shutdown the system and change to auto detect Once the system is off:
- Open VM Settings
- Go to CD/DVD
- Set the Auto-Detect
Start pfSense Again Now simply power the VM back on.it will take some time
Check DHCP IP Range for pfSense LAN (Host-Only)
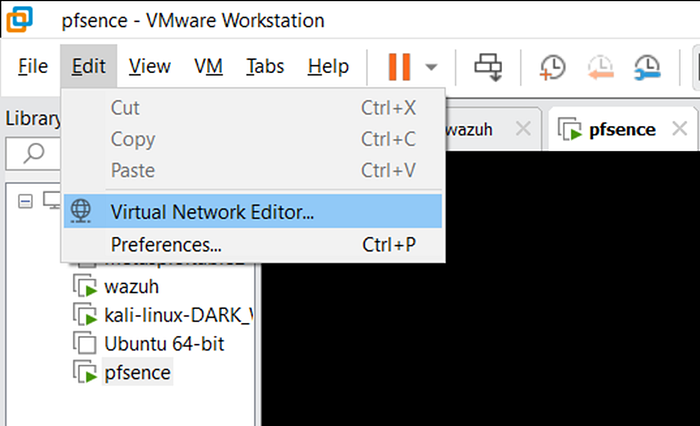
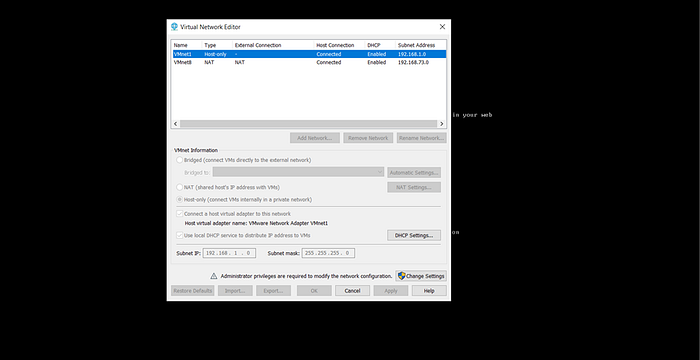
1. Open VMware Workstation → Edit → Virtual Network Editor 2. Click Change Settings (Admin) 3. Select VMnet1 (Host-Only) 4. Click DHCP Settings and note the Start/End IP range
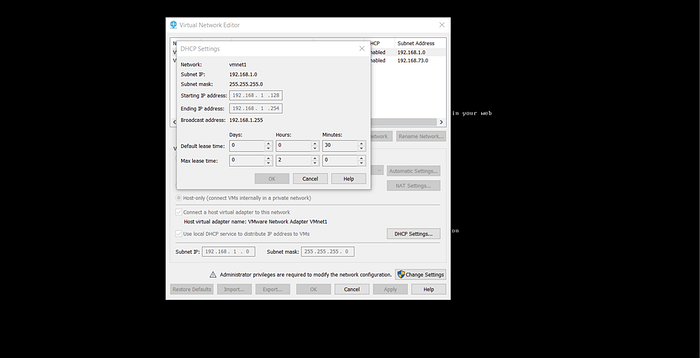
Select VMnet1 (Host-Only) and Click DHCP Settings.
By default, the DHCP IP range is already configured, and for most lab setups, it's perfectly fine to leave it as-is.
We'll use this same range to assign monitoring/client IPs through pfSense LAN.
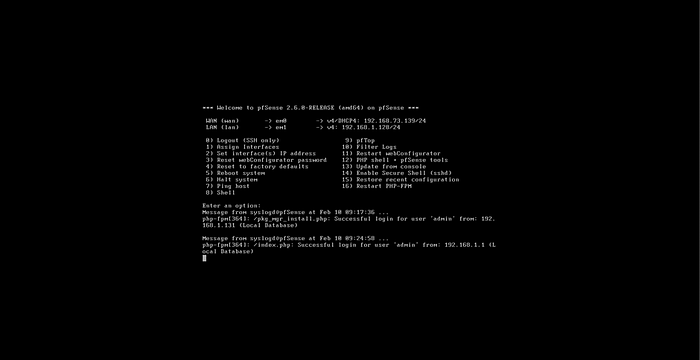
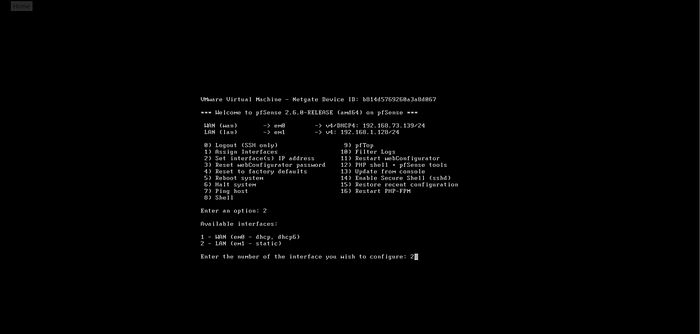
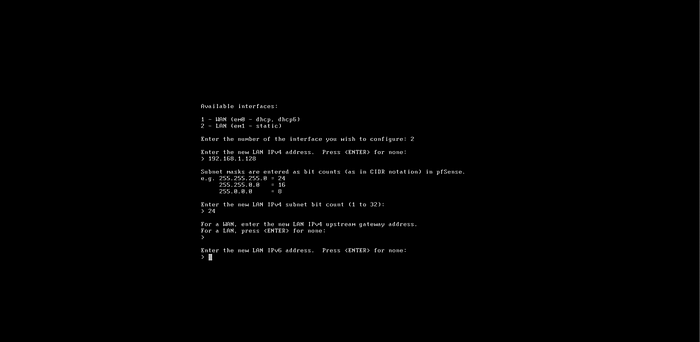
1. Choose Interface Settings - From the pfSense console menu - Select Option 2 — Set interface IP address
2. Select LAN - When prompted, choose 2 — LAN
3. Configure Static IP
Set a static IP outside the DHCP range:
- Select Set Static IP
- Enter your chosen IP → 192.168.1.128
- Subnet → 24
- Press Enter for gateway (leave blank)
- For IPv6, press Enter to set None
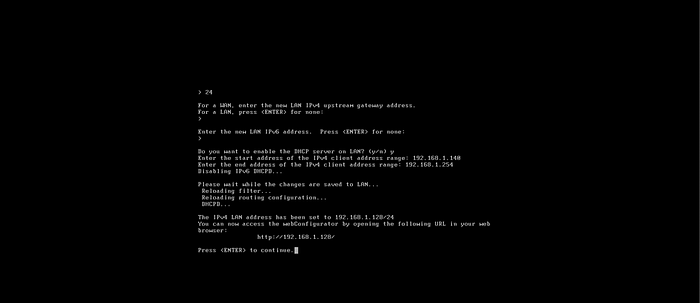
Set Starting Address → first IP of your range, Ending Address → last IP of your range This controls which IPs are automatically assigned to your lab/monitoring machines.
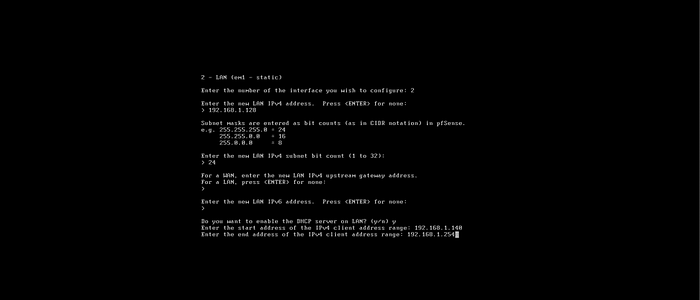
After setting the DHCP range or interface values, simply: Press Enter
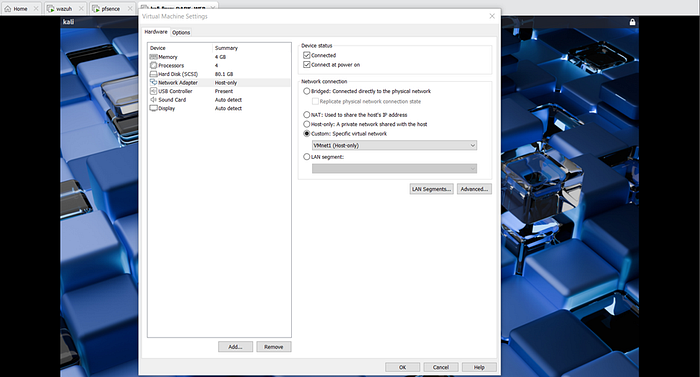
Configure Kali Network Adapter (Host-Only)
Now let's connect Kali Linux to the same network as pfSense LAN.
1. Power off Kali VM 2. Open VM Settings 3. Go to Network Adapter 4. Select: Host-Only (VMnet1)
Once Kali boots up, let's confirm it received an IP from pfSense.
Open the terminal and run:
ifconfig

(or)

ip a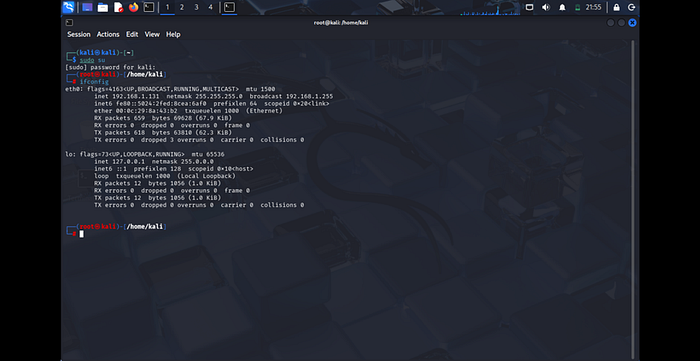
Add the Gateway IP
Next, set the default gateway so Kali routes all traffic through pfSense.
Use the LAN IP you configured on pfSense: 192.168.1.128
ip route
ip route add default via <pfsense_ip> dev eth0
ip route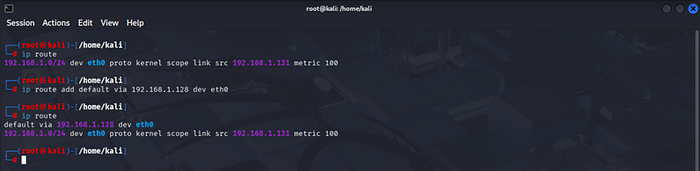
ping 8.8.8.8 #check the connection by access of internet from pfsense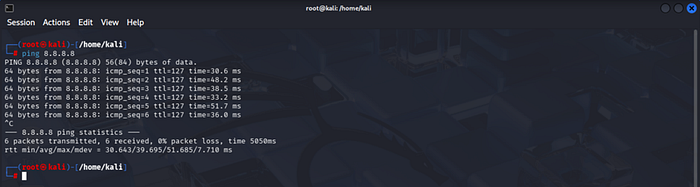
Access the pfSense Web Dashboard
Once pfSense is up and your host-only network is configured, you can manage everything from the web interface.
Open a browser and enter your pfSense LAN IP:
https://192.168.1.128(Default LAN IP = the static IP you set earlier)
Login with the default credentials:
Username: admin
Password: pfsense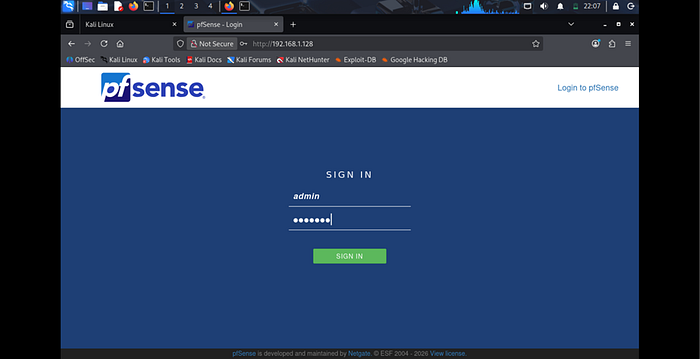
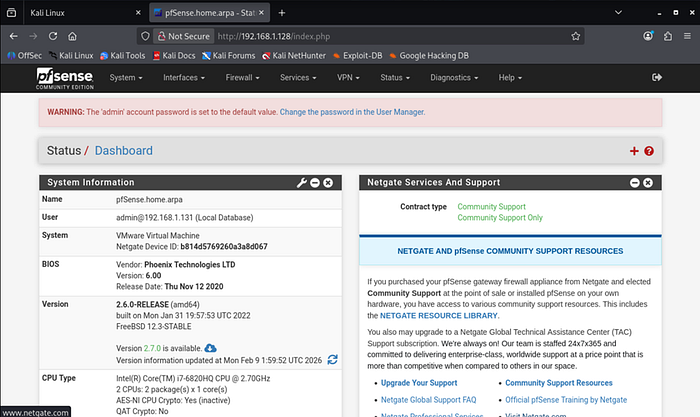
After logging into the pfSense web interface, head to: Status → Dashboard
Enabling Logging in pfSense
From the pfSense web interface, navigate to: Firewall → Rules → LAN This is where you control what traffic is allowed or blocked on your LAN network.
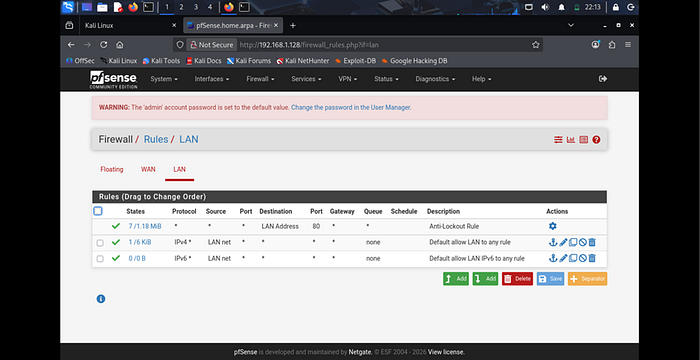
To monitor traffic properly, we should enable logging for default rules.
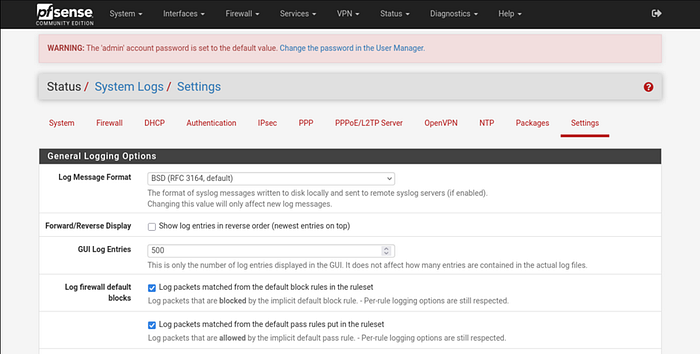
Go to: Status → System Logs → Settings Now: Tick Log packets matched from the default pass rules
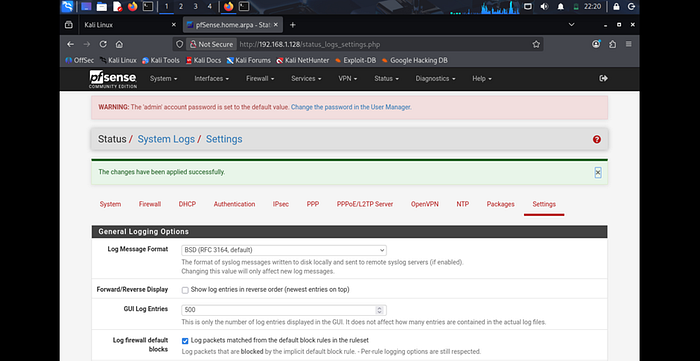
After clicking Save, your changes are now active. pfSense will start logging traffic matched by the default pass rules
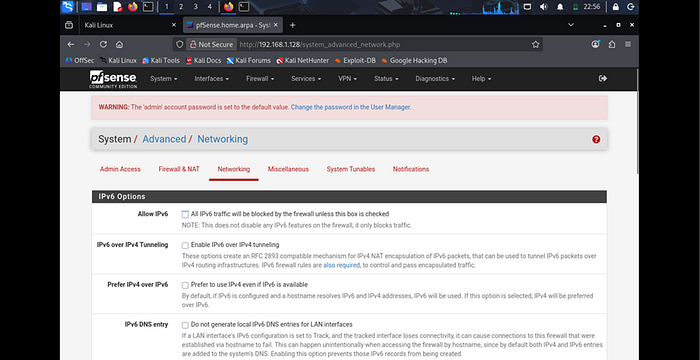
Go to: System → Advanced → Networking
You'll notice: Allow IPv6 is enabled by default Simply: Uncheck "Allow IPv6" and Click Save.
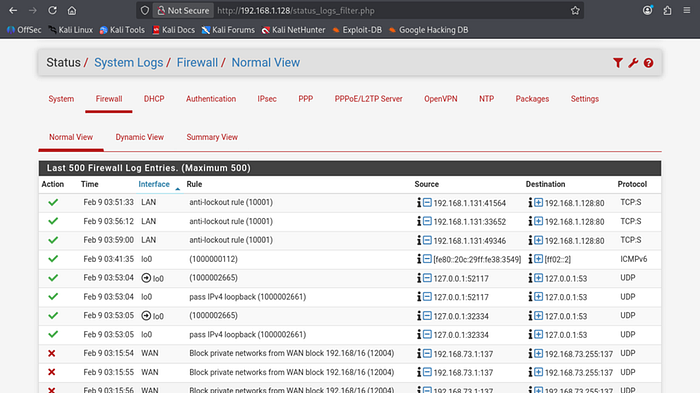
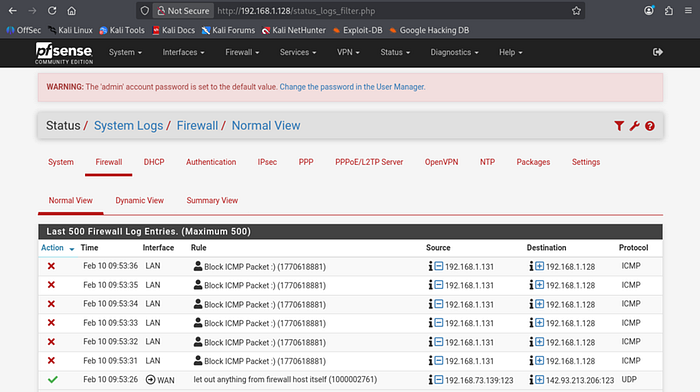
Now let's confirm that logging is actually working. Go to: Status → System Logs → Firewall → Normal View Here you'll see live firewall activity.
Now let's verify the IP of your Wazuh machine so it can properly communicate through pfSense.
Open the terminal on the Wazuh system and run:
ip addr

(or)

ifconfig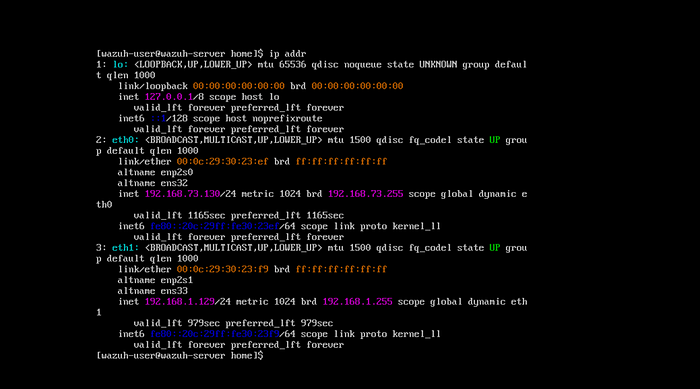
If you ever need to manually set the default gateway on your system, you can do it directly from the command line.
Since pfSense is your router/firewall, the gateway should be the pfSense LAN IP (in my case: 192.168.1.128).
ip route
sudo ip route add default via <pfsense_ip> dev eth1
ip route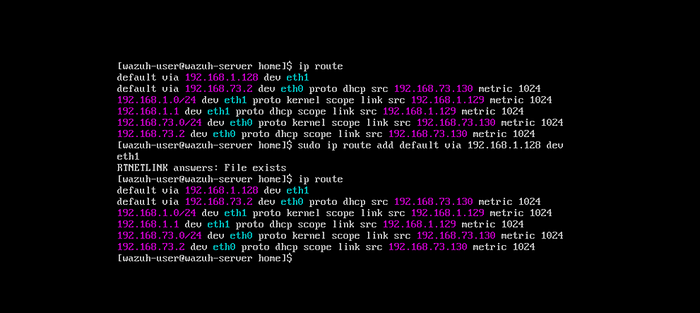
Now let's quickly verify that traffic is actually passing through pfSense (your gateway). Run:
traceroute 8.8.8.8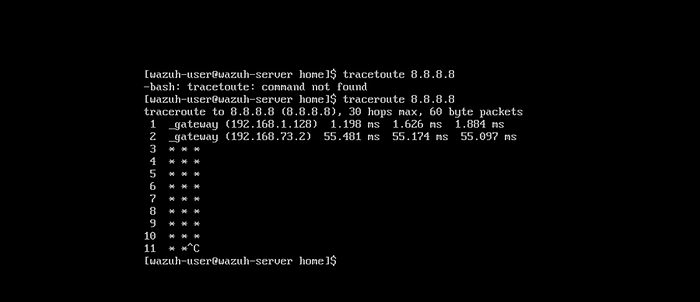
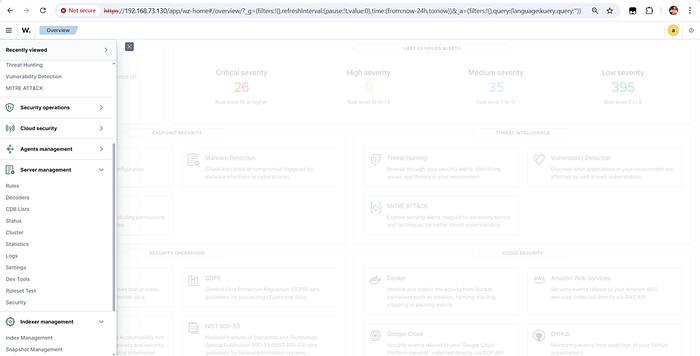
Configuring Wazuh to monitor logs
let's access the Wazuh dashboard to start monitoring logs and alerts. Open your browser and enter your Wazuh server IP:
To capture all raw logs (super useful for analysis and troubleshooting), enable full logging in Wazuh.
Open the config file: /var/ossec/etc/ossec.conf
Edit it:
sudo nano /var/ossec/etc/ossec.confFind or add these lines inside the <global> section:
<logall>yes</logall>
<logall_json>yes</logall_json>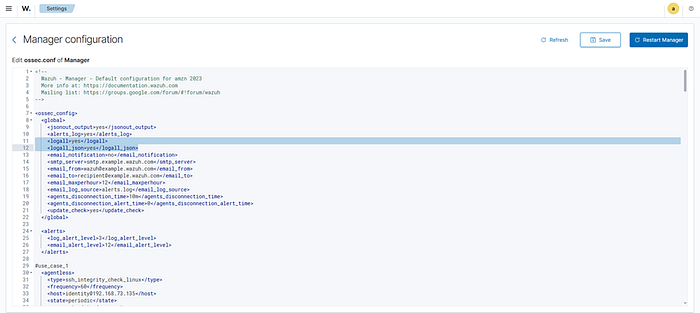
enable archives in Filebeat so Wazuh can ship archived logs properly to the dashboard/ELK. Open the Filebeat config:
sudo nano /etc/filebeat/filebeat.ymlFind the Wazuh module section and enable:
archives: true
After making config changes, restart both services so the updates take effect. Run:
sudo systemctl restart filebeat
sudo systemctl restart wazuh-manager
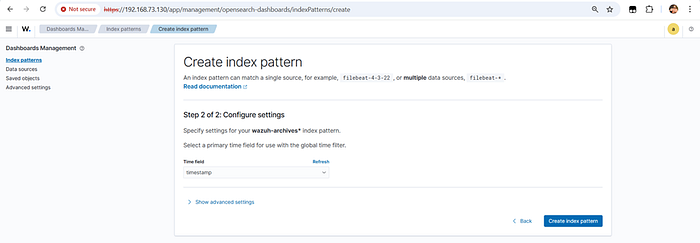
Now let's add an index pattern so the dashboard can read archived logs.
Go to: Dashboard → Dashboard Management → Index Patterns → Create Index Pattern
Enter: wazuh-archives* , Click Next Step.
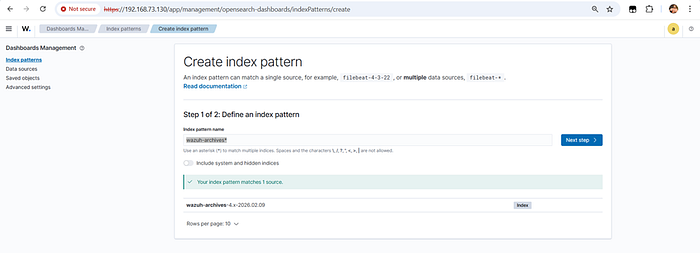
Now choose the time field: timestamp Then click: Create Index Pattern
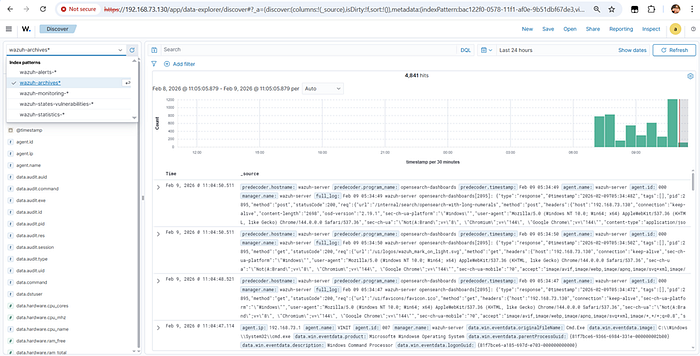
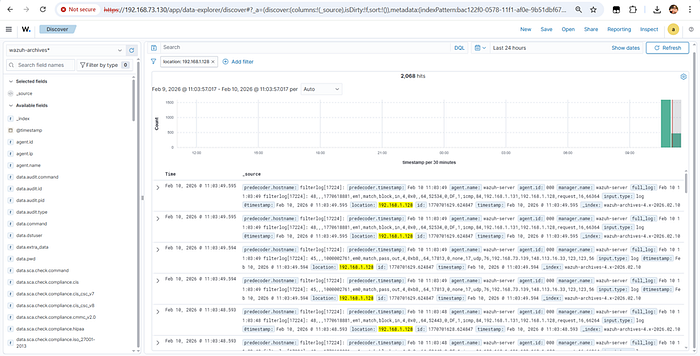
Now let's confirm that your archives index is actually receiving data. Go to: Dashboard → Discover
1. Select index → wazuh-archives*
2. Set time filter → Last 15 minutes / Last 1 hour
3. Refresh
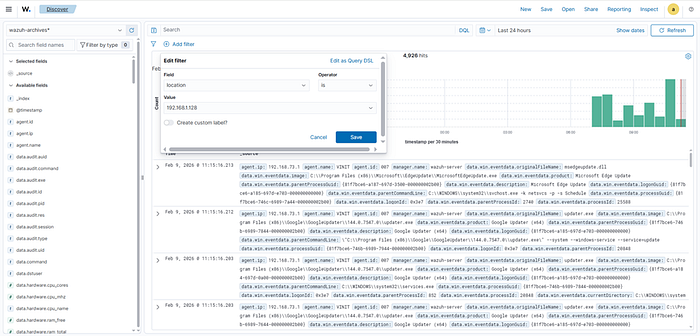
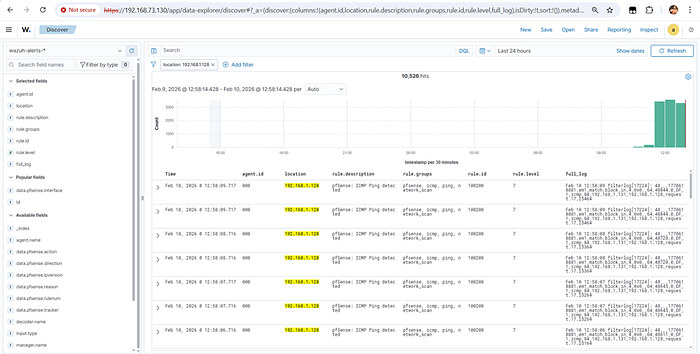
To view logs only for your pfSense system, add a filter in Discover. Go to: Dashboard → Discover → wazuh-archives*
Add filter
· Field → location
· Operator → is
· Value → 192.168.1.128
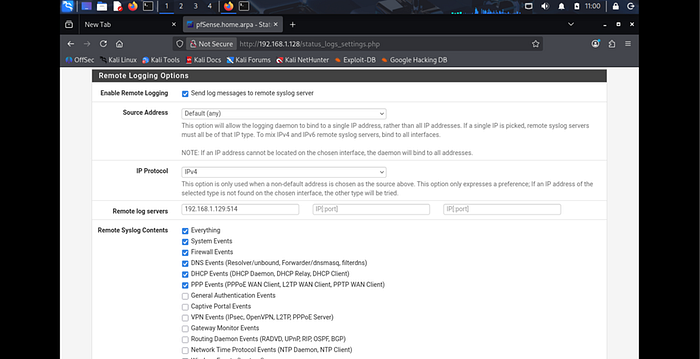
forward pfSense firewall logs directly to your Wazuh server for centralized monitoring. Go to: Status → System Logs → Settings → Remote Logging Options → Edit
Configure In Remote log servers, add:
<wazuh-forwarder-ip>:<port>Example:
192.168.1.150:514· 192.168.1.150 → Wazuh server (host-only IP)
· 514 → Syslog port (default)
Then click Save.
Create a new firewall rule
Add new Rules in LAN. Click on Add.
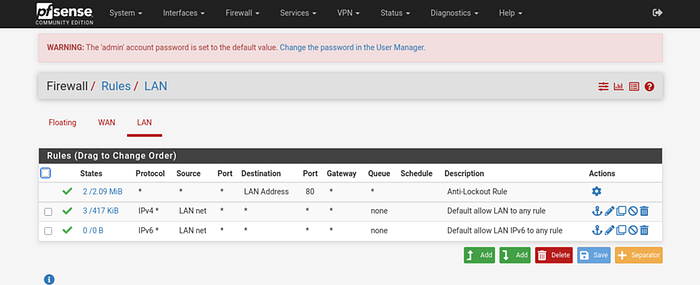
Rule for the LAN network. Go to: Firewall → Rules → LAN Then: Click Add (➕ icon)
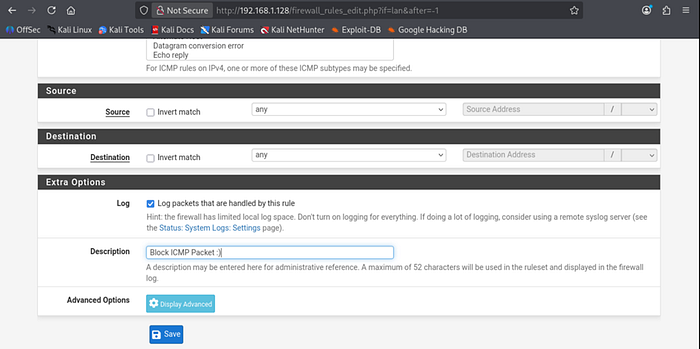
Basic Rule Setup (Lab Friendly) Set: · Action → Block · Interface → LAN · Protocol → ICMP · Source → Any · Destination → Any
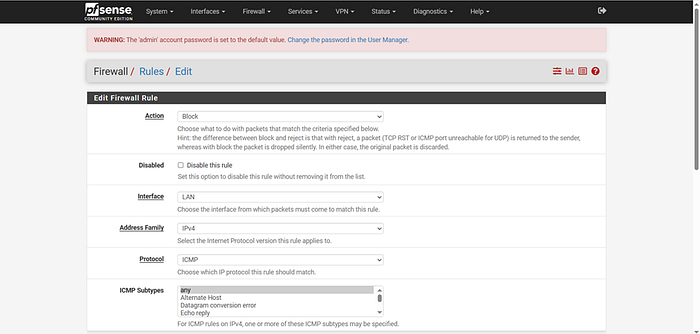
· Description → Block ICMP Packet :)
and Save it.
After creating or modifying the rule, don't forget the final step. - Click Apply Changes
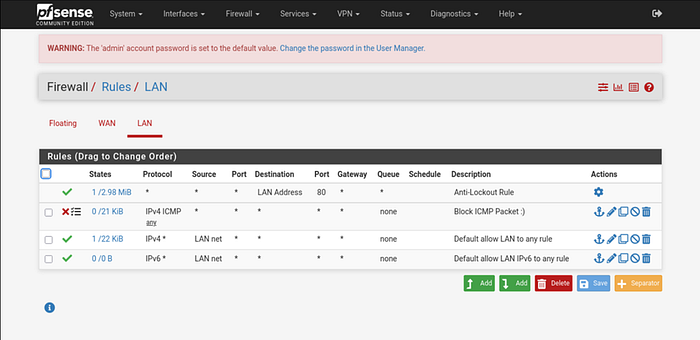
If your ping from Kali → pfSense is failing, it's likely the firewall is blocking ICMP.
Let's confirm it. Go to: Status → System Logs → Firewall → Normal View This confirms pfSense is blocking the ping.
Forwarding Logs to Wazuh
Configure Wazuh (ossec.conf)
To finalize Wazuh monitoring, we need to edit the main configuration file and add the necessary settings for logging and alerts. Open the file:
sudo nano /var/ossec/etc/ossec.confAdd or edit the configuration sections For example, to enable full logging and forwarding to the dashboard:
<remote>
    <connection>syslog</connection>
    <port>514</port>
    <protocol>udp</protocol>
    <local_ip>192.168.1.129</local_ip>
    <allowed-ips>192.168.1.128</allowed-ips>
  </remote>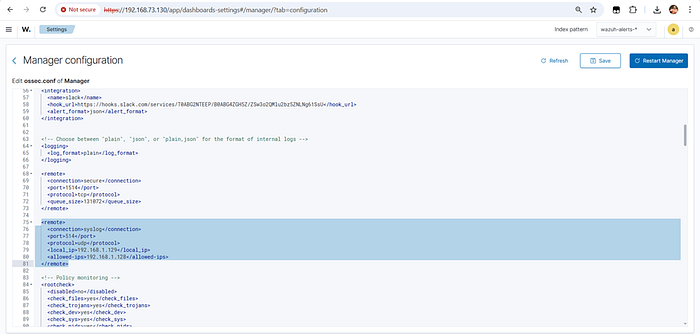
Check the logs in the wazuh-archives* index
Custom Decoders and Rules in Wazuh
Open Server Manager, navigate to Decoders, and click on local_decoder.xml to access and edit your custom decoders.
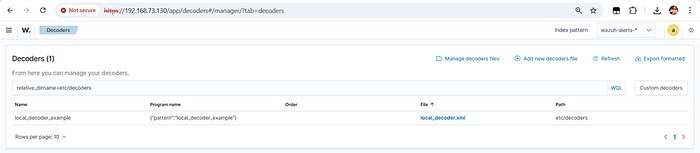
Next, open local_decoder.xml and add the following configuration to define your custom decoding rules.
<decoder name="pfsense-parent">
  <prematch type="pcre2">filterlog\[\d+\]: </prematch>
</decoder>

<decoder name="pfsense-filterlog-ipv4">
  <parent>pfsense-parent</parent>
  <regex offset="after_parent">^(\d+),,,(\d+),(\w+),(\w+),(\w+),(\w+),(\d+)</regex>
  <order>pfsense.rulenum, pfsense.tracker, pfsense.interface, pfsense.reason, pfsense.action, pfsense.direction, pfsense.ipversion</order>
</decoder>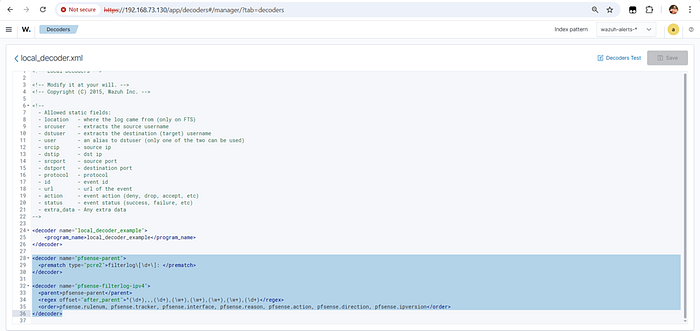
open local_rules.xml and add—or create—these custom rules to tailor Wazuh's alerting to your lab environment.
<group name="pfsense,">
 <rule id="100100" level="3">
  <decoded_as>pfsense-parent</decoded_as>
  <description>pfSense: Firewall log detected</description>
  <options>no_log</options>
 </rule>
 <rule id="100101" level="5">
  <if_sid>100100</if_sid>
  <field name="pfsense.action">block</field>
  <description>pfSense: Traffic blocked on interface $(pfsense.interface)</description>
  <group>firewall_drop,</group>
 </rule>
 <rule id="100200" level="7">
  <if_sid>100100</if_sid>
  <match>,icmp,</match>
  <description>pfSense: ICMP Ping detected</description>
  <group>icmp,ping,network_scan,</group>
 </rule>
</group>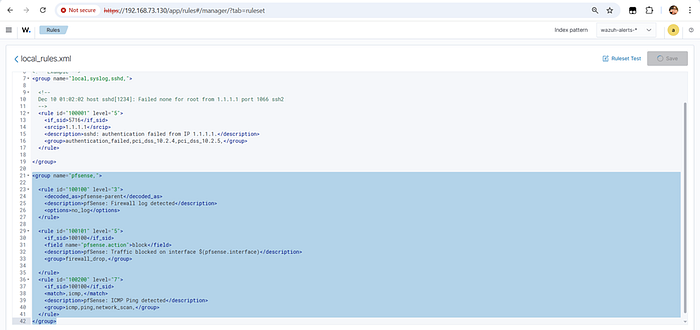
Testing the Integration
From your Kali Linux machine, ping the pfSense IP address to generate network activity, then head to the Wazuh dashboard to verify that the log has been captured.
Ping 192.168.1.128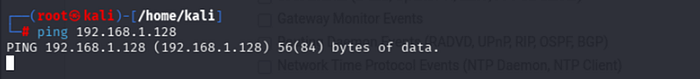
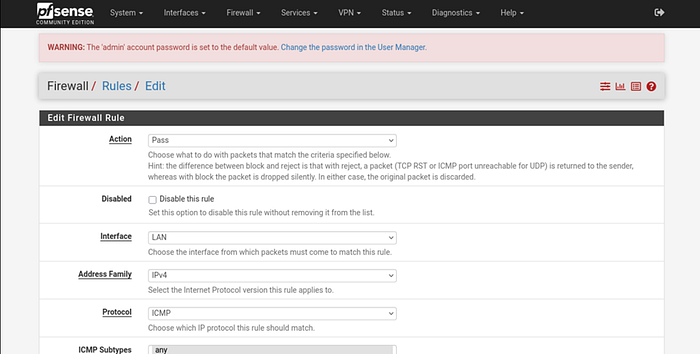
To test your rules, configure pfSense to block only ICMP packets. This will trigger the second rule and allow you to verify alert generation in Wazuh
In pfSense, go to the rule you want to edit, change the Action to Pass, and save your changes. This allows you to test and verify that your custom rule is triggering correctly in Wazuh.
Finally, use an Nmap aggressive scan against the pfSense IP address to generate detailed network activity and trigger additional alerts in Wazuh. This helps simulate real-world reconnaissance behavior and validates your detection rules. Run this command:
nmap -A <pfsense_ip>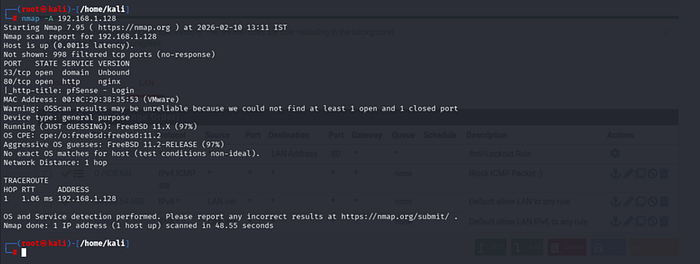
As expected, the scan triggered alerts in Wazuh, confirming that your custom rules and monitoring setup are working correctly.

Lessons Learned
- Agentless monitoring via Syslog is an efficient method to centralize firewall logs without the overhead of installing agents.
- Custom decoders and rules are essential to tailor alerts to the specific environment and reduce false positives.
- Testing with real-world scenarios like ping and port scans helps validate the effectiveness of the monitoring setup.
- Understanding network configurations and log forwarding mechanisms is critical for successful integration.
Key Takeaways
- pfSense can be integrated with Wazuh agentlessly using Syslog.
- Custom decoders and rules allow fine-tuned detection of firewall events.
- This lab setup provides a safe environment to simulate attacks and validate monitoring capabilities.
Final Note
This project gave me hands-on experience in integrating a firewall with a SIEM solution. As a SOC intern, building such labs helps bridge the gap between theory and practice, preparing me for real-world incident detection and response. I encourage others to adopt similar approaches to deepen their understanding and enhance their security operations.