
I won't over-explain SPL — I'll give you the exact tricks that make learning faster and SOC work easier and besides, Real SPL learning starts with patterns(Technical), not memorization — here's how to accelerate.
Now on the technical analysis mostly is where i'm gonna concentrate on for this walk-through , meaning that i will be covering the hard areas only ( that i personally thought to be ) and the easier areas I've left it for tryhackme which elaborated it very detailed and informational.
I'm covering the hard parts only
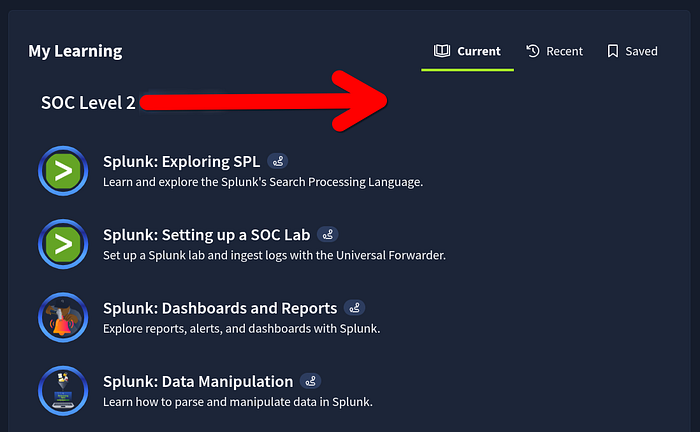
Splunk: Exploring SPL:
Learn and explore the Splunk's Search Processing Language.
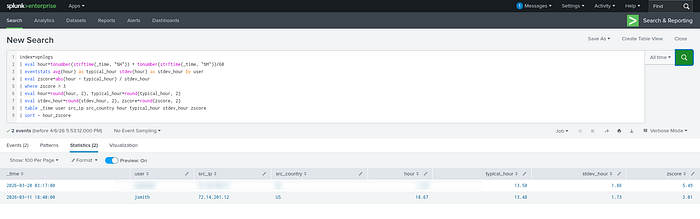
Task 7: Anormaly Detection…
index=vpnlogs
| eval hour=tonumber(strftime(_time, "%H")) + tonumber(strftime(_time, "%M"))/60
| eventstats avg(hour) as typical_hour stdev(hour) as stdev_hour by user
| eval zscore=abs(hour - typical_hour) / stdev_hour
| where zscore > 3
| eval hour=round(hour, 2), typical_hour=round(typical_hour, 2)
| eval stdev_hour=round(stdev_hour, 2), zscore=round(zscore, 2)
| table _time user src_ip src_country hour typical_hour stdev_hour zscore
| sort - hour_zscore
Run the second anomaly detection query (index=vpnlogs).
Which user suspiciously logged in at 3 AM?
If you still face somewhat problems, try this easier way:
index=vpnlogs "03:*" 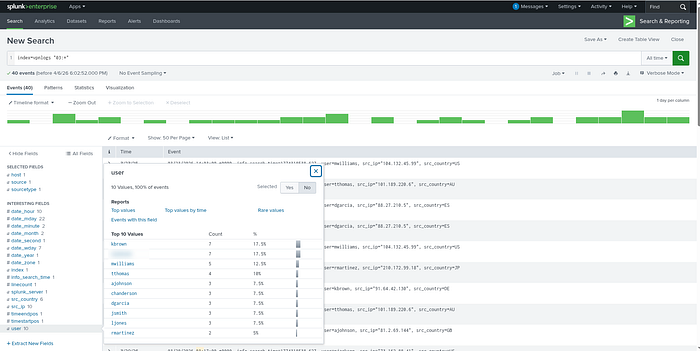
Go to User Fields, Select from the 2 with most count — From there, choose with your intuition …you got the answer !
Splunk: Setting up a SOC Lab:

This one is pretty elaborate nothing hard here …moving on!
Splunk: Dashboards and Reports:
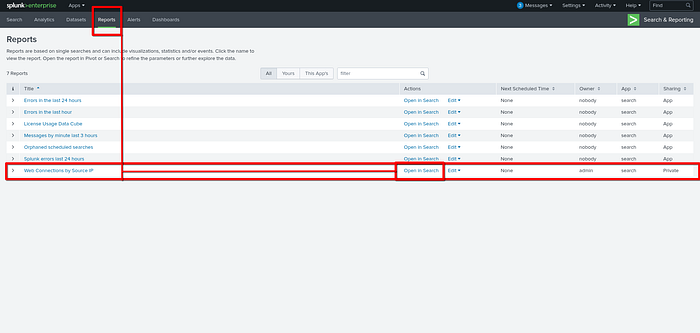
Task 2: Creating Reports for Recurring Searches…
While viewing the report above, click Edit → Open in Search to investigate the query behind the report.
What is the flag value hidden within the search query?
Navigate to Reports → Web connections by source ip then open in settings…
Task 3: Detecting with Alerts and Rules…
What is the highest number of 404's received in a given hour with the data available?
index=weblogs "404" URI="*" |timechart count by URI limit=10
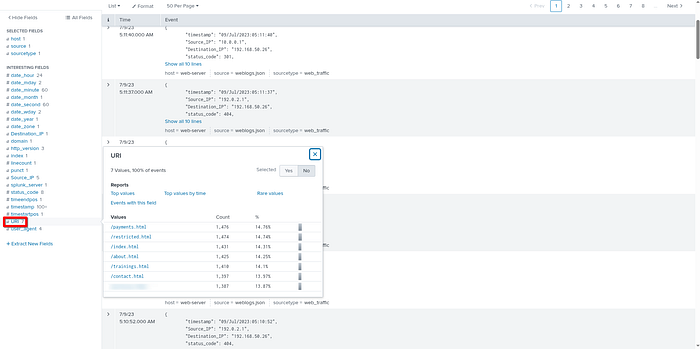
Task 4: Creating Dashboards for Summarizing…
Inspect the URI pie chart you built in the dashboard above. ( try to build the pie chart for laerning purposes )
Which URI field value has the least amount of events present?
" Easier way is to look at the URI Fields "
Look for the least at the bottom…
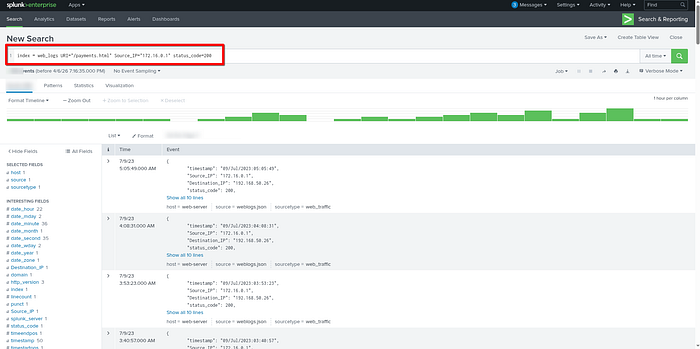
Add another statistics table to your dashboard to view the Source_IP, URI, and status_code fields.
How many times did 172.16.0.1 receive the status_code 200 from /payments.html?
Splunk: Data Manipulation:
Learning Objectives:
- Understand how Splunk ingests, parses, and normalizes machine data
- Create and manage core Splunk configuration files to control data
- Extract, normalize, and mask sensitive or custom fields
- Apply data manipulation techniques to build accurate search results…
Purchase Log Field Extraction:
In the previous task, we ingested purchase logs and masked the sensitive customer credit card information.
Your next task , should you choose to accept it — is to configure Splunk to extract the User and CC_Number fields from those events.
- Start with transforms.conf and add an entry for your field extraction using the regular expression below:
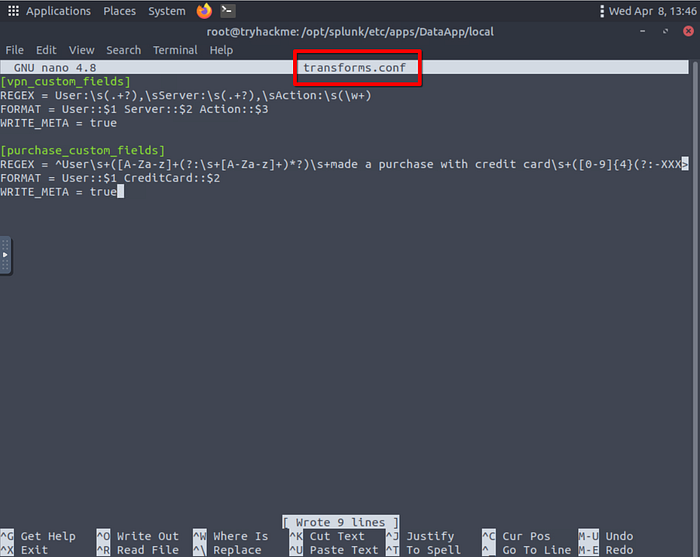
^User\s+([A-Za-z]+(?:\s+[A-Za-z]+)*?)\s+made a purchase with credit card\s+([0–9]{4}(?:-XXXX){3}|(?:\d{4}[\s-]?){3}\d{4})\.
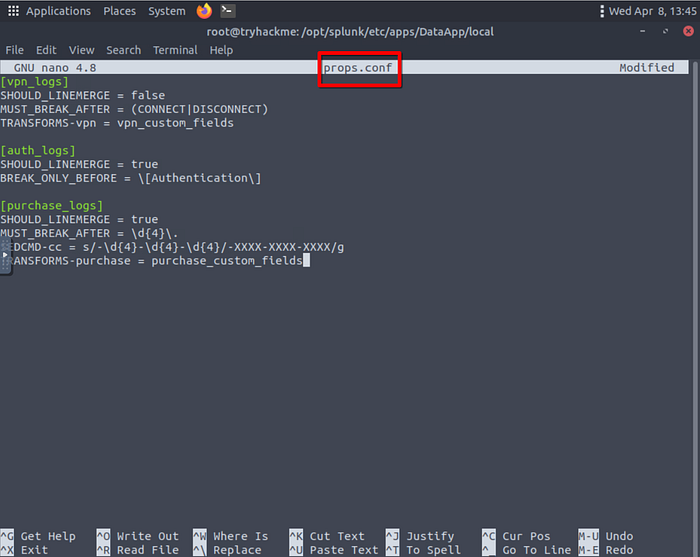
Next, update your props.conf configuration file:
Alter fields.conf to introduce your new fields:

Restart Splunk: And you should be able to Answer the questions below:
After performing field extraction on the purchase logs, how many User field values exist within the event data?
How many unique masked CC_Number field values were extracted from the events?
Alright , That's ALL FOLKS…
NEXT UP will be the FIXIT Walkthrough …
TILL THEN , LOVE YOU ALL !!!!!!