


When we first deployed StarRocks, our primary goal was speed: speed to deliver new use cases, speed to unlock real-time analytics in the product, and speed to move away from legacy patterns that were starting to hold us back.
To accelerate adoption, we made a pragmatic decision early on: reuse the DBT models originally built for Snowflake to power our StarRocks data infrastructure. This allowed the team to move extremely fast and ship new data-powered product features in record time.
But once those features were live, it became clear that what works well in Snowflake does not automatically translate to optimal performance in StarRocks, especially when views, joins, and dimensional modelling patterns are involved.
This post is about that realisation, the changes we made, and the mindset shift it forced on us.
What This Fact Table Powers in the Product
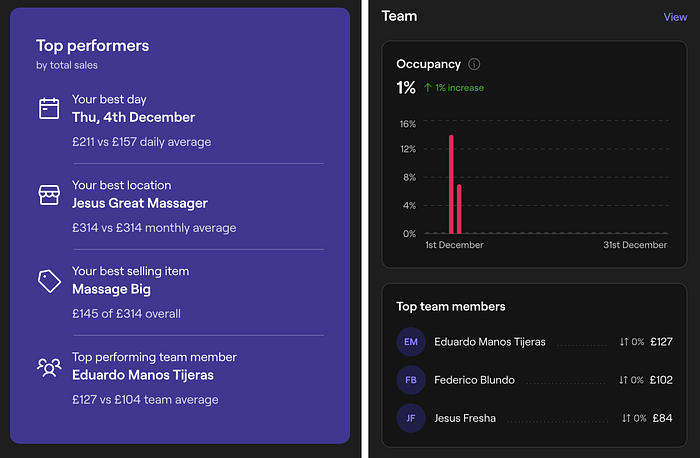
Before diving into modelling and performance, it's worth grounding this in real product use cases.
The fact table used as an example in this post — fact_sale_items—powers several real-time widgets in the application, including:
- Sales by employee
- Sales by location
- Sales by item
These widgets are visible directly in the product UI and are expected to respond in real time, which makes query latency and tail performance (p95/p99) critical.
The Initial State: Snowflake-Style Modelling in StarRocks
At the beginning, we reused Snowflake's current dimensional modelling approach a fact table with denormalised dimensional attributes.
This approach works very well in Snowflake's batch-oriented model, especially when queries consistently filter or group by the same dimensions. Because the joins are paid once at materialisation time, the resulting tables can freely expose additional dimensional attributes without incurring extra query-time cost.
In StarRocks, however, the fact is not materialized and is instead implemented as a view. As a result, all joins are executed at query time, meaning that even unused dimensions still incur a cost because the underlying tables must be scanned and joined. As the fact table expands to cover more use cases, this overhead compounds and query performance degrades rapidly.
At this stage, performance was acceptable:
- p95 latency ranged from ~200 ms to just over 1 second, depending on the query
- Fast enough to power the product
- But clearly inefficient when inspecting query profiles
A Red Flag: Query Profiles Told a Different Story
Once we started looking at query profiles, several patterns stood out:
- High memory allocation
- Large numbers of connector scan operators
- More rows scanned than strictly necessary
- Joins executed even when the dimension was not used by the query
In short, we were paying for data we didn't actually need.
This wasn't a StarRocks problem, it was a modelling problem.
Moving to a Query-Driven Physical Design
Instead of asking "What is the cleanest logical model?", we flipped the question to:
"What does this query actually need?"
We kept one logical fact table for consistency but changed the physical design, we added multiple denormalised projections (views), each optimised for a specific set of queries with the dimensions actually required for that use case.
This allowed us to keep the logical abstraction while tailoring the physical layout to StarRocks' strengths.
Trimming the Fat: Lineage-Driven Optimisation
We used fact_sale_items as our first case study.
The process was simple but systematic:
- List all queries that depend on the fact
- Analyse which dimensions are actually referenced
- Remove joins that never contribute to the result
- Validate correctness against production queries
The difference is very clear when visualised.
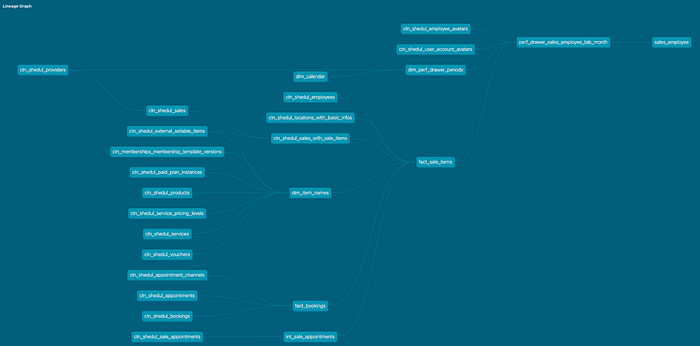
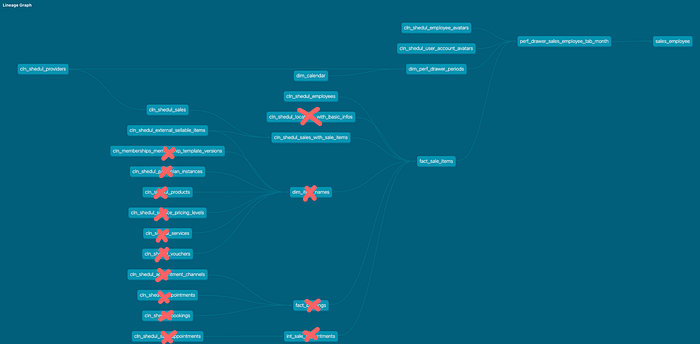
What changed:
- Fewer upstream tables
- Fewer joins
- Smaller execution graph
- Clear ownership of what each projection is meant to serve
Validation: Old vs New Architecture
After building the proof of concept, we validated it using real production queries, comparing the original Snowflake-style architecture with the new query-driven design.
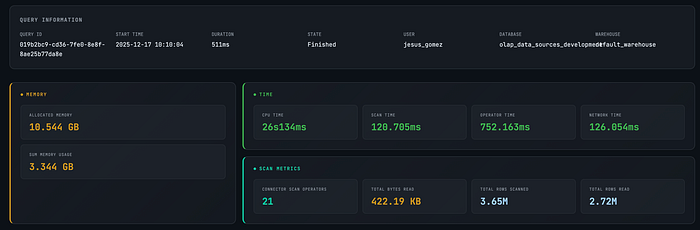
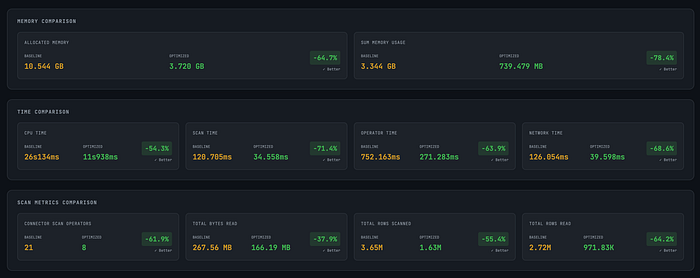
Memory Improvements
- Allocated memory: ↓ ~65%
- Total memory usage: ↓ ~78%
Execution Time Improvements
- CPU time: ↓ ~54%
- Scan time: ↓ ~71%
- Operator time: ↓ ~64%
- Network time: ↓ ~69%
Scan Metrics Improvements
- Connector scan operators: 21 → 8
- Rows scanned: 3.65M → 1.63M
- Rows read: 2.72M → 971K
Impact on Real-World Latency
Beyond individual query metrics, the most important result was what users actually experience.
Looking at latency over time, p50 dropped significantly and p99 spikes became far less frequent.
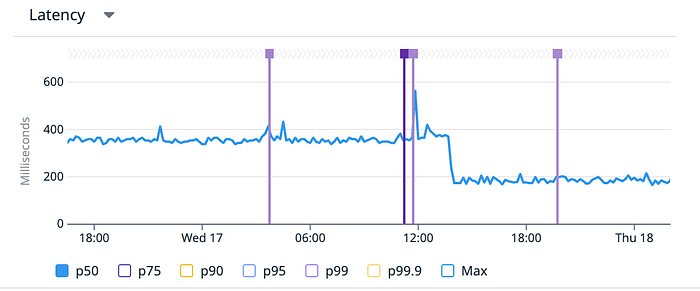
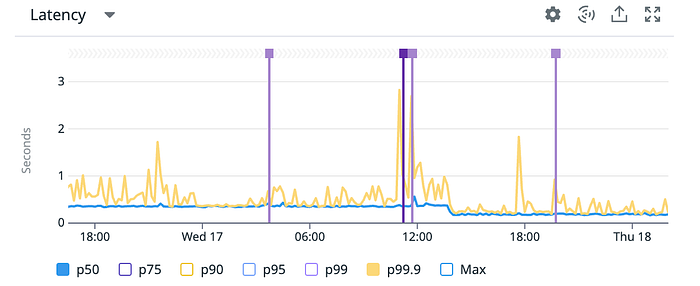
This directly translated into a smoother experience for real-time dashboards and widgets.
Trade-offs: Performance vs Readability
There is no free lunch.
A query-driven physical design:
- Improves performance dramatically
- Reduces wasted compute
- Aligns with StarRocks' execution model
But it also:
- Introduces more physical models
- Requires discipline in naming and ownership
- Can reduce readability if left unchecked
The core tension is simple: optimising for execution inevitably pushes complexity somewhere else.
Our Current Approach
Today, we handle this by creating multiple fit-for-purpose denormalised projections, each explicitly optimised for a specific class of queries. This keeps execution fast, predictable, and efficient — and for our current scale, it works extremely well.
However, as more use cases move to StarRocks, this approach does not scale linearly. Over time, the growing number of physical models becomes harder to reason about, harder to govern, and harder to evolve safely.
Where We're Headed
Longer term, we are exploring a templating layer on top of our main logical view.
Instead of exposing many physical projections, this layer would dynamically render only the joins, fields, and filters required for a given query based on its inputs. Conceptually, this brings us back to a single logical entry point — while still allowing StarRocks to execute a minimal, purpose-built physical plan.
You can think of it as a client-side modelling layer: similar in spirit to dbt, but focused on conditional query rendering rather than static model materialisation.
This will introduce additional complexity inside the templated view itself and require engineering investment. But it offers a promising path toward preserving the performance benefits of query-driven design without letting physical model sprawl become unmanageable.
Final Takeaway
The biggest lesson from this migration wasn't about StarRocks itself, it was about changing our data modelling mindset.
Our dimensional modelling done in Snowflake is not universally optimal.
When working with real-time analytical databases:
- Models should be query-driven
- Facts should only carry the data needed for the use case they power
- Physical design matters just as much as logical abstraction
By embracing that shift, we were able to:
- Reduce latency
- Lower resource usage
- Deliver faster, more reliable real-time features in the product
And most importantly, we set ourselves up for sustainable growth as more use cases move to StarRocks.
In a follow-up post, we'll walk through a real Fresha case study focused on query execution: how we analyse scans, joins, and execution plans, and how we iteratively optimise production queries for real-time performance. If you're interested in what that looks like in practice, stay tuned.