

In 8 minutes you'll know exactly what Perplexity Computer is, why it's a different product category from every coding agent you've seen, what it actually produced when I ran a real task on it and finally a 7 copy-paste prompts covering trading, software development, marketing, education, research, and freelancing that you can run today (down below).
I gave Perplexity Computer one task yesterday:
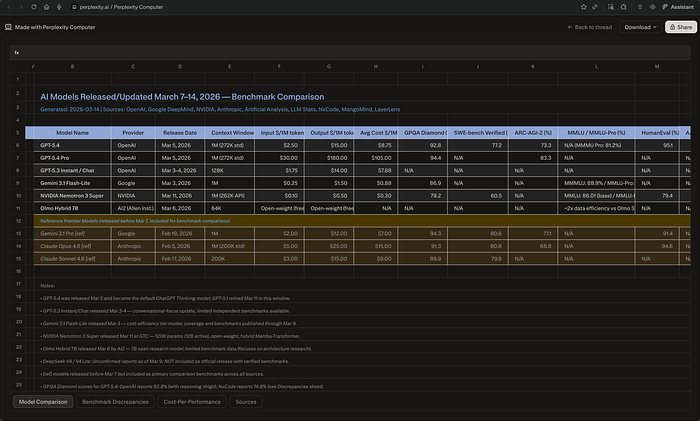
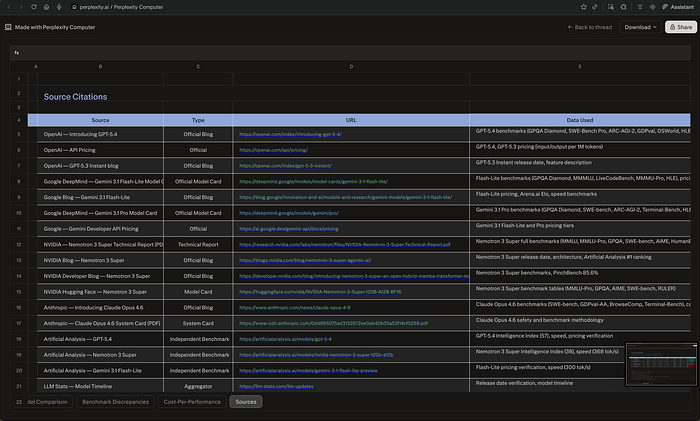
Seven minutes and seven seconds later, I had a spreadsheet in my downloads folder. Four sheets. Thirty-three cited sources. Ten documented benchmark discrepancies with source attribution and an explanation for each gap.
Then I looked at how it built the file. It hadn't exported text into a table. It had written a Python script — build_spreadsheet.py — and executed it.
I stared at my screen. Then I closed my 14 open tabs. Perplexity isn't a search engine anymore. That's a different category of tool.
Table of contents:
- What Perplexity Computer actually is
- What it did in 7 minutes on a real task
- Why the OpenClaw comparison is wrong
- Everything announced last week (that why I wrote this)
- 7 prompts across 6 fields
- The credit math

The 19 models behind the search bar
Back in October 2025, I spent 40 hours going through Perplexity's internal 42-page work guide. That document showed how they think about research quality — citation chains, source ranking, answer calibration. Every detail was deliberate.
Perplexity Computer is the execution layer built on that same logic.
It launched on February 25, 2026. At its core, Computer is a multi-model agent system that coordinates 19 AI models under a single interface. The central reasoning runs on Anthropic's Claude Opus 4.6, which handles orchestration and coding tasks. When it needs deep research, it routes to Gemini. Quick factual lookups go to Grok. Image generation goes to Nano Banana. Video tasks go to Veo 3.1.
You don't prompt it step by step. You give it a goal — "compare R&D spending across these three chip companies" — and it breaks that into subtasks, picks the right model for each one, runs them in parallel, and assembles the output.
It's not autocomplete with a search bar. It's a research assistant that runs inside one.
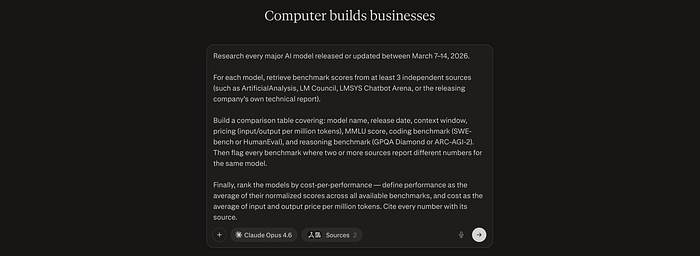
What I asked it to do
I asked Computer to find every AI model released between March 7–14, pull benchmark scores from at least three independent sources per model, flag wherever two sources disagreed on the same number, and rank everything by cost-per-performance.
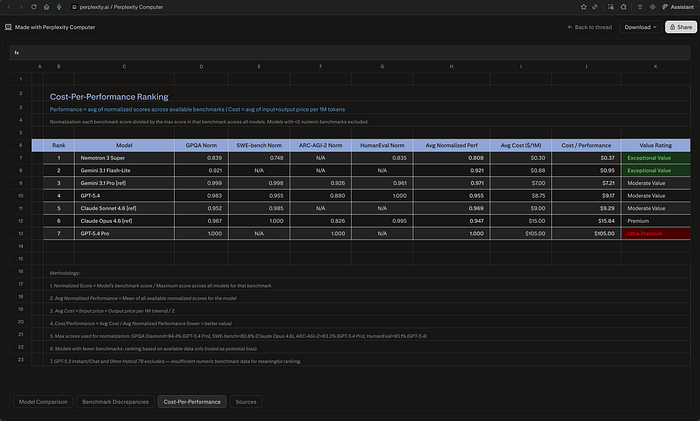
It worked for 7 minutes 7 seconds, used 363.20 credits, and delivered a 4-sheet Excel file — 10 flagged benchmark discrepancies with source attribution, a cost-per-performance ranking across 7 models, and 33 cited URLs. It didn't export text into a table. It wrote a Python script, executed it, hit errors mid-run, debugged itself, and rebuilt the file cleanly.
That last part is the answer to anyone who asks what separates this from a deep web search.
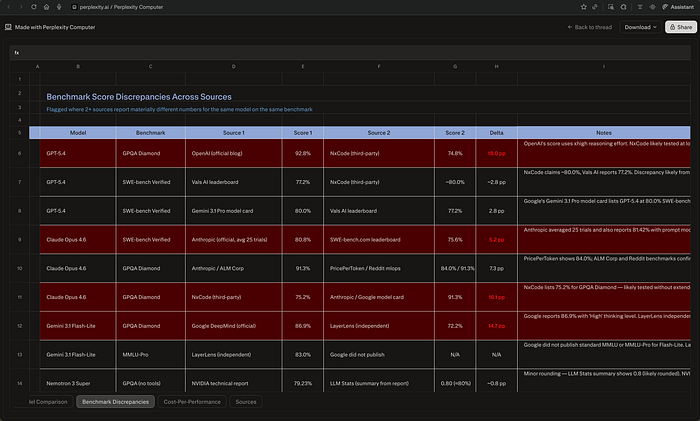
The output had things I didn't expect. The biggest discrepancy: GPT-5.4's GPQA Diamond score is 92.8% in OpenAI's own blog and 74.8% per NxCode — an 18-point gap explained by reasoning effort settings, which Computer flagged and sourced.
The most useful finding: NVIDIA's Nemotron 3 Super, released March 11 at $0.10/$0.50 per million tokens, scored a cost-per-performance ratio of $0.37 against GPT-5.4's $9.17 — same performance tier, 25x cheaper.
I wouldn't have run that math manually. Computer did it without being asked.
You can see the full results here: Session Link

Stop calling this an OpenClaw alternative
I keep seeing comparisons on X and Reddit — "Perplexity Computer vs. OpenClaw vs. Claude Code." They miss the point.
OpenClaw is a coding agent. It writes code, debugs code, ships code. Claude Code does the same. Both live in your terminal or IDE. Their job is to produce software.
Perplexity Computer does not write code.
It reads filings, pulls data from multiple sources, cross-references numbers, and builds structured analyses with citations.
If you need a competitive intelligence brief or a market research summary, Computer does that.
If you need a React component, use OpenClaw or Claude Code — they live in your terminal and produce software. Different category, different workflow.
Different category. Different buyer. Different workflow.
What Perplexity announced at Ask 2026
On March 11, Perplexity held their first developer conference — Ask 2026. Here's what they shipped:
Personal Computer is software that runs on a dedicated Mac mini, giving Perplexity's cloud AI persistent access to local files, apps, and sessions — 24 hours a day. It connects to Gmail, Slack, GitHub, Notion, and Salesforce. It monitors triggers and runs tasks while you're away. Sensitive actions require your approval, and a kill switch gives you immediate control. It's available to Max subscribers ($200/month) through a waitlist.
The enterprise version connects to Snowflake, Databricks, Salesforce, and HubSpot. Perplexity says that in internal testing across 16,000+ queries, the system completed what they estimate at 3.25 years of human work in four weeks, saving about $1.6 million in labor costs. Those are Perplexity's own numbers — no independent audit has been published yet.
Four new APIs — Search, Agent, Embeddings, and Sandbox — are now available to developers. These are the same components that power Computer internally.
Paywalled data from Statista, CB Insights, and PitchBook now feeds directly into Computer's research workflow. For market research and investment analysis, this means you can pull data that previously required separate paid subscriptions.
Computer is also on iOS now, with cross-device sync. Start a task on your phone, manage it from your desktop. Android is coming later.
7 prompts that turn Computer into your research assistant
The prompt format below follows a specific structure designed for Computer's agentic workflow. Each prompt has five parts:
- Task: a clear one-sentence objective
- Search and retrieve: the specific data Computer should pull
- Steps: the analytical framework to apply to that data
- Constraints: rules for output quality and honesty
- Output: the exact deliverables you expect back
Here's the standard format, followed by one prompt for each field.
STANDARD FORMAT EXAMPLE: MARKET ENTRY ANALYSIS
Task: Evaluate whether [COMPANY NAME] should enter [TARGET MARKET] within the next 12 months.
Search and retrieve:
- Total addressable market size for [TARGET MARKET] from at least 3 independent sources
- Top 5 incumbents by market share, with their most recent revenue and growth rates
- Regulatory requirements and compliance costs specific to [TARGET MARKET]
- Recent entrants (last 24 months), their funding, and their current traction metrics
- [COMPANY NAME]'s current product capabilities and adjacent market presence from public filings or press releases
Steps:
- Size the opportunity: compare TAM estimates across sources and explain discrepancies
- Map the competitive density: identify where incumbents are strongest and where gaps exist
- Assess barriers to entry: licensing, capital requirements, distribution, switching costs
- Evaluate fit: match [COMPANY NAME]'s existing capabilities against the requirements identified in step 3
- Model two scenarios — organic entry vs. acquisition of an existing player — with estimated cost and time-to-revenue for each
Constraints: Cite every market size figure and growth rate with its source. Do not use phrases like "rapidly growing" or "significant opportunity" without attaching a number. Flag where data is estimated vs. reported.
Output: Market size comparison table, competitive map, barrier assessment, fit score, two-scenario cost/timeline model, go/no-go recommendation with the three strongest supporting data points.
1/ TRADING: SECTOR ROTATION SIGNAL
Task: Identify the 3 equity sectors most likely to outperform over the next quarter based on current macroeconomic data and fund flow patterns.
Search and retrieve:
- Latest GDP growth rate, CPI reading, and unemployment figure (most recent data release for each)
- Federal Reserve's most recent policy statement and dot plot projections
- ETF fund flow data by sector for the past 30, 60, and 90 days
- Sector-level earnings revision ratios (upgrades vs. downgrades) for the current quarter
- Credit spread levels (investment grade and high yield) vs. their 12-month average
Steps:
- Classify the current macro regime: growth accelerating/decelerating crossed with inflation rising/falling
- Pull the 3 historical periods from the last 30 years that most closely match this regime and list which sectors led during each
- Cross-reference the historical pattern with current fund flows — identify where money is moving and where it's leaving
- Filter for earnings momentum: keep only sectors where revision ratios confirm the macro and flow signals
- Rank the final 3 sectors by signal convergence — macro fit, flow direction, and earnings revisions all pointing the same way
Constraints: Every sector recommendation must have at least 2 of the 3 signals (macro, flow, revisions) aligned. Flag where a signal contradicts the thesis. Separate the structural view (6+ months) from the tactical trade (1–3 months).
Output: Macro regime classification, historical analog table with sector performance, fund flow heatmap by sector, earnings revision table, final 3-sector ranking with entry rationale and the specific data point that would invalidate each pick.
2/ SOFTWARE DEVELOPMENT: TECH DEBT AUDIT
Task: Assess the technical debt load in [REPOSITORY NAME / URL] and produce a prioritized remediation plan.
Search and retrieve:
- Repository structure, primary language breakdown, and dependency list
- Open issues and pull requests tagged as bugs, tech-debt, or refactor (last 12 months)
- CI/CD pipeline configuration and recent build failure logs (last 30 days)
- Test coverage percentage by module (if available from coverage reports)
- Dependency versions and known CVEs from the current lockfile
Steps:
- Map the codebase by module: size (LOC), test coverage, bug density (open issues per 1,000 lines), and age of last major refactor
- Identify the 5 highest-risk modules — defined as the intersection of low coverage, high bug density, and outdated dependencies
- For each high-risk module, list the specific debt items: deprecated API usage, pinned dependency versions with known CVEs, duplicated logic, missing error handling
- Estimate remediation effort for each item in developer-hours, bucketed as small (< 4h), medium (4–16h), or large (16h+)
- Rank all items by (risk severity × frequency of change) to prioritize what to fix first based on actual impact
Constraints: Do not flag stylistic preferences (tabs vs. spaces, naming conventions) as tech debt. Only flag items that affect reliability, security, or development velocity. If test coverage data is unavailable, state that explicitly rather than estimating.
Output: Module health table (coverage, bug density, dependency age), top-5 risk modules with specific debt items, prioritized remediation backlog with effort estimates, and a recommended 4-week sprint plan for the top 10 items.
3/ MARKETING: COMPETITOR CAMPAIGN TEARDOWN
Task: Reverse-engineer [COMPETITOR NAME]'s marketing strategy for [PRODUCT/CAMPAIGN] over the past 90 days and identify the 3 tactics worth replicating.
Search and retrieve:
- All ad creatives from [COMPETITOR NAME] on Meta Ad Library and Google Ads Transparency Center for the past 90 days
- Their top 10 organic posts by engagement on LinkedIn, X, and Instagram during the same period
- Landing pages currently active for [PRODUCT/CAMPAIGN], including URL structure, CTA copy, and form length
- SEO keyword rankings for [COMPETITOR NAME]'s domain related to [PRODUCT CATEGORY] (top 20 keywords by traffic)
- Any press mentions, sponsored content, or influencer partnerships from the past 90 days
Steps:
- Map the campaign funnel: which channels drive awareness (paid social, PR), which drive consideration (SEO, landing pages), and which drive conversion (retargeting, email)
- Identify the 3 highest-performing ad creatives based on estimated spend and run duration (longer run = higher performance signal)
- Analyze messaging patterns: what pain points they lead with, what proof points they use, what CTAs they repeat across channels
- Compare their SEO keyword targets against yours — find the keywords they rank for that you don't, and vice versa
- Estimate their monthly ad spend range based on visible ad volume and platform benchmarks
Constraints: Do not infer internal metrics (conversion rates, ROAS) that aren't publicly visible. Base all performance estimates on observable signals: ad run duration, engagement rates, keyword rankings. Separate what you can verify from what you're inferring.
Output: Campaign funnel map, top 3 creatives with screenshots and analysis, messaging pattern summary, SEO gap analysis, estimated spend range, and 3 specific tactics to replicate with your recommended adaptation for [YOUR BRAND].
4/ EDUCATION: CURRICULUM GAP ANALYSIS
Task: Evaluate [COURSE NAME / PROGRAM] at [INSTITUTION] against current industry skill demands for [JOB ROLE] and identify the 5 largest gaps.
Search and retrieve:
- The full syllabus or course catalog for [COURSE NAME / PROGRAM]
- The 50 most recent job postings for [JOB ROLE] from LinkedIn, Indeed, and Glassdoor — extract required skills, tools, and certifications
- Industry certifications and their topic coverage (e.g., AWS Solutions Architect, PMP, CFA)
- Published employer surveys on skills gaps for [JOB ROLE] from the past 2 years
- Competing programs at 3 peer institutions — their course lists and any published learning outcomes
Steps:
- Build a skill frequency table from the job postings: list every skill, tool, and certification mentioned, ranked by how often it appears
- Map each item in the frequency table to the current syllabus — mark as "covered," "partially covered," or "missing"
- Cross-reference gaps against the competing programs — identify which gaps the peer institutions address and which are missing across all programs
- For each of the top 5 gaps, estimate the effort to close: new course, module addition to existing course, or extracurricular workshop
- Prioritize by employability impact: rank gaps by job posting frequency × absence from current curriculum
Constraints: Only count skills that appear in at least 10% of the sampled job postings. Do not flag niche or company-specific tools unless they appear across multiple employers. Cite the job posting count for every skill listed.
Output: Skill frequency table (top 30 skills with counts), curriculum coverage map, peer comparison matrix, top 5 gaps with remediation options and effort estimates, recommended implementation timeline.
5/ RESEARCH: LITERATURE REVIEW SYNTHESIS
Task: Produce a structured literature review on [RESEARCH TOPIC] covering publications from the past [TIME PERIOD] and identify the 3 most contested findings.
Search and retrieve:
- The 20 most-cited papers on [RESEARCH TOPIC] from Google Scholar, Semantic Scholar, or PubMed published within [TIME PERIOD]
- For each paper: authors, journal, year, sample size, methodology, and primary finding
- Meta-analyses or systematic reviews on [RESEARCH TOPIC] published within [TIME PERIOD]
- Replication studies or contradictory findings for the top 5 most-cited papers
- Funding sources for the top 10 papers (if disclosed)
Steps:
- Group the 20 papers by methodology: experimental, observational, computational, theoretical
- Identify the 3 findings where published results directly contradict each other — list the specific claim, the papers on each side, their sample sizes, and their methodologies
- For each contested finding, assess whether the disagreement comes from methodology differences, sample differences, or definitional differences
- Map the citation network: which papers cite which, and whether any cluster of findings traces back to a single lab or funding source
- Identify the 3 open questions where the existing literature does not provide a clear answer
Constraints: Do not describe any study as "groundbreaking" or "seminal" — report its citation count and let the reader judge. Report exact sample sizes, not "large-scale" or "extensive." If a study's methodology limits its generalizability, state the specific limitation.
Output: Paper summary table (20 rows: authors, journal, year, method, sample size, finding), methodology distribution chart, 3 contested findings with evidence from both sides, citation network map, 3 open questions with the specific data needed to resolve each one.
6/ FREELANCING: CLIENT PROJECT SCOPING
Task: Build a complete project scope and pricing estimate for a [PROJECT TYPE] engagement with [CLIENT NAME / INDUSTRY] based on their stated requirements.
Search and retrieve:
- [CLIENT NAME]'s website, product pages, and any public documentation about their current system or workflow
- Industry-standard hourly rates for [PROJECT TYPE] by region from published freelancer surveys (Payoneer, Toptal, or Upwork market reports)
- 3 comparable completed projects on portfolio sites or case studies — extract their scope, timeline, and pricing (where public)
- Common scope creep triggers for [PROJECT TYPE] from freelancer forums and post-mortems
- Technical requirements and tool/license costs specific to [PROJECT TYPE]
Steps:
- Break the project into deliverables: list each discrete output the client expects, with acceptance criteria for each
- Estimate hours per deliverable, using the comparable projects as benchmarks — bucket into design, development, testing, and revision phases
- Calculate pricing: (total hours × your rate) + tool/license costs + a 15% scope buffer
- Identify the 3 most likely scope creep triggers based on the project type and build explicit exclusion clauses for each
- Draft a milestone schedule: what's delivered when, what requires client feedback before proceeding, and where the timeline is most at risk
Constraints: Do not underestimate revision time — use 20% of development hours as the baseline for revisions unless comparable projects show otherwise. Do not quote a fixed price without specifying what is and isn't included. Flag where the client's requirements are ambiguous and need clarification before work starts.
Output: Deliverable breakdown with acceptance criteria, hourly estimate per phase, total pricing with buffer, scope exclusion clauses, milestone schedule with feedback dependencies, and a list of ambiguous requirements that need client clarification.
Each of these prompts follows the same structure. Change the variables and you can adapt them to almost any research-heavy task. The point is not to ask Computer a question — it's to give it a complete assignment with specific data requirements, an analytical framework, and output specs.
The credit math
Perplexity Computer is available to Pro and Max subscribers. Pro users are getting access through a new "Usage and Credits" page, and new signups are receiving 4,000 bonus credits.
Max subscribers pay $200/month and get 10,000 credits plus 20,000 bonus credits. Each Computer task costs credits based on complexity — a simple lookup might run 5–10 credits, while a deep multi-step analysis like the prompts above can cost 100+.
If you're already paying for Perplexity Pro, test the credit system before committing to Max. Run three or four real tasks from your actual workflow and see how fast you burn through the allocation. That tells you more than any pricing calculator.
What I'm watching next
Last year, I spent 40 hours reverse-engineering how Perplexity thinks about research. Now they've built the machine that follows that same logic — with 19 models doing the work.
The product is not without problems. The credit system is opaque — there's no public breakdown of what specific task types cost. The Mac mini requirement for Personal Computer locks out anyone not in Apple's hardware ecosystem. And Perplexity's enterprise numbers (3.25 years of work in four weeks) are self-reported with no third-party validation.
But the core function works. I gave it a research task. It came back with cited sources, real numbers, and a structured output that I could edit rather than build from scratch. That's a different kind of tool than what Perplexity was months ago.
Have you tested Computer yet? What was the first task you ran? Drop it in the comments — I'm tracking the best use cases for a follow-up piece.

This story is published on Generative AI. Connect with us on LinkedIn and follow Zeniteq to stay in the loop with the latest AI stories.
Subscribe to our newsletter and YouTube channel to stay updated with the latest news and updates on generative AI. Let's shape the future of AI together!
