

Salesforce Dashboard to SQL
Recently, I was given a task:
"Study the client's Salesforce dashboard beforehand so we can speed up data mapping with the client during the migration."
Sounds simple, right? Identify the source logic, match it to the warehouse fields, and the mapping is complete.
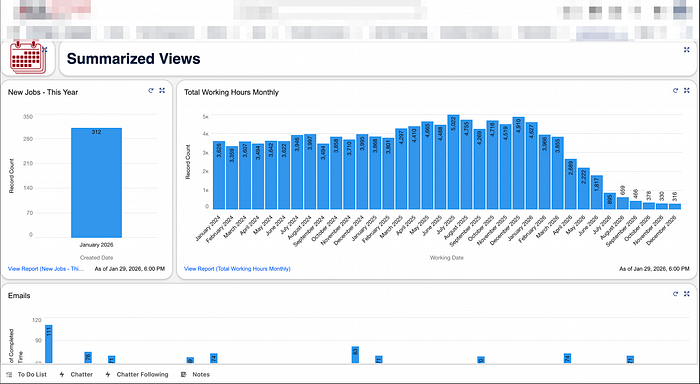
Except this dashboard was built entirely in Salesforce using drag-and-drop:
- No SQL scripts
- No backend queries
- No documentation
- Only friendly labels and aliases
So you're stuck in email threads asking:
"Hey… where does this metric come from?"
Back and forth. For days. There has to be a better way. Right? RIGHT!
The solution: Inspect Element is your best friend 🦸
Even though Salesforce hides the logic, the browser doesn't.
Every dashboard component ultimately pulls data through:
- Network API calls
- JSON payloads
- Report metadata
If you can read that, you can uncover:
- Real object names
- Field API names
- Calculated column logic
- Filters and aggregations
- The exact report powering the chart
No SQL required.
Step 1 — Open the underlying report
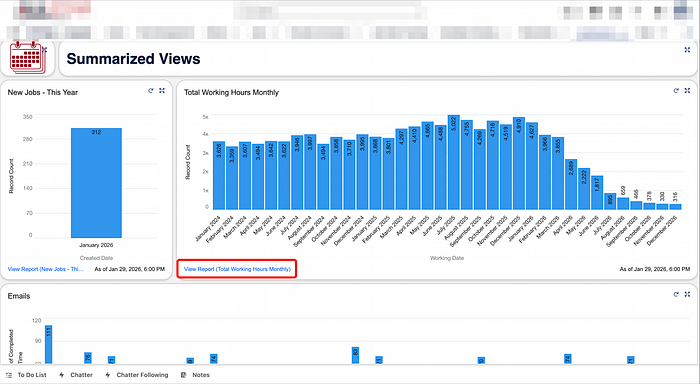
From any Salesforce dashboard:
- Find the chart or table you care about
- Click "View Report"
This opens the actual report behind the visualization — the true source of the metric.
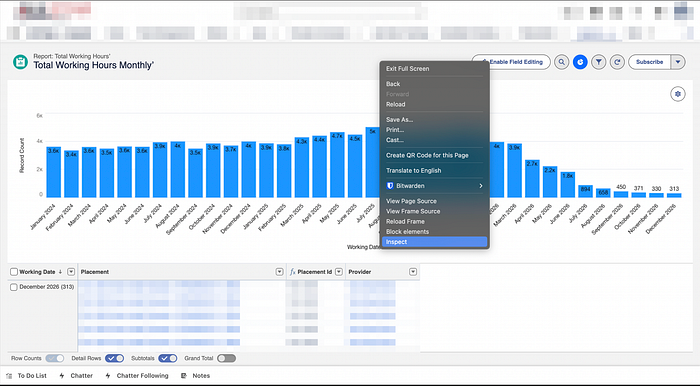
Step 2 — Inspect the network traffic
2.1 Open DevTools
- Right-click → Inspect
- Or use:
- Ctrl + Shift + C (Windows) or Cmd + Option + C (Mac)
2.2 Go to the Network tab
This is where Salesforce loads the report data as JSON.
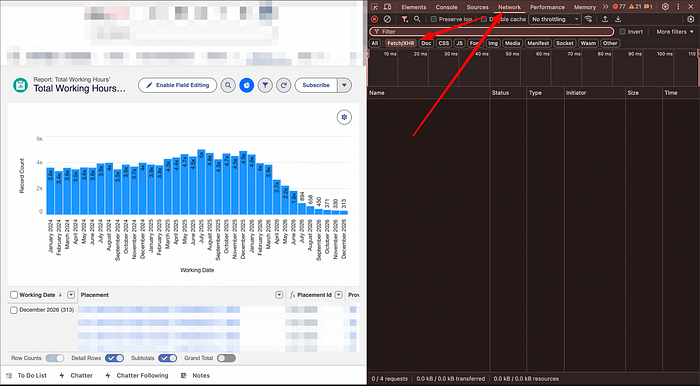
You'll usually see two situations:
- ✅ Too many requests
- ❌ No requests yet
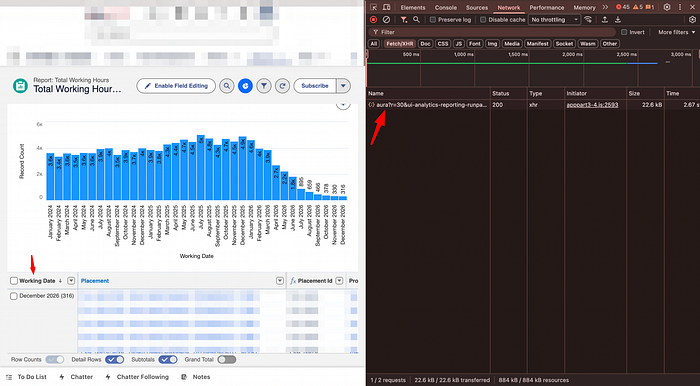
If it's messy → hit Clear 🧹
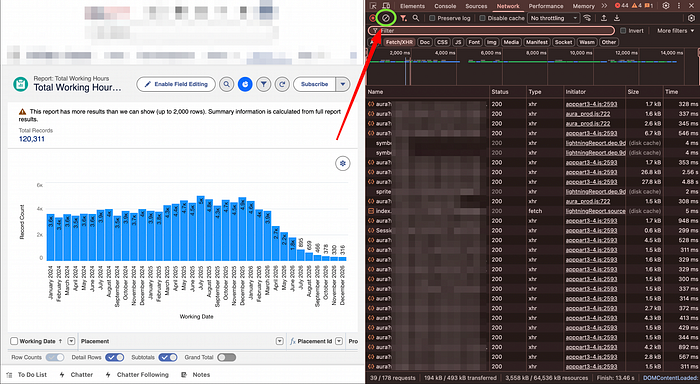
Then interact with the report (sort a column, change a filter) to trigger a fresh API call.
2.3 Find the correct payload
Open the latest network request → Preview tab.
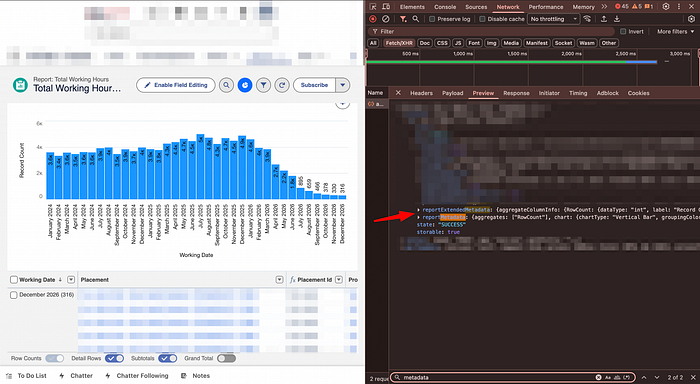
Search inside the JSON using Ctrl + F (Windows/Linux) or Cmd + F (Mac):
- reportMetadata
- reportExtendedMetadata
These contain everything:
Now you finally see the real API field names behind those friendly dashboard labels.
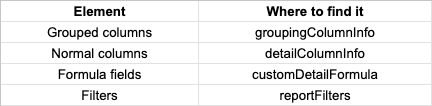
Grouped columns
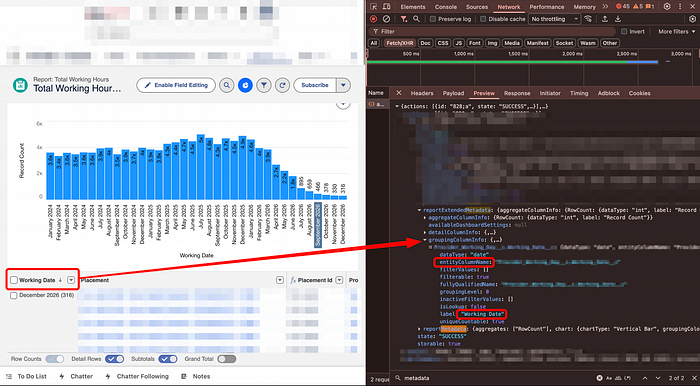
groupingColumnInfoNormal columns
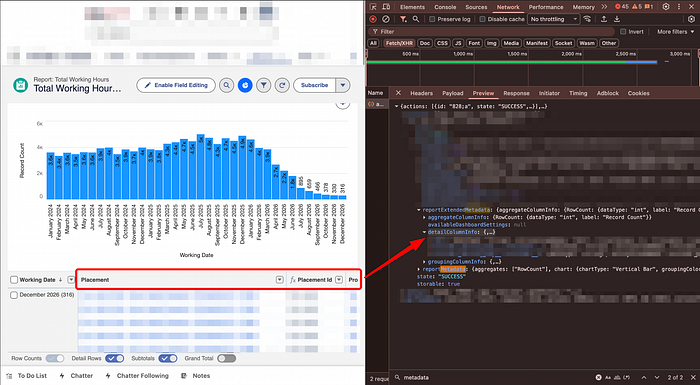
detailColumn or detailColumnInfo looking in the later will give you the exact matching when looking at the label.Custom formula field
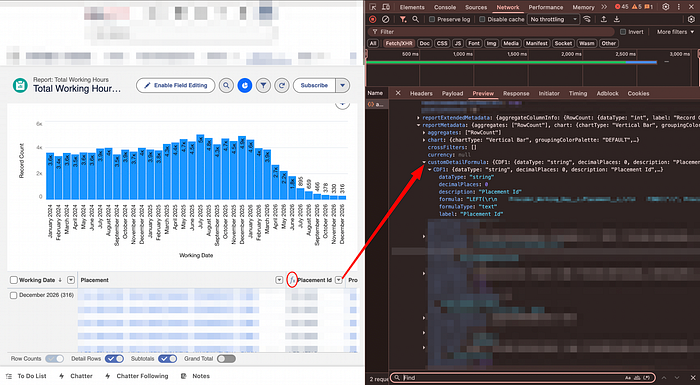
customDetailFormula and check the label for the correct name on the report.Filters
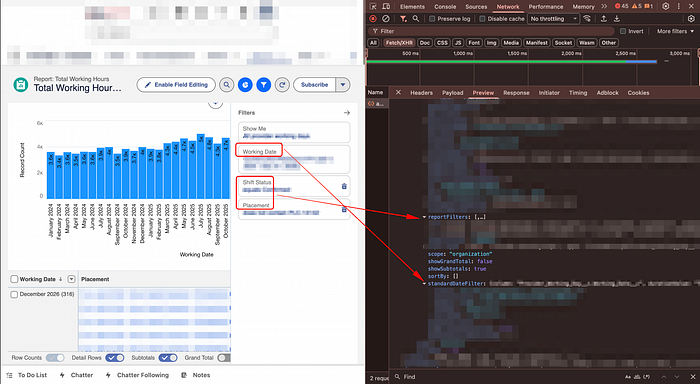
reportFilters and the standardDateFilterStep 3 — Translate to SQL
Example 1 — Simple field
Salesforce field:
# Example table and column
Table__t.Col_name__c
SQL:
select tt.col_name_c
from `{schema}.{dataset}.table_t` tt
Example 2 — Lookup / Join
Salesforce:
# Example table and column
Table__t.New_Table__t.Col_name__c
This means:
- Main table → Table__t
- Foreign key → New_Table__t
- Target column → Col_name__c
How to identify the correct join target
Salesforce doesn't explicitly show the join table name in the UI, but there are two reliable tricks:
1. Check the JSON metadata
Inside the network response, look for: lookupEntityName
2. Read the ID prefix
Every Salesforce ID starts with a 3-character object prefix:
- Example: 003XXXXXXXXXXXX
- Prefix 003 = Contact
(Use any Salesforce prefix decoder for full mapping)
If it is not in the list, most likely it is a custom object.
Two types of joins you'll encounter
- Join to another Salesforce object
Most lookups reference a standard Salesforce table such as Contact, Account, User, etc. (You'll recognize these by their Salesforce ID prefixes)
select
  tt.new_table_t as fk_id,
  c.col_name_c,
from `{schema}.{dataset}.table_t` tt
left join `{schema}.{dataset}.contact` c
  on tt.new_table_t = c.id
2) Join to a custom table
Sometimes the lookup points to another custom Salesforce object that has also been ingested into your data warehouse.
select
  tt.new_table_t as fk_id,
  ntt.col_name_c
from `{schema}.{dataset}.table_t` tt
left join `{schema}.{dataset}.new_table_t` ntt
 on tt.new_table_t = ntt.id
Example 3 — Multi-level joins
# Example table and column
Table__t.New_Table__t.Newer_Table__t.Col_name
Becomes:
select
    t.col_name_c
from `{schema}.{dataset}.table_t` tt
-- Custom object example
left join `{schema}.{dataset}.new_table_t` ntt
    on tt.new_table_t = ntt.id
-- Salesforce object example
left join `{schema}.{dataset}.team` t
    on ntt.newer_table_t = t.id
Important: exclude deleted records
Salesforce reports seem to automatically ignore deleted rows.
Your SQL should do the same:
where is_deleted = falseOtherwise counts will not match the dashboard.
Speed this up with AI 🤖
A practical workflow:
- Copy all within:
- reportMetadata
- reportExtendedMetadata
2. Paste into Gemini with:
"Convert this Salesforce report JSON into BigQuery SQL with joins and filters."
3. Validate the result against Salesforce totals.
AI won't replace understanding — but it saves hours of manual mapping.
Final thoughts
With this approach, you can reverse-engineer almost any Salesforce dashboard:
- Even with little to no documentation
- Even years after it was built
- Without admin access
The same technique can work for other web-based dashboards — if you can read the network payload, you can uncover the truth behind the chart.