

The RSI is a great indicator when used right. This article presents a timing technique to be used on the RSI to generate a few interesting signals.
The Fibonacci Trading Book is finally out! Filled with Fibonacci-based trading methods (tools, indicators, patterns, and strategies), this book will guide you through improving your trading and analysis by incorporating an important technical analysis approach that is Fibonacci [PDF Version available, see end of article).
A Gentle Introduction to the RSI
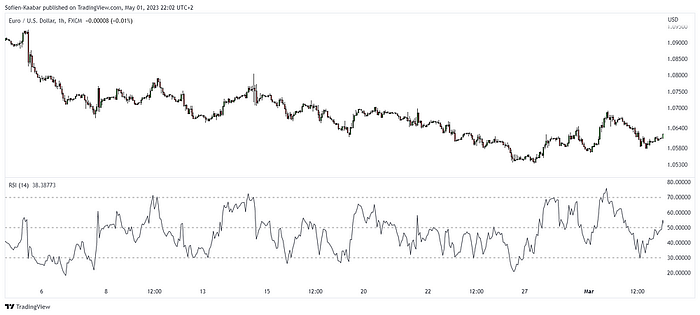
The RSI stands for Relative Strength Index, a technical analysis indicator used to measure the strength and momentum of a security, such as a stock, currency, or commodity. The RSI is calculated using mathematical formulas and plotted on a graph to visually represent the level of strength or weakness of a security over a given period.
The RSI is based on the principle that as prices rise, the security becomes overbought, and as prices fall, the security becomes oversold. The RSI helps traders to identify potential trend reversals or price corrections.
The RSI calculation involves comparing the average gain of the security over a given period to the average loss of the security over the same period. The default version of the RSI is then plotted on a scale of 0 to 100, with readings above 70 considered overbought, and readings below 30 considered oversold. The RSI is a popular indicator among traders because it can provide early warning signals of potential market trends. For example, if the RSI of a security is consistently rising and reaches a level above 70, it could indicate that the security is overbought and due for a correction. On the other hand, if the RSI is consistently falling and reaches a level below 30, it could indicate that the security is oversold and due for a bounce-back.
It's worth noting that the RSI should not be used in isolation as a sole basis for making trading decisions. Traders typically use the RSI in conjunction with other technical analysis tools and market indicators to gain a more comprehensive understanding of the market conditions and make informed trading decisions. Generally, the RSI is calculated over a rolling period of 14.
Using the RSI Timing Technique
The RSI timing technique is a countdown method used on the RSI values to predict local tops and bottoms. By local, the signals have a limited potential and are not supposed to be long-term reactions. The rules of the timing are as follows:
- A long signal is generated when the RSI shapes eight consecutive values where each value is less than the value three periods before. The last RSI must be below 30.
- A short signal is generated when the RSI shapes eight consecutive values where each value is above than the value three periods before. The last RSI must be above 70.
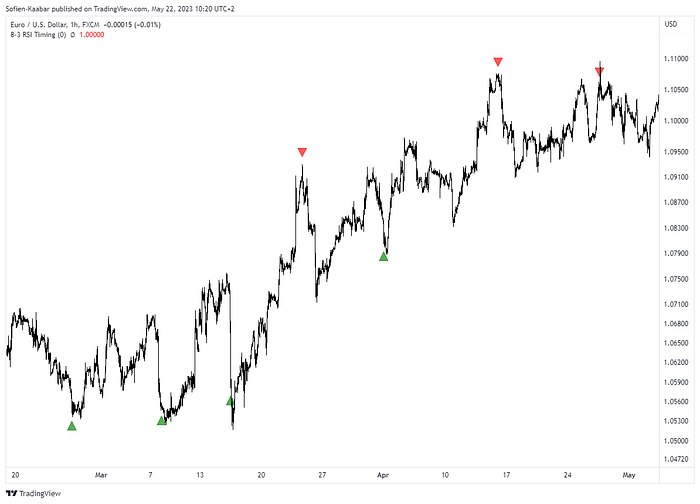
The following Figure shows a few signals generated from the RSI timing technique:
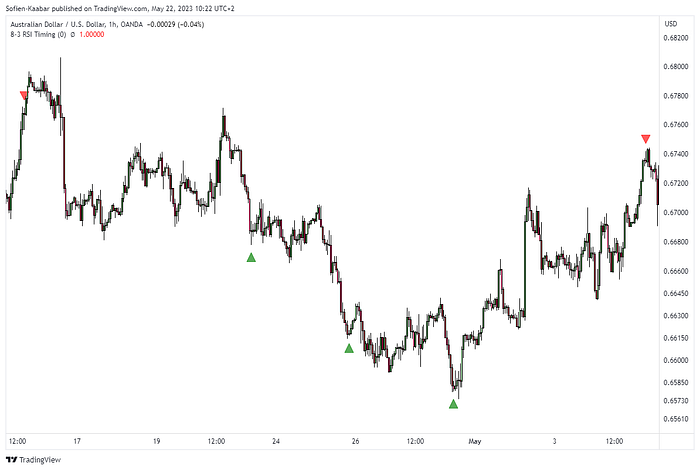
The following Figure shows a few signals generated from the RSI timing technique:
study("8-3 RSI Timing", overlay = true)

transp   = input(0)
Numbers  = input(true)
SR       = input(true)
Barcolor = input(true)

TD = rsi(close, 14) > rsi(close, 14)[3] ?nz(TD[1])+1:0
TS = rsi(close, 14) < rsi(close, 14)[3] ?nz(TS[1])+1:0

TDUp = TD - valuewhen(TD < TD[1], TD , 1 )
TDDn = TS - valuewhen(TS < TS[1], TS , 1 )

plotshape(TDDn==8 and rsi(close, 14) < 30?true:na, style = shape.triangleup,   color = green, location =  location.belowbar, size = size.small)
plotshape(TDUp==8 and rsi(close, 14) > 70?true:na, style = shape.triangledown, color = red, location =  location.abovebar, size = size.small)
The PDF link for the book is the following:
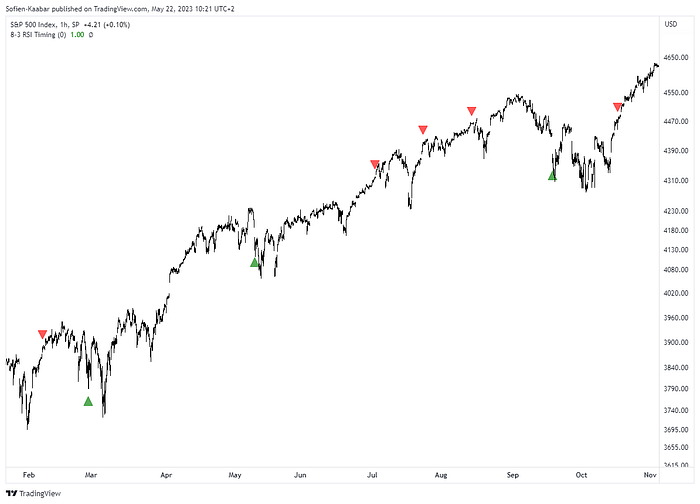
The RSI timing technique only works on ranging markets as illustrated by the following graph. Notice how the bearish signals in a bullish trend were all false. This is the importance of market regime detection.
If you want to see how to create all sorts of algorithms yourself, feel free to check out Lumiwealth. From algorithmic trading to blockchain and machine learning, they have hands-on detailed courses that I highly recommend.