

Data costs money right? Large corporate companies buy data from dedicated agencies. It can be in the form of surveys or customer feedback questionnaire. But what if you want the very same data 'for free' . Yes, you heard that right.
Social media Data Analysis is a very popular methodology that many organizations and independent personalities/ celebrities use for various decision making.
In this article, we will be seeing on how to setup twitter analysis and carry out a short analysis using some NLP techniques on Pepsi.
Initial Setup
To get started, you will need to apply for a twitter developer account to get access to the twitter API.
I highly recommend to have a separate account and login via that to apply for the same. You can choose either an individual account or if you are working as part of a team, you could choose the team account.
In the next part, you will be asked to asked to specify the use case. Make it more specific for better chances of approval.
And finally make sure to read the Developer Agreement and Policy .
Once you confirm the application, usually it takes about 24 hours to get it approved.
Assuming you got it approved, I'll proceed on to the next steps.
- Go to https://apps.twitter.com/
- Select Create New App
- Fill in the application details
- After create account, go to Keys and Access Tokens tab
- Copy the Consumer Key, Consumer Secret, Access Token, Access Token Secret into sticky notes (or wherever you wont lose it)
- And after you save, you are good to go!
Analysis
For the initial part of the analysis, we'll see on how to extract the data from the twitter account.
So in the above method, I am extracting the last 500 tweets in the page. But if you want to look at any specific day and extract X number of tweets, you can do so with the following lines of code:
search_term = "Pepsi -filter:retweets"
tweets = tw.Cursor(api.search,
                   q=search_term,
                   lang="en",
                   since='2021-02-20').items(500)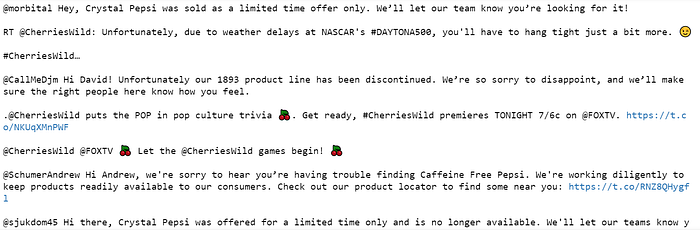
As you see, you get both the tweets and retweets and you could also filter out retweets.
The next step would be data cleansing. The tweets has a mix of punctuations, emojis, special characters and symbols which we don't require (except for #)
Now we are ready to perform analysis, here we would be looking at three kinds of analysis.
- Sentiment Analysis
- Wordcloud for positive and negative sentiments
- Popular hastags for positive and negative sentiments
Sentiment Analysis is one of the key elements of any text based research and is a huge contributor in making business decisions. To carry out Sentiment Analysis, there are a couple of ways to get it done. We could build a manual pipeline which would consist of tokenization, removing stopwords, Normalizing words and Vectorizing text. The other method which I prefer is VADER (Valence Aware Dictionary and Sentiment Reasoner). You can find more about it in this documentation. https://pypi.org/project/vaderSentiment/
The Vader Sentiments gives four types of scores, namely a positive, a negative, a neutral and a composite score. The Compound score is a metric that calculates the sum of all the lexicon ratings which have been normalized between -1(most extreme negative) and +1 (most extreme positive). Here we will be using the composite score.
Note: I have also added a google translator function. If the tweet is in english it will carry on with calculating the score, else it will translate the tweet to english and then calculate the scores.
Now I've defined certain thresholds for classifying into different sentiments. After getting the classified results, we can use a distribution plot to find the impact of the tweets.
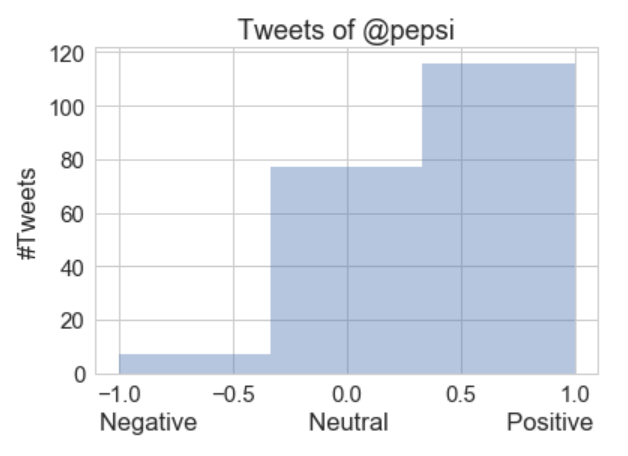
So it looks like Pepsi has a lot of good talk going on from the customer side. But let's dive a little deeper and see what the positive and negative sentiments hold.
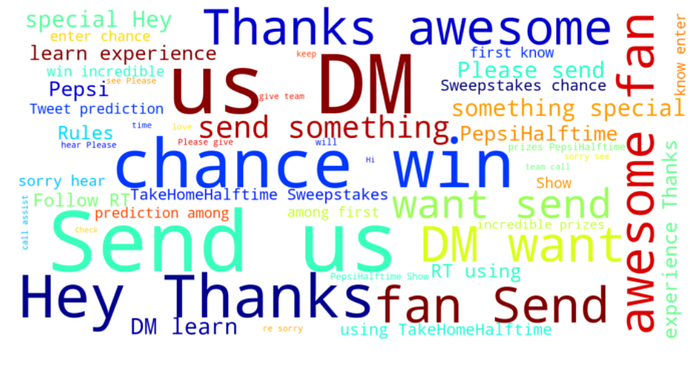
(Chance to win) : They are currently hosting a contest and we can say for sure that is has both good and positive interaction.
(Awesome Fan send DM for special) : They are sending prizes to fans which obviously has a positive impact
(Pepsi Half time) : Weeknd performing at the superbowl halftime show!
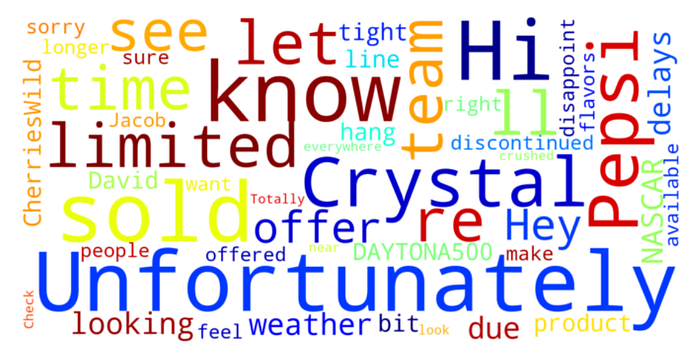
Just gonna summarize into two points. Customers were unhappy because they were not able to find caffeine free pepsi and crystal pepsi was out of stock since it was offered for a limited time. Actually this is good, because they now know that there is good demand for both.
For the final part, lets look at popular hashtags,
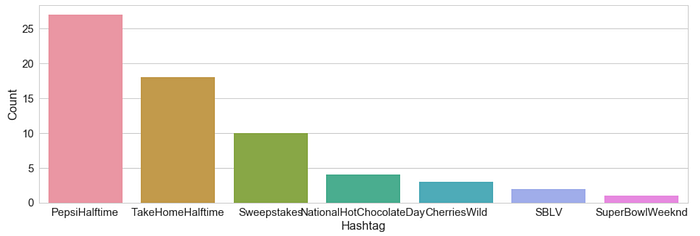

Looking at the two graphs, I'd conclude with the following statements,
People were really happy with Weeknd performing in the Pepsi Halftime for Superbowl. There were some tweets on National Hotchocolate day regarding the competition. One negative hashtag on DAYTONA500 and Cherries Wild.
Hope you enjoyed the read! As always, I am sharing the code via my github repo. Feel free to share and would really appreciate feedback to enhance my content.
You can reach me at,