What is SD-WAN and Citrix SD-WAN Orchestrator?
A software-defined wide area network (SD-WAN) is a virtual WAN architecture, in which any blend of network transport types can be virtualized and bonded within a centralised managed software, to securely connect users to applications and desktops in accordance with policy.
Citrix SD-WAN Orchestrator service is a cloud-hosted, multitenant management service available to Do-It-Yourself enterprises and Citrix Partners. Citrix partners can use to manage multiple customers with a single pane of glass, and suitable role based access controls. For Do-It-Yourself enterprises mode, an enterprise can hire their dedicated SD-WAN solution expert and take care of their virtual network set up.
So what happened in the SD-WAN reports?
One day, our Product Manager expressed a serious concern with our SDWAN reports. Customers were not happy with the way they viewed individual reports.
The portal is very sophisticated as a lot of monitoring and troubleshooting work gets executed/reviewed by the customer's administrators.
Since the tool has got tons of features, multiple reports and configuration workflows looked drastically different from one another.
Holistic view of individual reports were not maintained in a systematic manner and it was one of the critical requirements received from the customers to segregate reports against a site/region/customer.
Because of complex structure layout of reports, administrator lost track of a specific page and took delayed/wrong decision to mitigate a problem.
What was the plan then?
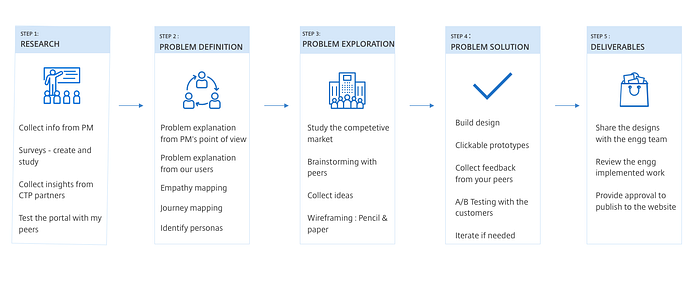
Step 1: Research
Since I was working very closely with the Product Management Team, I asked my fellow Product Manager to share any information/insights upon their conversation with the user and maintain a ticket in the JIRA tool.
Based on PM's inputs, we try to articulate few important and essential questions for our users who would help us in defining the problem in a better manner.
I shared the existing report formats with my peers (Designers, Friends, Engg) to check what they liked or disliked about the products.
Step 2: Problem Definition
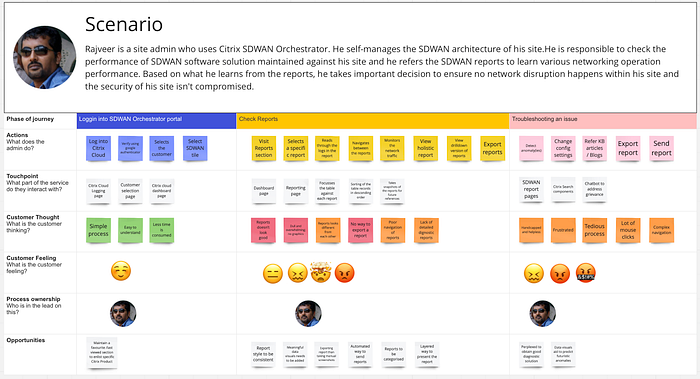
Once the PM shared his observation, I reached out and interviewed our customers who used this product on a daily basis.
Interviews provided an in-depth understanding of our user's behaviour and their daily activities.
- User Interviews
- Questionnaire
- Surveys
- Market Study
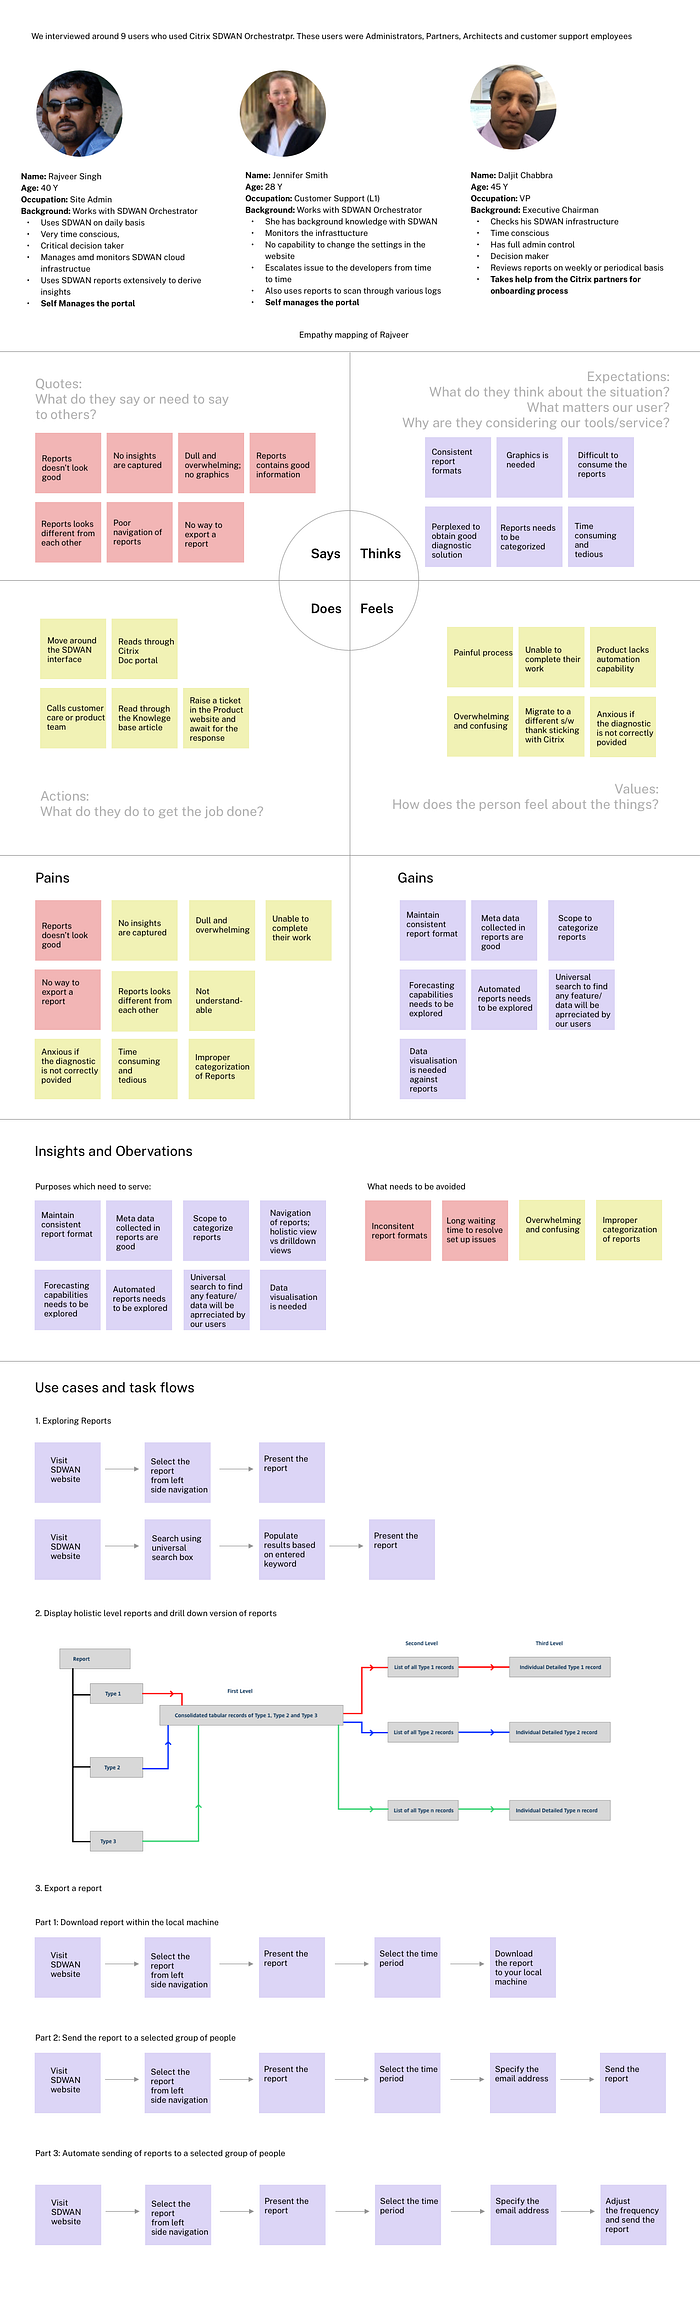
Statements made by users:

Target Audience
- Onboarding provider and tenants: Any customers can consume a managed SD-WAN service from Citrix partners, enabled by the multi-tenant Citrix SD-WAN Orchestrator service
- Onboarding "Do It Yourself" (DIY) Enterprises: Citrix SD-WAN Orchestrator service is also available as a self-managedservice for enterprises.
Observation and Findings
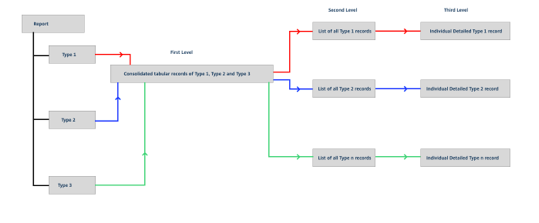
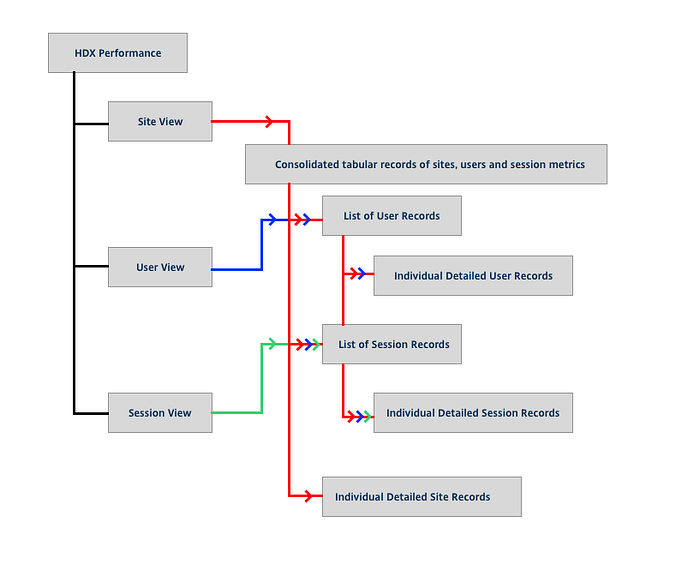
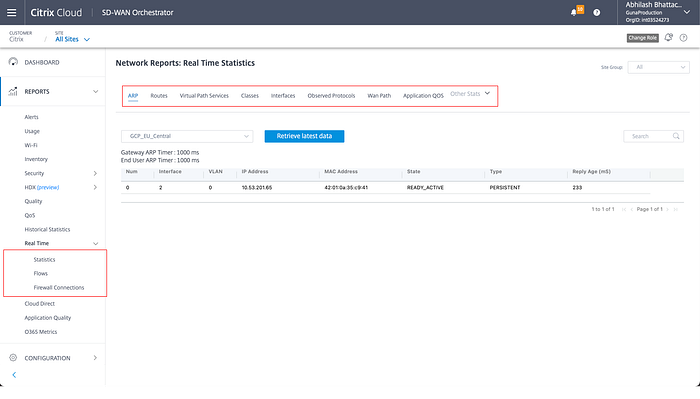
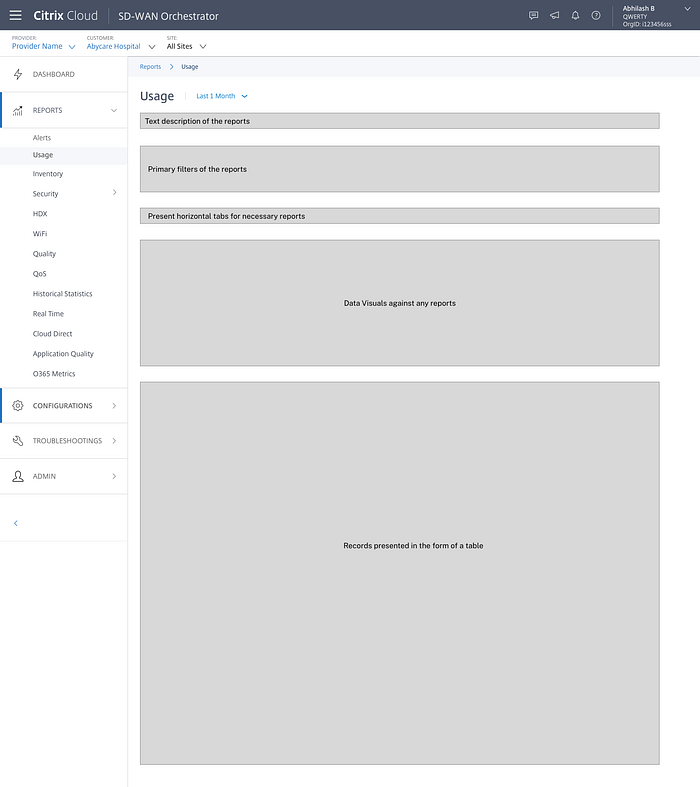
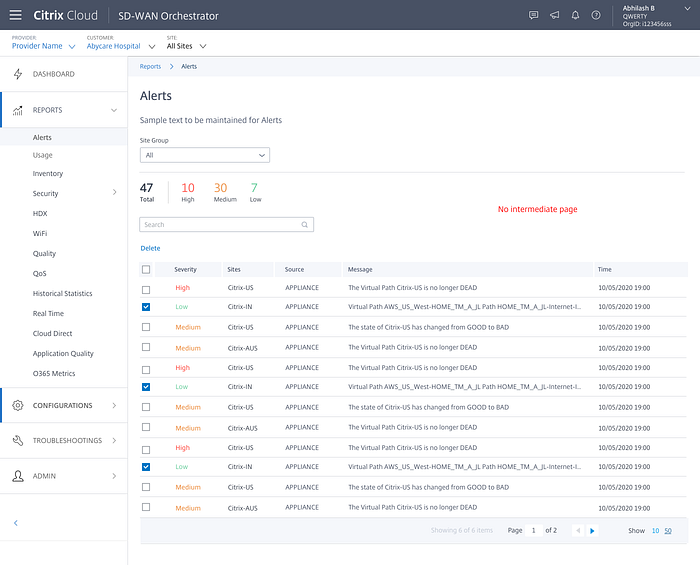
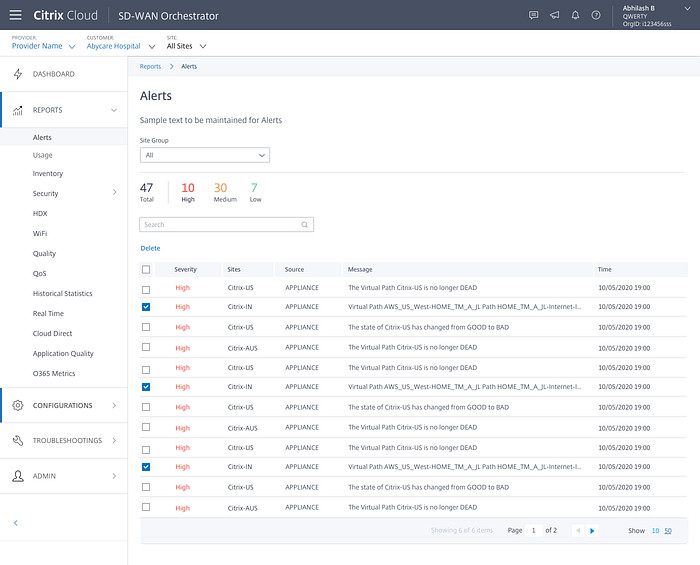
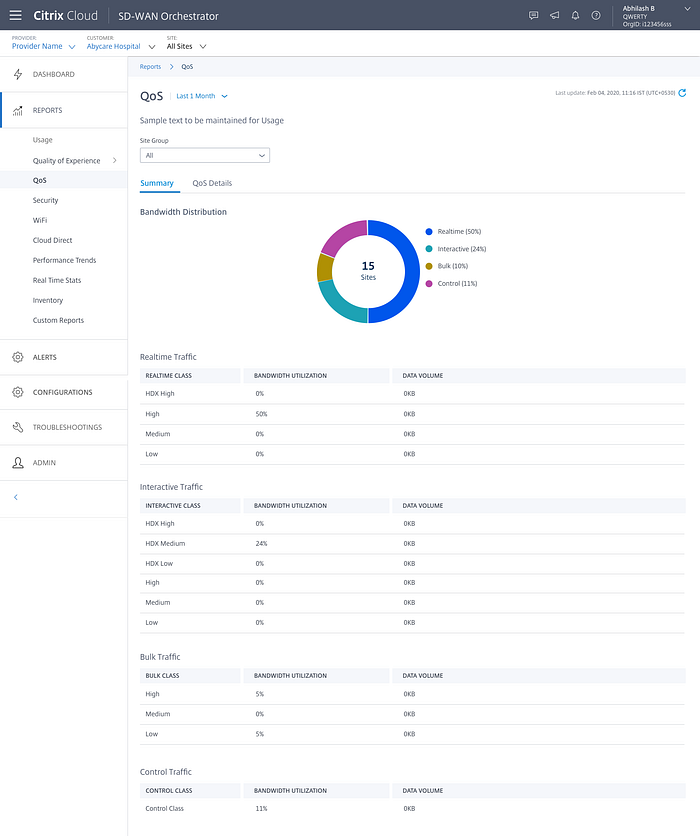
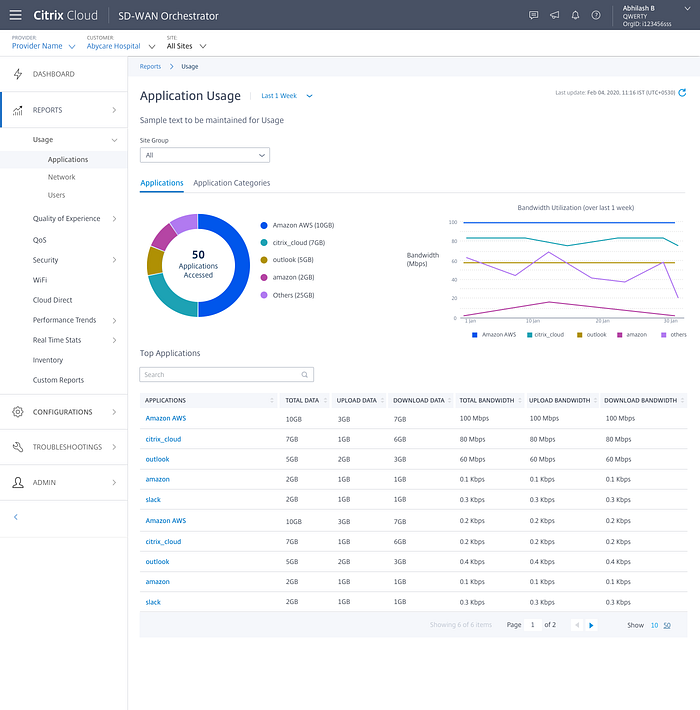
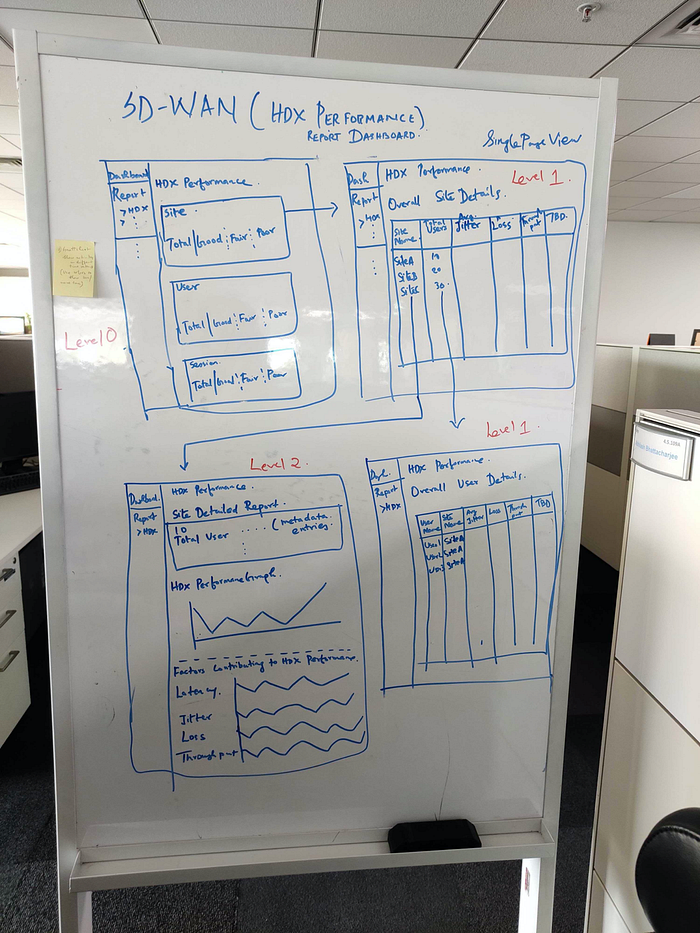
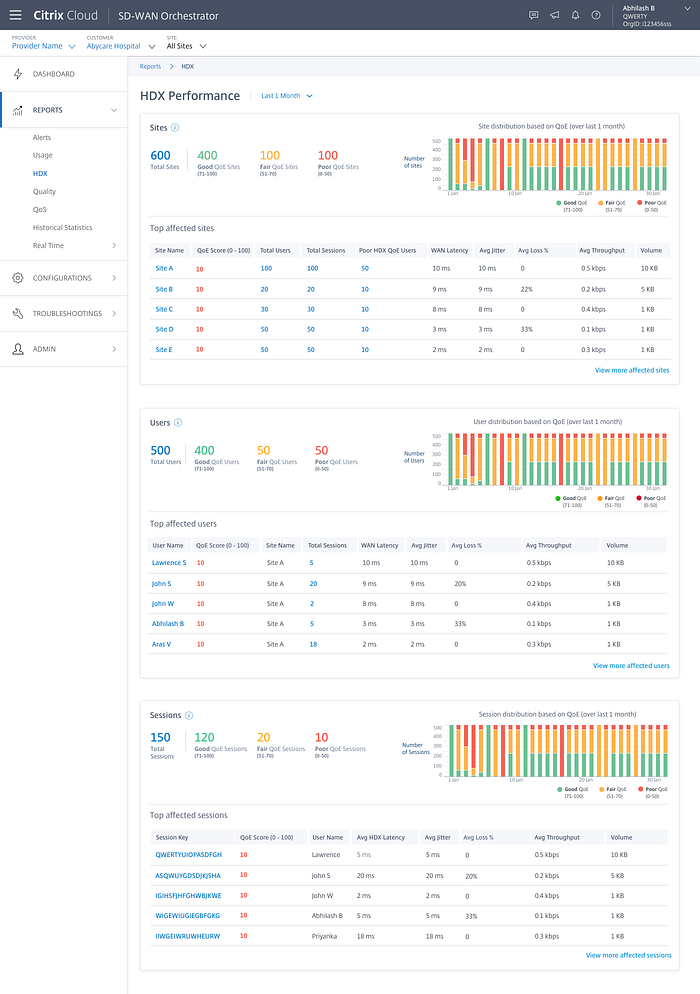
a ) Maintain a reusable skeleton report structure which can be applied across any reporting page. To acheive this, I maintained 3 primary levels against every reports:
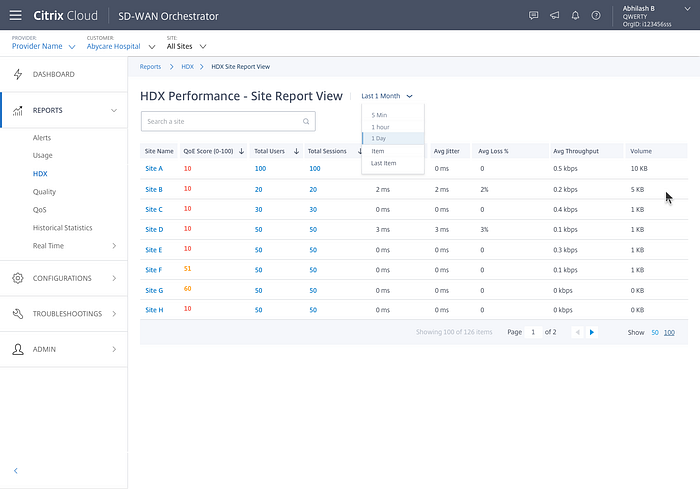
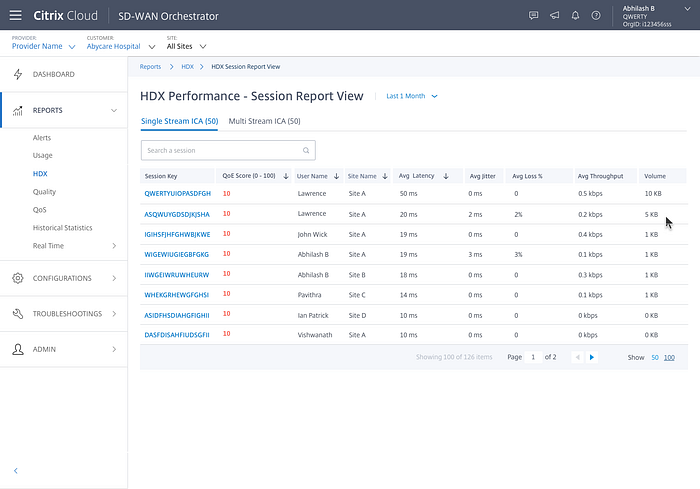
- First level view: This will provide an eagle's eye view (holistic view) against a selected report.
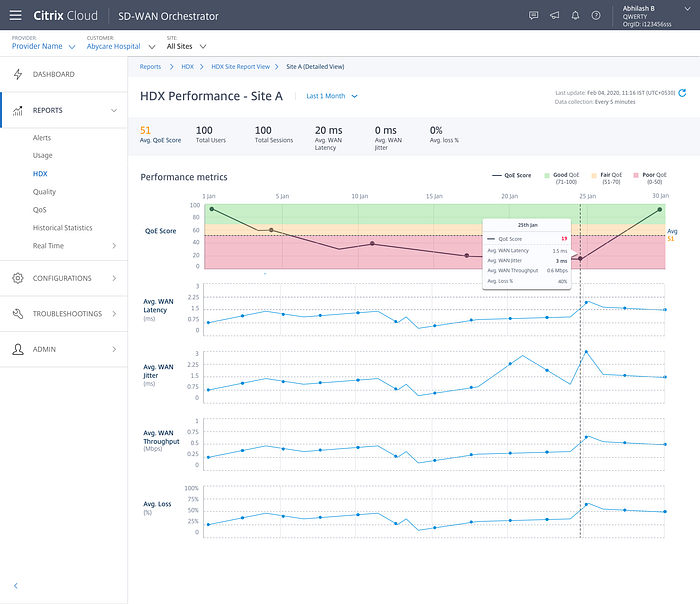
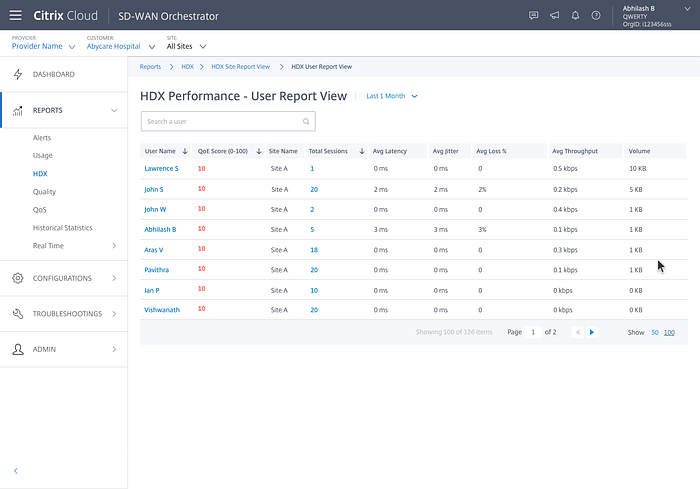
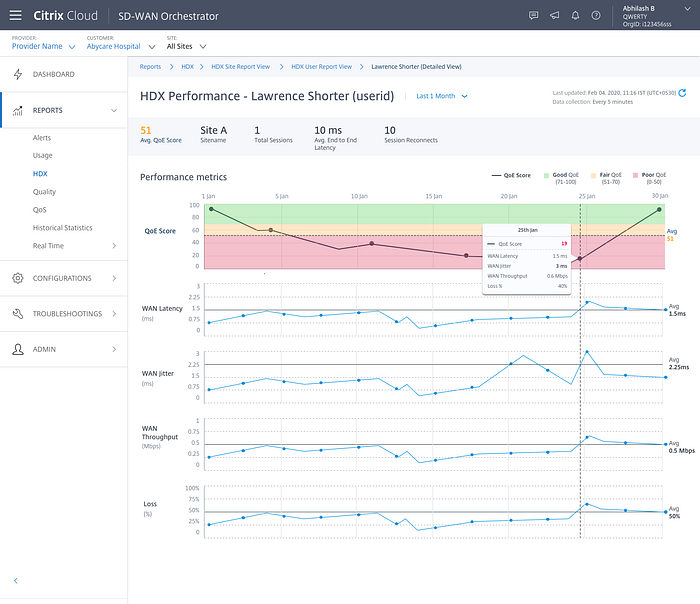
- Second level view: If a user wants to narrow down to a consolidated data view, the reports takes them to an intermediate page and present the data information in the form of a table.
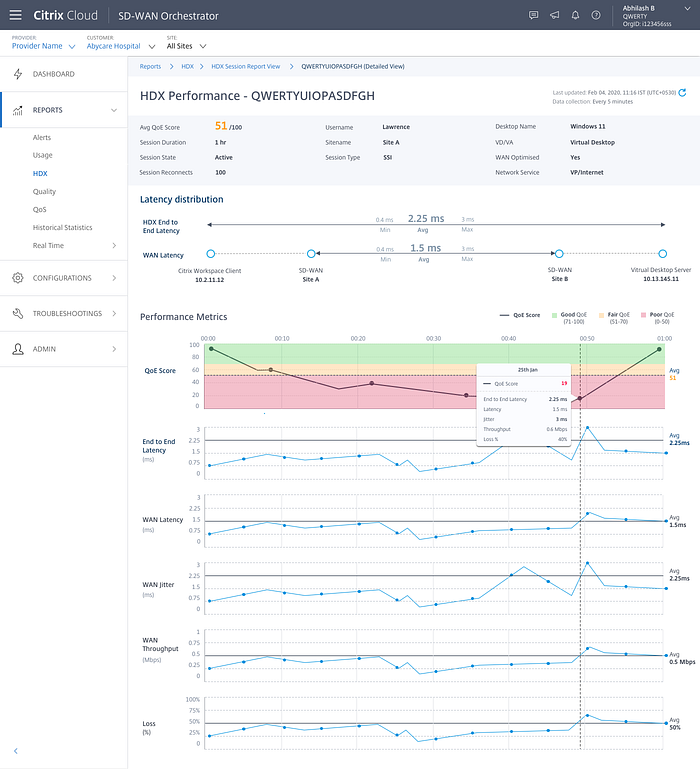
- Third level view: Upon reaching the second level view, if any user wants to drill down deeper against any particular record, the interface provides a simple mechanism to navigate them to the drill down page.
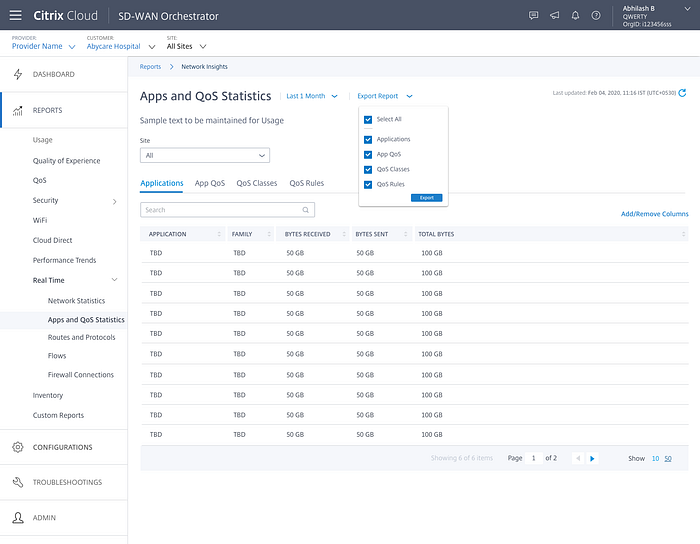
- Add suitable data visualisation against reports which would help them to take critical decisions and make needful adjustments within the infrastructure.
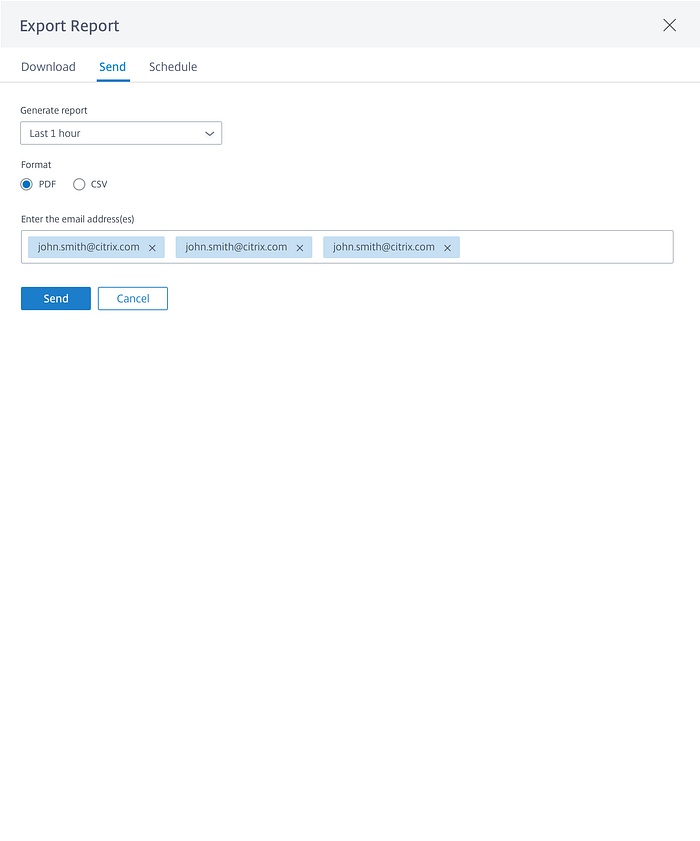
b) Report download feature to be implemented in 3 modes
- Download to local machine
- Send it to a group of users
- Send it to a group of users during frequent time intervals
c) Downloaded reports to be presented in a PDF or a CSV format
d) Universal search to be maintained to search any data/feature across all reports
Step 3: Problem Exploration
With respect to the inputs received from our customers, I shared these insights with the Product Managers and Engineering team and highlighted the key areas which need immediate improvements and where we could enhance/add new feature functionalities within the existing reports.
Build a strong base foundation for presenting any reports
I developed a reusable skeleton report structure which can be applied across any reporting page. To acheive this, I maintained 3 primary levels against every reports:
- First level view: This will provide an eagle's eye view (holistic view) against a selected report.
- Second level view: If a user wants to narrow down to a consolidated data view, the reports takes them to an intermediate page and present the data information in the form of a table.
- Third level view: Upon reaching the second level view, if any user wants to drill down deeper against any particular record, the interface provides a simple mechanism to navigate them to the drill down page.
- Add suitable data visualisation against reports which would help them to take critical decisions and make needful adjustments within the infrastructure.
Add Ons
Once the base foundation gets addressed, multiple chain of features could be designed accordingly which will provide a lot of relief to our customers.
a) Report download feature to be implemented in 3 modes
- Dowload to local machine
- Send it to a group of users
- Send it to a group of users during frequent time intervals
b) Downloaded reports to be presented in a PDF or a CSV format
c) Universal search to be maintained to search any data/feature across all reports
Brainstorming and Implementation plan
Based on the proposals provided to the team, we brainstormed multiple directions to fixed this problem and we finalised a plan.
a) Build generic report structure format
b) Download the reports and save it in local machine
c) Send the reports to a fixed number of users
d) Send automated reports based on a defined pattern
e) Build universal search (futuristic plan)
Step 4: Problem Solution
The below images are examples of inconsistent reports: looks dull, has no visual graphics, poor navigation system and lack of detailed explanation for not highlighting the root cause of the problems.

Few notable inconsistencies included:
a) Different formats of table
b) Buttons : Primary, Secondary were presented in a different manner in all these reports
c) No data visualisation were present within the report
d) Data was not sliced and diced correctly
e) Exhaustive record details
These were some of the potential factors which caused inconsistencies within the reports.
A basic skeleton format of the report structure was shared with the team to make them understand how the existing report need to evolve from its current state.
The PM and Engineering team insisted to see some actual data with the new transformation.
So based on the above structure, I was able to convert 10+ reports of SDWAN (out of 50+ reports).


The team reviewed the report format and appreciated a scalable and a consistent structure layout. Based on the teams inputs, we transformed more than 50+ reports accordingly.
Out of 50+ reports, 45% of the reports had intermediate and drill down pages.
Since most of our users expressed their interest in the export report feature, I was able to add this feature easily in the new report layout.

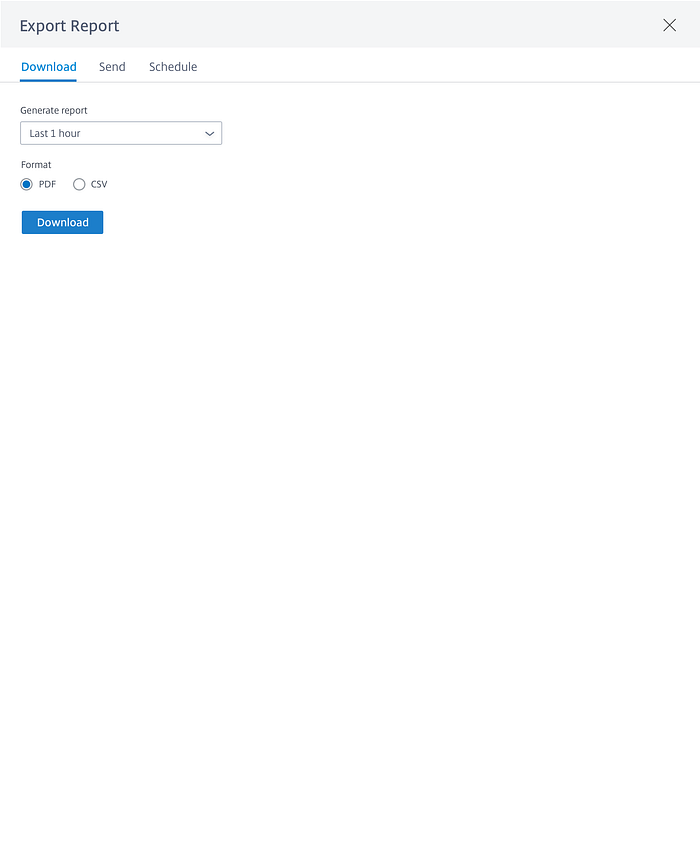

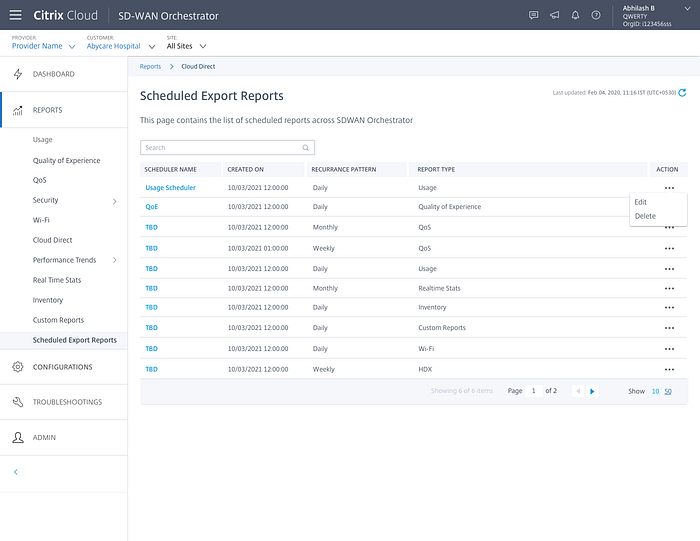
I also maintained a dedicated place to list out of all scheduled automated reports in a single page
Step 5: Design Delivery
So before handing over the designs, we shared these designs with our customers and wanted to test them. We asked them to complete few tasks:
- Check out HDX report.
- Export a HDX report.
- Point out the affected sessions causing problem to the HDX score.
- Narrow down to a session whose HDX score is severely impacted.
Both visible and invisible changes was tested with A/B testing. Examples to visible changes were the new additions to the UI, changes in the design and layout or headline messages, data visualisations, consistent report formats.
Examples to invisible changes was the page load time or testing different recommendation algorithms.
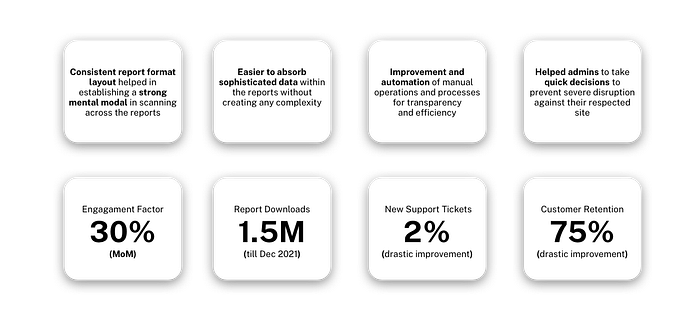
Our HDX report A/B test showed loading time of the first level page was reduced down to 100ms (earlier it was 10sec) and our user are able to make a quick decision to diagnose a problem within 1–2min (earlier it was more than 40–60min).
The user themselves started to explore the other reports without asking us and they were able to understand how the information was laid out across all the reports. Mental model was quickly established and they appreciated the simplicity and the consistency. Export feature was a much needed for them. They loved the automation concept of the export report feature.
Based on the inputs received, I shared all the design deliveries to the engineering team and they implemented them accordingly. Our engg team conducted review sessions and asked us to review their implemented work before it was pushed to the production environment. I provided my inputs accordingly and the engg team was able to migrate 50+ reports in a span of 1.5 months.
Key Contribution