In today's world of distributed systems, log management is crucial for monitoring and troubleshooting. The ELK stack (Elasticsearch, Logstash, and Kibana) combined with Filebeat provides an efficient way to collect, filter, store, and visualize logs.
This guide walks you through setting up Filebeat, Logstash, and Elasticsearch in a Dockerized environment to streamline log management.
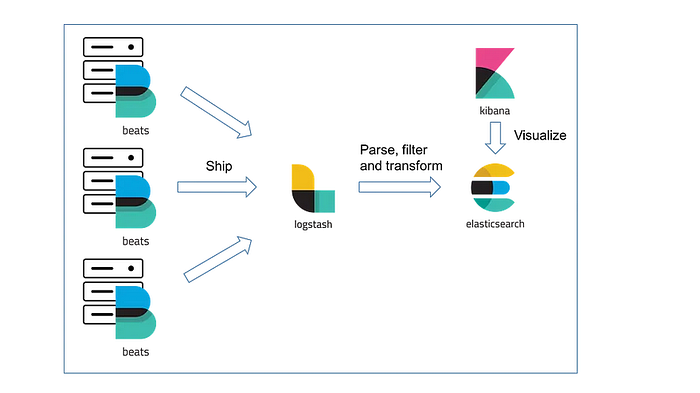
ELK Stack Architecture
Here's how the different components interact:
- Filebeat: Collects logs from various sources(containers).
- Logstash: Processes and transforms logs before forwarding them.
- Elasticsearch: Stores and indexes logs for efficient searching.
- Kibana: Provides visualization and analytics for logs.
Step 1: Deploying Filebeat in a Docker Container
To start, deploy Filebeat in a container with the appropriate volume mounts:
docker run -d — name filebeat-container \ — user=root \ — volume /path/to/logs/mongo:/mnt/logs/mongo:ro \ — volume /path/to/filebeat.yml:/usr/share/filebeat/filebeat.yml:ro \ — volume /var/lib/docker/containers:/var/lib/docker/containers:ro \ — network host \ docker.elastic.co/beats/filebeat:8.3.2 \ filebeat -e -strict.perms=false
Step 2: Configuring Filebeat
Create a filebeat.yml configuration file with the following settings:
filebeat.inputs: — type: log enabled: true paths: — /var/lib/docker/containers/*/*.log # (logs are extracted from this path) — /mnt/logs/mongo/*.log — /mnt/logs/*.log
output.logstash: hosts: ["<logstash-ip>:5044"]
This configuration: ✅ Enables log collection from Docker containers and mounted directories. ✅ Forwards logs to Logstash running on port 5044.
Step 3: Validating Filebeat Configuration
After setting up Filebeat, test the configuration with:
sudo docker exec -it filebeat filebeat test config
If you encounter a permission error:
sudo chown root filebeat.yml
sudo chmod go-w filebeat.yml
Once permissions are fixed, test the connection to Logstash:
sudo docker exec -it filebeat filebeat test output
Expected output:
logstash: <logstash-ip>:5044… connection… OK TLS… WARN secure connection disabled talk to server… OK
Step 4: Setting Up Logstash
Logstash processes logs and sends them to Elasticsearch. Configure logstash.conf:
Find this logstash file in pipeline directory
input { beats { port => 5044 } }
filter { }
output { elasticsearch { hosts => ["<elasticsearch-ip>:9200"] index => "filebeat" } }
This configuration:
✅ Accepts logs from Filebeat on port 5044. ✅ Sends logs to Elasticsearch at port 9200 under the index filebeat.
Step 5: Verify Logstash and Elasticsearch Integration
After setting up Logstash, check if logs are being indexed:
- Open Kibana and navigate to Index Management.
- Look for the newly created index: filebeat.
🎉 Congratulations! You have successfully set up an ELK stack with Filebeat for log collection.