

This strategy uses three indicators, namely the Exponential Moving Average (EMA) with 28 and 48 periods, and the Stochastic Relative Strength Index (Stoch RSI). In this article, we will discuss the EMA28-EMA48-Stoch RSI trading strategy and explain the indicators used in this strategy.
EMA28-EMA48-Stoch RSI Trading Strategy:
The EMA28-EMA48-Stoch RSI trading strategy is a simple yet effective trading strategy that can be used in both bull and bear markets. This strategy uses three indicators to identify buying and selling opportunities in the market. The first two indicators used in this strategy are the Exponential Moving Average (EMA) with 28 and 48 periods. These moving averages are calculated based on the closing price of the asset, and they help in identifying the trend in the market.
df['EMA5']=((ta.trend.ema_indicator(close=df['close'], window=28,fillna= True)) )
df['EMA6']=((ta.trend.ema_indicator(close=df['close'], window=48,fillna= True)) )
When the EMA28 is above the EMA48, it indicates a bullish trend, and when the EMA28 is below the EMA48, it indicates a bearish trend. The third indicator used in this strategy is the Stochastic Relative Strength Index (Stoch RSI), which helps in identifying oversold and overbought conditions in the market. The Stoch RSI oscillates between 0 and 1 and indicates the momentum of the asset.
When the Stoch RSI is below 0.2, it indicates an oversold condition, and when it is above 0.8, it indicates an overbought condition. Traders can use these three indicators to identify buying and selling opportunities in the market. The strategy is simple: buy when the EMA28 is above the EMA48, and the Stoch RSI is below 0.8, and sell when the EMA28 is below the EMA48, and the Stoch RSI is above 0.2.
Let's make a backtest with ETHUSDT now in 1h timeframe in FUTURE :
Here is an example implementation of the strategy:
signals.append(0)
for i in range(1, len(df)-1):
# Your trading strategy goes here
if df.iloc[i]['STORSI'] > 0.2 and df.iloc[i]['EMA5'] > df.iloc[i]['EMA6']:
signals.append(1)
elif df.iloc[i]['STORSI'] < 0.8 and df.iloc[i]['EMA6'] > df.iloc[i]['EMA5'] :
signals.append(-1)
else :
signals.append(0)
signals.append(0)
df["signal"] = signals
print(signals)
investment = 1000
current_investment = 1000
invested_amount = 0
fees = 0
profit = 0
is_invested = 0
best_trade = -99999999
worst_trade = 99999999
largest_loss = 0
largest_gain = 0
total_trades = 0
for i in range(500, len(df)):
signal = df.iloc[i]['signal']
close = df.iloc[i]['close']
if signal == 1 and is_invested == 0: # Long signal and no position
entry_point = close
quantity = (current_investment / close)
invested_amount = quantity * close
is_invested = 1
elif signal == -1 and is_invested == 0: # Short signal and no position
entry_point = close
quantity = (current_investment / close)
invested_amount = quantity * close
is_invested = -1
elif signal == -1 and is_invested == 1 : # Close long position for short signal
profit = quantity * (- entry_point + close)
current_investment += profit
invested_amount = 0
total_trades += 1
if profit > largest_gain:
largest_gain = profit
if profit < largest_loss:
largest_loss = profit
if profit > best_trade:
best_trade = profit
if profit < worst_trade:
worst_trade = profit
entry_point = close
quantity = (current_investment / close)
invested_amount = quantity * close
is_invested = -1
elif signal == 1 and is_invested == -1: # Close short position for long signal
profit = quantity * ( - close + entry_point)
current_investment += profit
invested_amount = 0
total_trades += 1
if profit > largest_gain:
largest_gain = profit
if profit < largest_loss:
largest_loss = profit
if profit > best_trade:
best_trade = profit
if profit < worst_trade:
worst_trade = profit
entry_point = close
quantity = (current_investment / close)
invested_amount = quantity * close
is_invested = 1
else:
pass
final_profit = current_investment - investment
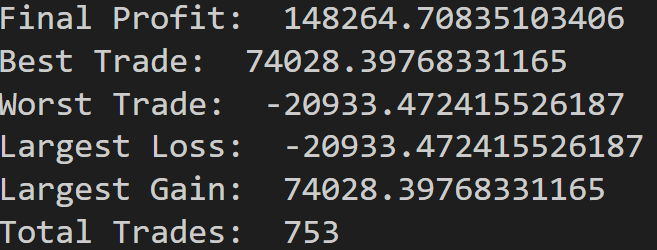
print("Final Profit: ", final_profit)
print("Best Trade: ", best_trade)
print("Worst Trade: ", worst_trade)
print("Largest Loss: ", largest_loss)
print("Largest Gain: ", largest_gain)
print("Total Trades: ", total_trades)Here is a complete backtest with ETH-USD in the last 2000 days, TFrame:1H
The EMA28-EMA48-Stoch RSI trading strategy is a simple yet effective trading strategy that can be used in both bull and bear markets.