
Let's be completely honest here!!!
Even for experienced data analysts and scientists, data science can feel like a jungle of acronyms, complex formulas and weird named techniques, i.e. "The Kolmogorov-Smirnov test" which often times don't mean much to your average Joe.
Terms such as standard deviation, regression, and empirical cumulative distribution function or "ECDF" for short (whew, that's a mouthful!) can make even the most curious mind want to give up and just roll back into bed and maybe change fields.
But you're not alone — I'm here to untangle and unpack difficult concepts and big-sounding ideas in such a way that (hopefully) even your grandma will understand….so lets begin Data Science without the GOBBLEDYGOOK!
Let's talk about ECDF!
Let's talk about ECDF — Empirical Cumulative Distribution Function — without any math headaches, I promise.
So what is an ECDF? — I hear you asking
Imagine you're a teacher, and you're teaching a class of 25 noisy, annoying and naughty kids.
The kids parents want to understand the overall picture of their heights. Are most of them short? Are they tall? Is there a mix? Is there anyone way taller than the rest? Are any of them A league basketball players?
To figure that out, you do something simple and intuitive — You line all of them up from the shortest to the tallest — right?
Now what's next?
Say you are interested in how much towering the 10th kid is, you then would walk up to the 10th kid in line and ask:
"How many kids are shorter than or just as tall as you?"
Then you count….or get the kids to count….which would keep them occupied.
Let's say 10 out of 25 kids are that height or shorter.
That means 40% of the class is at or below that height.
That's basically the key of what an ECDF tells you:
"What fraction of the data lies below or at this value?"
Let's repeat that idea in a few different ways to help it stick:
For any number in your dataset (like a child's height), the ECDF tells you how many values are smaller or equal.
The chart is built step-by-step as more data gets added — just like lining up kids.
An ECDF chart would accumulates/build because each new height adds on top of the last.
Let's See It with Numbers — An Example!
Imagine these are the 25 sorted heights in cm:
[98, 100, 102, 104, 106, 108, 110, 112, 114, 116,
118, 120, 122, 124, 126, 128, 130, 132, 134, 136,
138, 140, 142, 144, 146]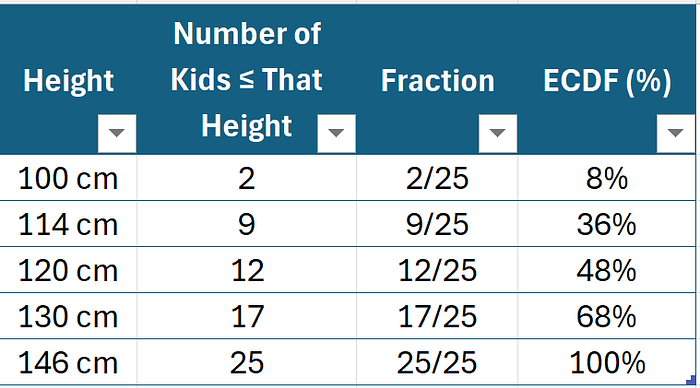
So at 130 cm, 68% of the class is at or below that height….so unfortunately none of them are A league basketball players.
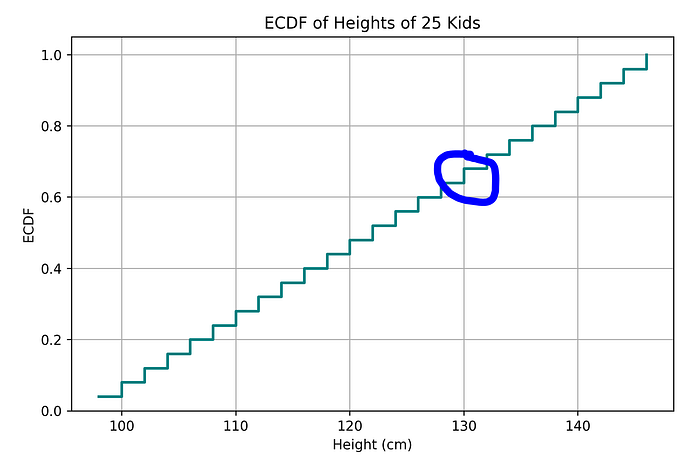
So what does this ECDF look like?
As you can see visually, 130 cm is roughly at the 68% mark.
Why This Matters (Even Outside the Classroom) — Why Should I Care?
You'll find ECDFs helpful in many real-world cases, such as:
Sales: What % of customers spend less than $100?
Healthcare: What % of patients recover within 5 days?
Sports: What % of runners finish a race under 1 hour?
OR EVEN GAMING……
Let's say you're analysing your teammates performance data in Call of Duty: Modern Warfare. You've got stats on how long it takes each friend to get their first kill in a multiplayer match — measured in seconds.
Now you ask:
"What percentage of my friends get their first kill within X seconds?"
This is a perfect job for an ECDF.
The ECDF lets you see how your data builds up, step by step, without making any guesses about its shape or assumptions about its behavior. It's raw, real, and simple.
The ECDF Takeaway
ECDF is just a fancy name for a very human question:
"How much of my data is less than or equal to this point?"
And that's why lining up kids by height or measuring first kills in Modern Warfare are perfect, intuitive way to understand it.
You don't need to be a statistician to use ECDF. If you can line people up and count, you already get the concept.
Thank you for reading take on ECDF, please comment to let me know what your thoughts are? Where have you applied this? What are some comparable approaches?
Did you enjoy this content and want to see more?
- 👏 Clap this story if you liked it!
- 👏 Comment and highlight to provide feedback!
- ☕ Support me by buying me a coffee