
1. Introduction
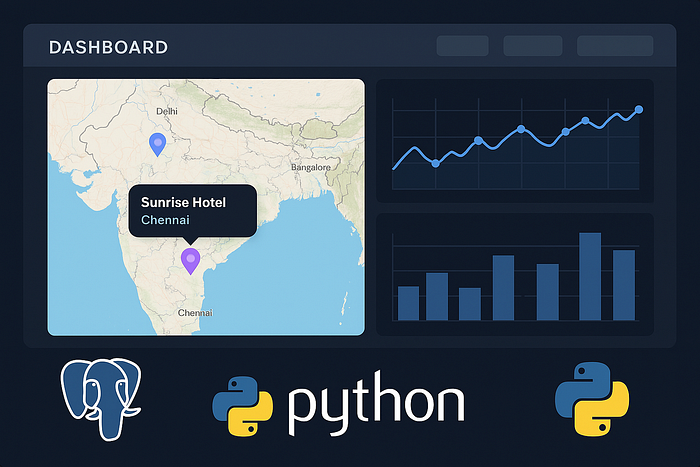
Real-time analytics is crucial in industries such as hospitality, retail, and finance. For hotels specifically, being able to quickly visualize data such as occupancy rates, branch performance, and location insights helps management make informed decisions rapidly.
In this guide, I'll walk you step-by-step through connecting your existing PostgreSQL database to Python, handling common database connection errors gracefully, dynamically querying your database securely, and visualizing your data interactively using Python — without relying on Google Maps.
2. Connecting Python to PostgreSQL
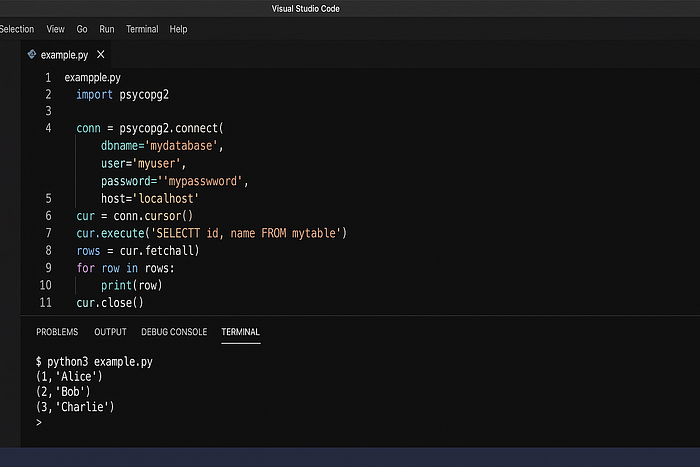
To interact with a PostgreSQL database from Python, we'll use the popular psycopg2 library, known for its stability and ease of use.
First, ensure you've installed psycopg2:
pip install psycopg2
import psycopg2

# Connect securely using psycopg2
conn = psycopg2.connect(
    host="your-db-hostname",
    database="hotel_db",
    user="your-username",
    password="your-password"
)

cur = conn.cursor()
cur.execute("SELECT branch_name, city, state FROM branches LIMIT 5;")
rows = cur.fetchall()

for row in rows:
    print(row)

cur.close()
conn.close()
Always store your credentials securely — never hard-code passwords!
3. Robust Error Handling for Database Connections
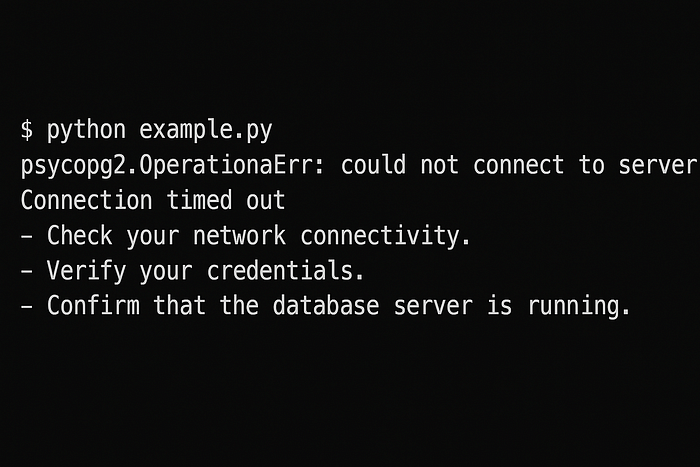
Even with a straightforward connection setup, issues like network failures, incorrect credentials, or database downtime can occur. Handling these errors gracefully is essential for building robust applications.
Here's how you can handle common connection errors:
import psycopg2

try:
    conn = psycopg2.connect(
        host="your-db-hostname",
        database="hotel_db",
        user="your-username",
        password="your-password",
        connect_timeout=10
    )
    print("Database connection successful!")
except psycopg2.OperationalError as e:
    print(f"Database connection failed: {e}")
    # Suggest user-friendly solutions or fallback strategies
This snippet catches operational errors (like network or authentication problems) and provides clear feedback. Always communicate clearly with your end users if something goes wrong.
Database down? Let your users know clearly and helpfully.
4. Dynamic and Secure SQL Query Building
When your app needs to query data based on user inputs (like filtering hotels by city, state, or amenities), you'll need to dynamically build queries. However, directly inserting user input into SQL queries risks SQL injection attacks. Here's how you securely construct queries using parameterized inputs:
filters = {'city': 'Bangalore', 'has_pool': True}
conditions = []
params = []

for key, value in filters.items():
    conditions.append(f"{key} = %s")
    params.append(value)

where_clause = " AND ".join(conditions)

query = f"SELECT branch_name, address FROM branches WHERE {where_clause};"
cur.execute(query, params)
results = cur.fetchall()

for result in results:
    print(result)
Using parameterized queries ensures your application stays secure from malicious inputs.
Never concatenate inputs directly into queries — stay safe from SQL injection!

5. Visualizing Your Data: Interactive Tables and Maps
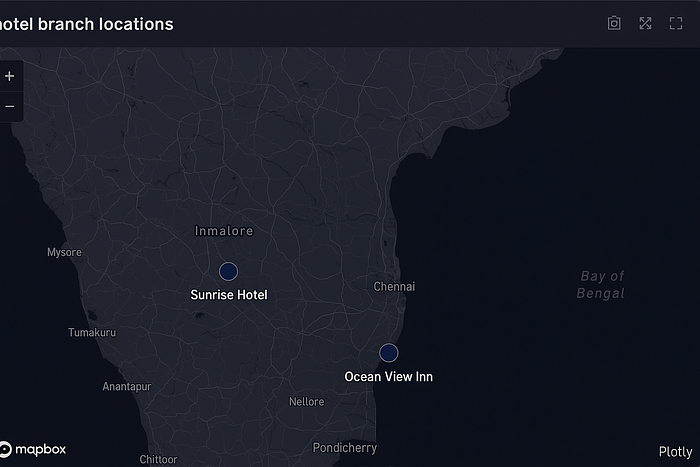
Interactive visualizations significantly enhance your data insights. We'll use Plotly Express, a powerful and user-friendly library for creating interactive tables and maps.
Install Plotly Express with:
pip install plotly pandasHere's how to create an interactive map with your hotel data:
import pandas as pd
import plotly.express as px

# Sample data fetched from PostgreSQL
df = pd.DataFrame({
    'branch_name': ['Sunrise Hotel', 'Ocean View Inn'],
    'latitude': [12.9352, 13.0827],
    'longitude': [77.6245, 80.2707],
    'city': ['Bangalore', 'Chennai']
})

fig = px.scatter_mapbox(
    df, lat='latitude', lon='longitude',
    hover_name='branch_name', hover_data=['city'],
    zoom=5, height=400
)

fig.update_layout(mapbox_style='open-street-map')
fig.show()
This approach allows you to generate beautiful, interactive maps without using Google Maps.
Beautiful maps without breaking the bank — thanks to OpenStreetMap!
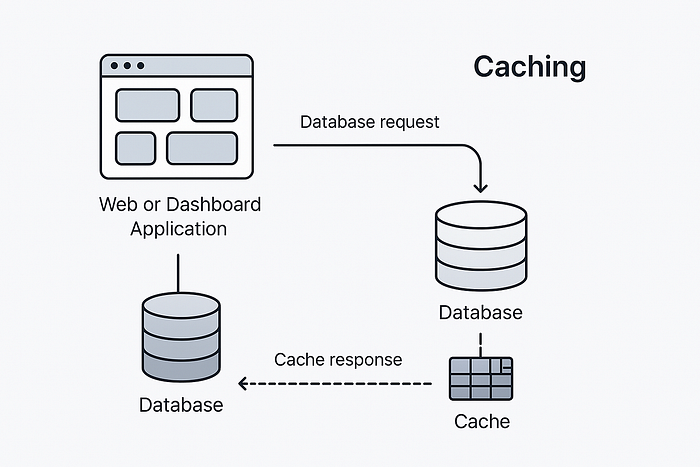
6. Optimizing Performance with Caching
Performance is critical for real-time dashboards. Implementing caching can significantly speed up repeated queries and enhance user experience. If you're using Streamlit, caching queries is straightforward:
import streamlit as st

@st.cache_data(ttl=3600)  # Cache for 1 hour
def get_hotel_data(city):
    cur.execute("SELECT * FROM branches WHERE city = %s;", (city,))
    return cur.fetchall()
Caching reduces the load on your database and speeds up your dashboard.
Speed matters — cache your data for lightning-fast performance.
7. Best Practices for a Reliable, Scalable Dashboard
Building a reliable, scalable dashboard involves careful consideration of security, performance, and user experience. Here are key practices to follow:
- Securely manage your database credentials using environment variables.
- Use caching mechanisms to improve response times and reduce server load.
- Regularly test your application under different scenarios and loads.
- Clearly handle errors with helpful user messages and logging for easier debugging.
- Ensure data security by using parameterized queries to prevent SQL injection attacks.
Robust, scalable, secure — your dashboard checklist for success.
8. Conclusion and Next Steps
Congratulations on creating a robust, real-time dashboard for your hotel data! You've connected Python securely to your PostgreSQL database, handled errors gracefully, built dynamic queries safely, and visualized your data interactively.
Continue exploring advanced visualization techniques, performance optimization strategies, and security best practices. Share your dashboards with your team and keep refining based on feedback.
Enjoyed the guide? Follow me for more insights, connect on Medium, and share your dashboards!