
Logstash is a free and open server-side data processing pipeline that ingests data from a multitude of sources, transforms it, and then sends it to your favorite "stash."
Logstash dynamically ingests, transforms, and ships your data regardless of format or complexity. Derive structure from unstructured data with grok, decipher geo coordinates from IP addresses, anonymize or exclude sensitive fields, and ease overall processing.
Logstash has a pluggable framework featuring over 200 plugins. Mix, match, and orchestrate different inputs, filters, and outputs to work in pipeline harmony.
Online Logstash Installation
Download and install the Public Signing Key:
elastic1@elastic1:~$ wget -qO - https://artifacts.elastic.co/GPG-KEY-elasticsearch | sudo apt-key add -You may need to install the apt-transport-https package on Debian before proceeding:
elastic1@elastic1:~$ sudo apt-get install apt-transport-httpsSave the repository definition to /etc/apt/sources.list.d/elastic-8.x.list:
elastic1@elastic1:~$ echo "deb https://artifacts.elastic.co/packages/8.x/apt stable main" | sudo tee -a /etc/apt/sources.list.d/elastic-8.x.listRun sudo apt-get update and the repository is ready for use. You can install it with:
elastic1@elastic1:~$ sudo apt-get update && sudo apt-get install logstashAfter installing the package, you can start up Logstash with:
elastic1@elastic1:~$ sudo systemctl start logstash.serviceTo test your Logstash installation, run the most basic Logstash pipeline. Now, paste hakan into your terminal and press Enter so it will be processed by the stdin input:
elastic1@elastic1:~$  /usr/share/logstash/bin/logstash -e 'input { stdin { } } output { stdout {} }'
Using bundled JDK: /usr/share/logstash/jdk
OpenJDK 64-Bit Server VM warning: Option UseConcMarkSweepGC was deprecated in version 9.0 and will likely be removed in a future release.
hakan
{
         "event" => {
        "original" => "hakan"
    },
       "message" => "hakan",
          "host" => {
        "hostname" => "elastic1"
    },
      "@version" => "1",
    "@timestamp" => 2022-07-25T20:00:35.816703Z
}
Offline Logstash Installation
Download logstash against your operating system. Mine is ubuntu so I will download logstash-8.3.2-amd64.deb. After download drag and drop it in your ubuntu system. Then run this command.
elastic1@elastic1:~$ sudo dpkg -i logstash-8.3.2-amd64.deb
Selecting previously unselected package logstash.
(Reading database ... 162940 files and directories currently installed.)
Preparing to unpack logstash-8.3.2-amd64.deb ...
Unpacking logstash (1:8.3.2-1) ...
Setting up logstash (1:8.3.2-1) ...
After installing the package, you can start up Logstash with:
sudo systemctl start logstash.serviceTo test your Logstash installation, run the most basic Logstash pipeline. Now, paste hakan into your terminal and press Enter so it will be processed by the stdin input:
elastic1@elastic1:~$  /usr/share/logstash/bin/logstash -e 'input { stdin { } } output { stdout {} }'
Using bundled JDK: /usr/share/logstash/jdk
OpenJDK 64-Bit Server VM warning: Option UseConcMarkSweepGC was deprecated in version 9.0 and will likely be removed in a future release.
hakan
{
         "event" => {
        "original" => "hakan"
    },
       "message" => "hakan",
          "host" => {
        "hostname" => "elastic1"
    },
      "@version" => "1",
    "@timestamp" => 2022-07-25T20:00:35.816703Z
}
Send Data to Elasticsearch without Security
Filters are an in-line processing mechanism that provide the flexibility to slice and dice your data to fit your needs.
Create logstash-filter.conf file using below command .
elastic1@elastic1:/usr/share/logstash$ sudo nano logstash-filter.confLet's take a look at some filters in action. The following configuration file sets up the grok and date filters.
input { stdin { } }
filter {
  grok {
    match => { "message" => "%{COMBINEDAPACHELOG}" }
  }
  date {
    match => [ "timestamp" , "dd/MMM/yyyy:HH:mm:ss Z" ]
  }
}
output {
  elasticsearch { hosts => ["localhost:9200"] }
  stdout { codec => rubydebug }
}
Run Logstash with this configuration:
elastic1@elastic1:/usr/share/logstash$ bin/logstash -f logstash-filter.confNow, paste the following line into your terminal and press Enter so it will be processed by the stdin input:
127.0.0.1 - - [11/Dec/2013:00:01:45 -0800] "GET /xampp/status.php HTTP/1.1" 200 3891 "http://cadenza/xampp/navi.php" "Mozilla/5.0 (Macintosh; Intel Mac OS X 10.9; rv:25.0) Gecko/20100101 Firefox/25.0"You should see something returned to stdout that looks like this:
{
        "message" => "127.0.0.1 - - [11/Dec/2013:00:01:45 -0800] \"GET /xampp/status.php HTTP/1.1\" 200 3891 \"http://cadenza/xampp/navi.php\" \"Mozilla/5.0 (Macintosh; Intel Mac OS X 10.9; rv:25.0) Gecko/20100101 Firefox/25.0\"",
     "@timestamp" => "2013-12-11T08:01:45.000Z",
       "@version" => "1",
           "host" => "cadenza",
       "clientip" => "127.0.0.1",
          "ident" => "-",
           "auth" => "-",
      "timestamp" => "11/Dec/2013:00:01:45 -0800",
           "verb" => "GET",
        "request" => "/xampp/status.php",
    "httpversion" => "1.1",
       "response" => "200",
          "bytes" => "3891",
       "referrer" => "\"http://cadenza/xampp/navi.php\"",
          "agent" => "\"Mozilla/5.0 (Macintosh; Intel Mac OS X 10.9; rv:25.0) Gecko/20100101 Firefox/25.0\""
}
As you can see, Logstash (with help from the grok filter) was able to parse the log line (which happens to be in Apache "combined log" format) and break it up into many different discrete bits of information.
Send Data to Elasticsearch with Security
Filters are an in-line processing mechanism that provide the flexibility to slice and dice your data to fit your needs.
Create logstash-filter.conf file using below command.
elastic1@elastic1:/usr/share/logstash$ sudo nano logstash-filter.confLet's take a look at some filters in action. The following configuration file sets up the grok and date filters.
input { stdin { } }
filter {
  grok {
    match => { "message" => "%{COMBINEDAPACHELOG}" }
  }
  date {
    match => [ "timestamp" , "dd/MMM/yyyy:HH:mm:ss Z" ]
  }
}
output {
  elasticsearch {
        hosts => ["https://192.168.116.145:9200"]
        user => "elastic"
        password => "i04mQkERCsdffdf_uh8y"
        index => "my-index-%{+YYYY.MM.dd}"
        ssl => true
        cacert => "/usr/share/logstash/http_ca.crt"
  }
  stdout { codec => rubydebug }
}
Copy certificate and give enough permission
elastic1@elastic1:/usr/share/logstash$ sudo cp /etc/elasticsearch/certs/http_ca.crt /usr/share/logstash/http_ca.crt
elastic1@elastic1:/usr/share/logstash$ sudo chown logstash.logstash http_ca.crt
elastic1@elastic1:/usr/share/logstash$ sudo chmod 777 http_ca.crt
Run Logstash with this configuration:
elastic1@elastic1:/usr/share/logstash$ bin/logstash -f logstash-filter.confNow, paste the following line into your terminal and press Enter so it will be processed by the stdin input:
127.0.0.1 - - [11/Dec/2013:00:01:45 -0800] "GET /xampp/status.php HTTP/1.1" 200 3891 "http://cadenza/xampp/navi.php" "Mozilla/5.0 (Macintosh; Intel Mac OS X 10.9; rv:25.0) Gecko/20100101 Firefox/25.0"You should see something returned to stdout that looks like this:
{
        "message" => "127.0.0.1 - - [11/Dec/2013:00:01:45 -0800] \"GET /xampp/status.php HTTP/1.1\" 200 3891 \"http://cadenza/xampp/navi.php\" \"Mozilla/5.0 (Macintosh; Intel Mac OS X 10.9; rv:25.0) Gecko/20100101 Firefox/25.0\"",
     "@timestamp" => "2013-12-11T08:01:45.000Z",
       "@version" => "1",
           "host" => "cadenza",
       "clientip" => "127.0.0.1",
          "ident" => "-",
           "auth" => "-",
      "timestamp" => "11/Dec/2013:00:01:45 -0800",
           "verb" => "GET",
        "request" => "/xampp/status.php",
    "httpversion" => "1.1",
       "response" => "200",
          "bytes" => "3891",
       "referrer" => "\"http://cadenza/xampp/navi.php\"",
          "agent" => "\"Mozilla/5.0 (Macintosh; Intel Mac OS X 10.9; rv:25.0) Gecko/20100101 Firefox/25.0\""
}
You can also check index on the kibana as you see on the below picture.
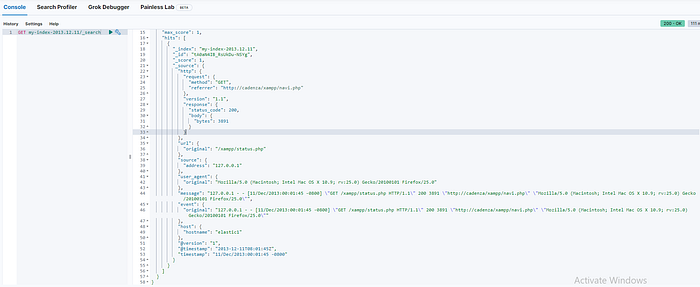
As you can see, Logstash (with help from the grok filter) was able to parse the log line (which happens to be in Apache "combined log" format) and break it up into many different discrete bits of information.