

Have you ever been in a situation where you needed a custom dataset, fast? Maybe you were prepping a quick demo for a machine learning class or experimenting with clustering algorithms. Whatever the scenario, you know the pain: writing dozens of lines of code, tweaking parameters, and praying the generated data fits the pattern in your head. Been there, done that. And that's why I'm here to share a little treasure I've discovered — a Python library that has genuinely changed the game for me: drawdata.
Let's take a deep dive into why this library is so special, how it works, and how it can make your life as a data scientist, teacher, or enthusiast so much easier. Spoiler alert: you're going to want to install this right away.
Stumbling Upon a Lifesaver
I had a few weeks to prepare for a workshop on the basics of machine learning. I wanted to make intuitive visual demonstrations for clustering, decision boundaries, and regression. The idea was simple: datasets that visually show what I was trying to explain. Think perfect clusters, spirals, and XOR patterns. But manually creating these datasets? That's a different story. Hours of my Python scripts, fiddling with Gaussian distributions and random seeds, had me ready to give up. When I found drawdata. A library that lets you literally draw a dataset with your mouse, right inside a Jupyter notebook? It sounded too good to be true. So I decided to give it a shot.
What Is Drawdata?
Simply put, it is a python library that makes it possible for you to hand-draw datasets or sketch them visual. You then use it with the ability of creating customized scatter plots by making points directly upon an interactive widget. These will then be suitable for use within your projects where it may aid in teaching concepts, experimenting a little, even prototyping through machine learning models. It presents a creative tool for data generation.
Getting Started
Installing and using drawdata is ridiculously simple. If you have Python installed, you're already halfway there. Here's how to get started:
Install the library:
pip install drawdataImport and initialize it in a Jupyter notebook:
from drawdata import draw_scatter
import matplotlib.pyplot as plt

plt.figure(figsize=(6, 6))
draw_scatter()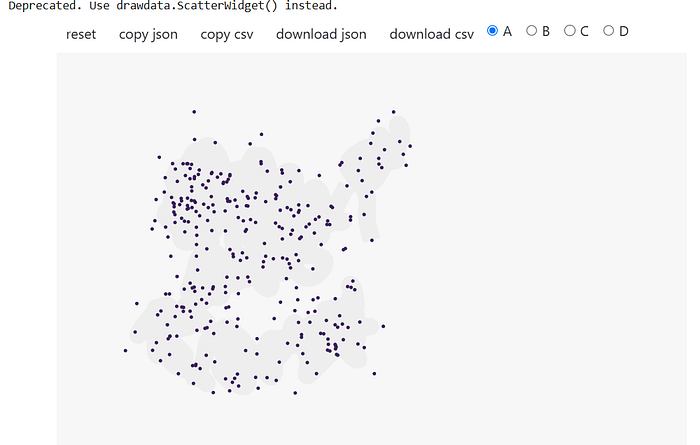
When you run the code, an interactive widget pops up. You can then click and drag your mouse to draw points on the canvas. Each click adds data to your custom dataset, which you can later export in formats like a Pandas DataFrame or NumPy array.
Why It's a Game-Changer
- Perfect for Teaching:
As a part-time instructor of machine learning concepts, I have always found it difficult to find datasets that clearly illustrate specific ideas. Sure, there are built-in datasets like Iris or the MNIST digits, but they're not always flexible or intuitive for every concept. With drawdata, I can draw exactly what I need to explain something like k-means clustering or decision tree boundaries.
For instance, I just recently put it to good use creating three distinct clusters for a k-means demo. Instead of explaining "imagine if the data looked like this," I could show it right away. The best part? It's incredibly engaging for students. I remember watching me sketch datasets live that added an extra level of interactivity to the session.
2. Rapid Prototyping:
Have you ever worked on a machine learning project where the dataset wasn't ready yet? It's frustrating, especially when you just want to test a new algorithm or visualization technique. That's where drawdata comes in. You can sketch a quick dataset to test your idea — no waiting for data preprocessing or external downloads.
3. Fun and Creativity:
Let's face it: most of us got into data science because we love solving problems creatively. Drawdata brings a level of fun back into the mix. It's finger painting for the data scientist in you. This is not a coding exercise. This is the creation of work.
Under the Hood
You might be wondering: how does drawdata turn your drawings into usable datasets? The library uses an interactive Matplotlib backend to capture your mouse movements as x, y coordinates. These points are stored in real-time and can be retrieved in multiple formats. Here's an example:
from drawdata import draw_scatter
import matplotlib.pyplot as plt

# Initialize the drawing canvas
plt.figure(figsize=(6, 6))
draw_scatter()

# Access the generated data
from drawdata.utils import get_data

x, y = get_data()
With these x and y values, you can:
- Save the data to a CSV file for later use.
- Load it into a Pandas DataFrame for analysis.
- Use it as input for scikit-learn models.
Real-World Applications
Let's talk about where you can actually use drawdata. While the library's primary appeal lies in its simplicity and interactive nature, it's surprisingly versatile.
- Classroom Demos: Teaching machine learning? Use drawdata to create datasets that fit the concept you're explaining.
- Visualization Experiments: Test out new plotting techniques or data visualization tools with a dataset you can tailor to your needs.
- Algorithm Debugging: Ever had an algorithm behave unexpectedly? Sometimes it's easier to debug with a dataset you control entirely. Drawdata lets you create edge-case datasets quickly.
- Collaborative Learning: Use drawdata in a group setting to let others sketch their own datasets. It's a great way to learn and explore data-driven thinking together.
The Drawbacks (Because Nothing's Perfect)
While I love drawdata to pieces, it does have some weaknesses. Here are a few areas where it can be improved upon:
Advanced Features: At present, drawdata is just the right tool for simple 2D scatter plots. If you are looking for higher dimensionality support or additional features like labelling points as you draw, then this may not be your tool.
Integration: The library works well in Jupyter notebooks but feels clunky in other environments. If you are not a notebook user, this might be a drawback.
Fine-Tuning: The datasets you draw might not always be perfectly precise. If you are working on a high-stakes project that requires exact data distributions, you will need additional steps to refine the generated points.
Wrapping It Up
Discovering drawdata felt like finding a magic wand for data generation. It's not just a tool; it's a creative playground that brings a new dimension to data science workflows. Whether you're a teacher, a learner, or just someone who loves experimenting with data, this library is worth adding to your toolkit.
So, what are you waiting for? Fire up your Jupyter notebook, install drawdata, and start sketching your next dataset. Who knows — you might just fall in love with data all over again.
Happy drawing!
Thank you for being a part of the community
Before you go:
- Be sure to clap and follow the writer ️👏️️
- Follow us: X | LinkedIn | YouTube | Newsletter | Podcast
- Check out CoFeed, the smart way to stay up-to-date with the latest in tech 🧪
- Start your own free AI-powered blog on Differ 🚀
- Join our content creators community on Discord 🧑🏻💻
- For more content, visit plainenglish.io + stackademic.com