April 26, 2020
Clearly explained: The mighty Central Limit Theorem
This is actually one of the most important statistical theorem, read on for an easy explanation!

Juhi Ramzai
4 min read
Why every ML engineer/ Data scientist MUST know about this

The Central Limit theorem (CLT) is one of the fundamental theorems in statistics and the good news is that it's a pretty simple concept as will be evident as you read further along. A pre-requisite concept that you have to understand before you read any further -Normal distributions and why are they so darn important! Read my post on normal distribution which serves as a perfect prequel to central limit theorem.
Clearly explained: Normal distributions and The central limit theorem What's so normal or not-so-normal about these concepts?
Moving on, the standard definition:
Central Limit theorem (CLT) states that given a sufficiently large sample size, the sampling distribution of the mean of a variable will approximate a normal distribution regardless of that variable's distribution in a population.
Decoding the wordy definition ^
Let's dive straight into some examples and by the time we'll emerge out on the other side, the CLT would be crystal clear to us.
Example #1
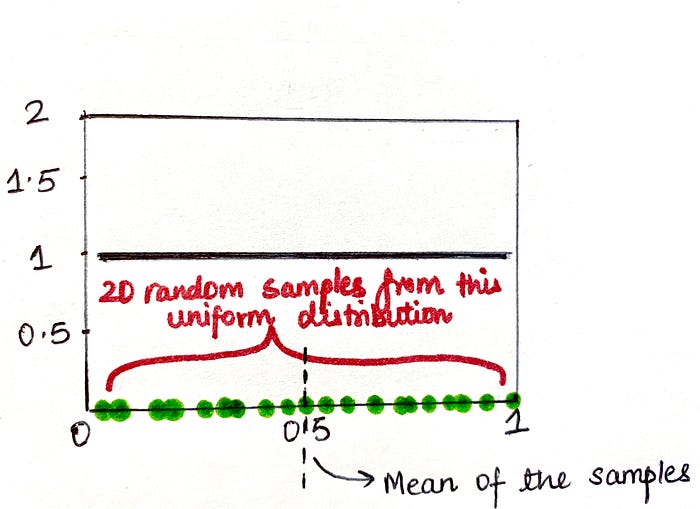
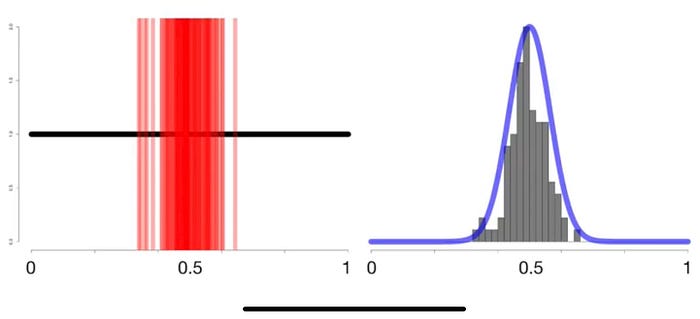
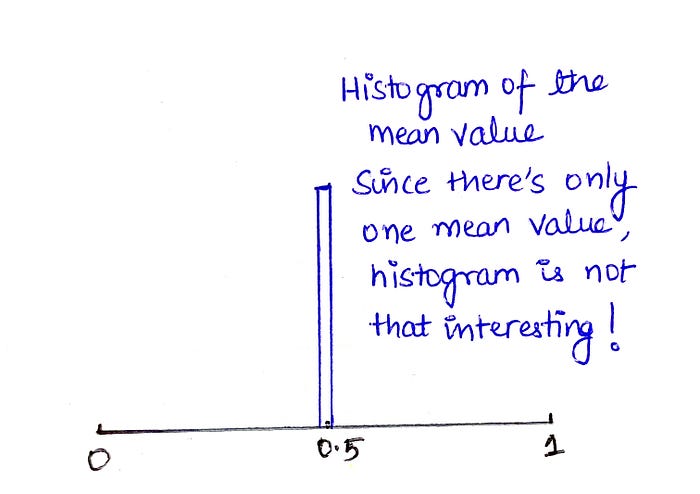
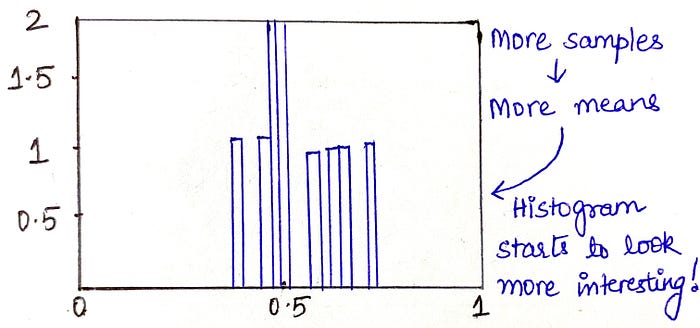
Let's take a uniform distribution (It goes from 0 to 1 and it's called as a uniform distribution because there is an equal probability of selecting values between 0 and 1, thus its probability density function(PDF) is the straight horizontal black line). Now, let's suppose we take 20 random samples from this distribution (green dots) and calculate the mean of these samples, we end up with a single value, in this case 0.5 denoted by the dotted black line. Let's proceed to plot this mean on a histogram. Since this histogram has only one mean value as of now, it's really not telling us anything (Left image below). Proceeding on to extracting more random samples from the same distribution, calculating respective means and plotting these means on a histogram again, we start getting an interesting output (Right image below)
Now, as we keep on taking out more and more random samples from our uniform distribution and keep on plotting the sample means on the histogram, we get the following as a result and IT TURNS OUT TO BE A NORMAL DISTRIBUTION (see right curve).
Inference: We started with the uniform data distribution but the means of samples drawn from it resulted in a normal distribution.
Example #2
In the second example, let's follow the same steps as in example #1, the only difference is that we are going to be drawing out the samples from an exponential distribution this time.
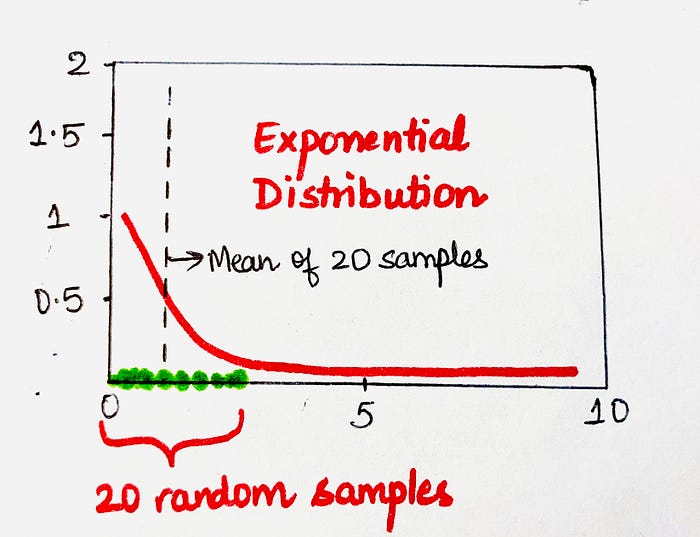
We will again take 20 random samples and calculate the mean of the sample and plot it on a histogram. Fast forwarding to about 100 samples from this exponential data distribution, the histogram starts looking like below and its pattern is of no surprise to us now. Yes, you guessed it right, the means of the samples resulted in a NORMAL DISTRIBUTION!
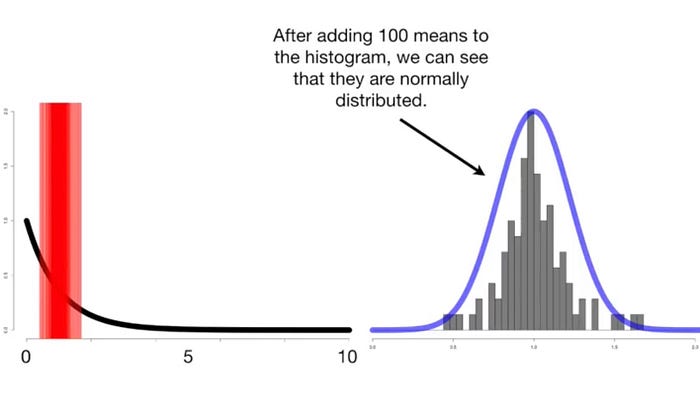
Inference: We started with the exponential data distribution but the means of samples drawn from it resulted in a normal distribution.
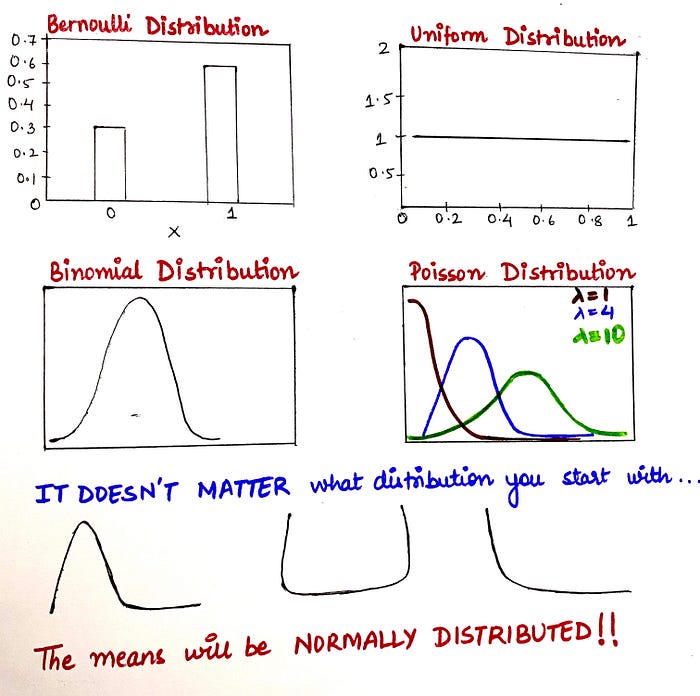
Thus, it becomes very intuitive at this point as to what CLT implies.
Central Limit theorem implies that even if the data distribution is NOT NORMAL, the distribution of the means of the samples drawn from it will be NORMAL.
What are the practical implications of knowing that the sample means are always* normally distributed?
In the world of analytics, we encounter a variety of data every day and the distribution of the source data is not always known to us, but, because we know about the CLT so we don't even need to care about this fact because the means are always going to be normally distributed and there is absolutely no need for us to worry about the source data distribution.
(Note*- For CLT to be able to work, we must be able to calculate the mean of your samples. There is a distribution known as Cauchy distribution which doesn't have a sample mean and thus CLT doesn't apply to it, but apart from Cauchy, I did not encounter any other distributions which are exceptions to CLT, so in case of any other distribution, you can be sure that the Central limit theorem applies to it very well.)
Below are the practical implications of knowing that means are normally distributed:
- We can use the mean's normal distribution to assign confidence intervals.
- We can perform T-tests (i.e. if there's a difference between means of 2 samples)
- We can perform ANOVA test (i.e. if there's a difference between means of 3 or more samples)
- We can perform any statistical test under the sun which uses sample mean.
And this brings us to the end of this post! This post covers the entire theory of Central limit theorem that we should know while dealing with data and samples.
Watch this space for more posts on analytics, statistics and Machine learning!!
Happy learning! :)