Ever wondered what happens when you pair up with an AI to build something cool? 🤔 Well, buckle up because we just went on a mini-adventure creating a stock visualization app, and let me tell you… It wasn't always smooth sailing! 😅
Setting the Stage: Cursor AI + MCP Setup
Let me share the secret sauce behind this project. I used an AI agent in the Cursor chat window and also set up an MCP server to interact with my local file system. This powerful combination allowed me to let the AI assistant not just suggest code but help me manage files and execute commands!

What is MCP? Model Context Protocol is a way to offer new tools to Cursor AI Agent. With MCP, the AI can access tools like
read_file,write_file,edit_file, and even execute commands on my behalf usingcmd /c npm -v. This streamlined the development process and made the coding experience truly collaborative.
To set MCP up in Cursor yourself, check out this article: Building Your Own AI News Agent: How Cursor MCP and Node.js Create Magic
What is Node.js? It is a JavaScript runtime environment that lets you run JavaScript code outside a web browser. It can execute JavaScript code directly on your machine, which powers many modern web backend services. Think of it as JavaScript's passport to the server-side world! 🌐
What is npm? It is short for "Node Package Manager." npm is the world's largest software registry. It's the App Store for JavaScript developers, offering pre-built packages. When we run
npm init -y, we create a manifest file (package.json) that tracks our project details and dependencies. The-yflag means "yes to all questions" - a real time-saver!
The Mission:
Our goal seemed simple: Grab some historical stock data for good ol' Apple (AAPL 🍏) using the yahoo-finance2 library and whip up a fancy Candlestick chart using Plotly.js. Easy peasy, right?
Step 1: Laying the Foundation 🏗️
First things first, every great project needs a home. I asked the AI to help set up our project, and through the Cursor interface, it guided me through the initial setup:
mkdir stock-market-app
cd stock-market-app
npm init -y
Boom. Project directory created. package.json ready. Now, for the magic ingredient...
npm install yahoo-finance2Why is npm so useful? With just one command, npm downloads not just the package asked for, but all of its dependencies too! It manages the complex web of interconnected packages, ensuring everything works seamlessly. No more hunting down libraries manually or dealing with version conflicts. It's like having a personal assistant who handles all your software shopping!
Why yahoo-finance2? When looking for financial data, this package stands out as one of the most reliable Node.js libraries for accessing Yahoo Finance data. It provides a clean API for historical stock prices, real-time quotes — all without requiring an API key or authentication. Perfect for our small project! The ƈ' in the name indicates it's the rewrite of an older package, with better TypeScript support and more consistent Promise-based interfaces.
What made this especially smooth was that the AI could suggest the commands and, through MCP, actually help execute them in my environment. No more copy-pasting between windows or trying to remember the exact package name.
Step 2: Let's Fetch Some Data! 🎣
This is where the AI partner shines. Instead of me reading through Yahoo Finance API documentation, I asked, "How do I fetch Apple stock data?" and the AI generated the code:
const yahooFinance = require('yahoo-finance2');
async function getStockData() {
    const queryOptions = { period1: '2023-01-01', period2: '2023-12-31' };
    try {
        const result = await yahooFinance.historical('AAPL', queryOptions);
        console.log(result);
    } catch (error) {
        console.error(error);
    }
}
getStockData();
Using the MCP's write_file tool, the AI wrote this directly to our getData.js file. Then, with a quick node getData.js executed through the MCP command interface, we got our data!
Step 3: Making it Pretty with Plotly ✨
Data is cool, but charts are cooler. Time to bring in the big guns: Plotly.js! The AI suggested:
npm install plotly.js-distWe dove back into getData.js, with my AI partner offering code to process the fetched data (dates, open, high, low, close – the usual suspects) and generate an HTML file containing our Plotly candlestick chart:
const yahooFinance = require('yahoo-finance2').default;
const fs = require('fs'); // Import the file system module
const path = require('path'); // Import the path module

async function generateCandlestickChart() {
  const symbol = 'AAPL';
  const queryOptions = {
    period1: '2023-01-01',
    interval: '1d',
  };

  try {
    console.log(`Fetching historical data for ${symbol}...`);
    const results = await yahooFinance.historical(symbol, queryOptions);
    console.log('Data fetched successfully.');

    // Prepare data for Plotly
    const dates = results.map(item => item.date);
    const openPrices = results.map(item => item.open);
    const highPrices = results.map(item => item.high);
    const lowPrices = results.map(item => item.low);
    const closePrices = results.map(item => item.close);

    // Define the Plotly trace
    const trace = {
      x: dates,
      close: closePrices,
      high: highPrices,
      low: lowPrices,
      open: openPrices,

      // type of chart is candlestick
      type: 'candlestick',
      xaxis: 'x',
      yaxis: 'y',
      name: symbol,
    };

    const layout = {
      title: `${symbol} Candlestick Chart`,
      xaxis: {
        title: 'Date',
        type: 'date',
        rangeslider: { visible: false } // Hide the range slider for simplicity
      },
      yaxis: {
        title: 'Price (USD)',
        autorange: true,
      }
    };

    const chartData = [trace];

    // Generate HTML content
    const htmlContent = `
<!DOCTYPE html>
<html>
<head>
    <meta charset="utf-8">
    <title>${symbol} Candlestick Chart</title>
    <!-- Include Plotly.js -->
    <script src="node_modules/plotly.js-dist/plotly.min.js"></script>
</head>
<body>
    <div id="candlestickChart" style="width:90%;height:600px;"></div>

    <script>
        const chartData = ${JSON.stringify(chartData)};
        const layout = ${JSON.stringify(layout)};

        Plotly.newPlot('candlestickChart', chartData, layout);
    </script>
</body>
</html>
    `;

    // Write the HTML file
    const outputPath = path.join(__dirname, `${symbol}_candlestick_chart.html`);
    fs.writeFileSync(outputPath, htmlContent);
    console.log(`Candlestick chart saved to: ${outputPath}`);

  } catch (error) {
    console.error('Error generating chart:', error.message);
    if (error.code === 'MODULE_NOT_FOUND' && error.message.includes('yahoo-finance2')) {
        console.error('\nPlease ensure yahoo-finance2 is installed: npm install yahoo-finance2');
    }
  }
}

generateCandlestickChart();
This involved crafting HTML strings within JavaScript… something that would have taken me ages to figure out on my own! Having an AI to generate the right approach saved hours of Stack Overflow searches. Plus, the AI could examine the Yahoo Finance response structure through MCP's read_file capability and adapt the code to match exactly what we received.

Step 4: The Mysterious Error… 👻
We ran node getData.js, eager to see our HTML file appear. Instead... cryptic error messages! node:internal/modules/cjs/loader... followed by... nothing? The terminal output was shy. Hmmm... 🤔
I shared the error with the AI, and it immediately had a theory. We suspected a module loading issue. Maybe yahoo-finance2 didn't install quite right? The AI didn't just guess – it suggested a specific solution.
Step 5: The "Turn It Off and On Again" Technique (for npm)
The AI suggested we try the classic fix: reinstall the dependency!
npm uninstall yahoo-finance2
npm install yahoo-finance2
We ran node getData.js again. This time... IT WORKED! 🎉 The script ran, no errors, and AAPL_candlestick_chart.html popped into existence. Victory!
Step 6: The Anticlimax… The Blank Screen Saga 🤔
Excitedly, we opened the HTML file in the browser expecting glorious charts, but were met with… a vast, empty, white void. Blank. Nada. 😨
What went wrong now? I was about to throw in the towel, but my AI programming buddy was calm and collected.
After I described the issue through the Cursor chat, the AI quickly realized the culprit: browsers often have security restrictions about loading local files (file:///...) referenced from other local files. Our HTML couldn't load the Plotly script from the node_modules folder. D'oh!
Step 7: The CDN Savior 💡
The AI offered an elegant solution: Use Plotly's Content Delivery Network (CDN)! We tweaked the <script> tag in our getData.js HTML generation logic:
<!-- Before -->
<script src="node_modules/plotly.js-dist/plotly.min.js"></script>
<!-- After -->
<script src="https://cdn.plot.ly/plotly-latest.min.js"></script>
Using MCP's edit_file capability, the AI made this change directly to our file.
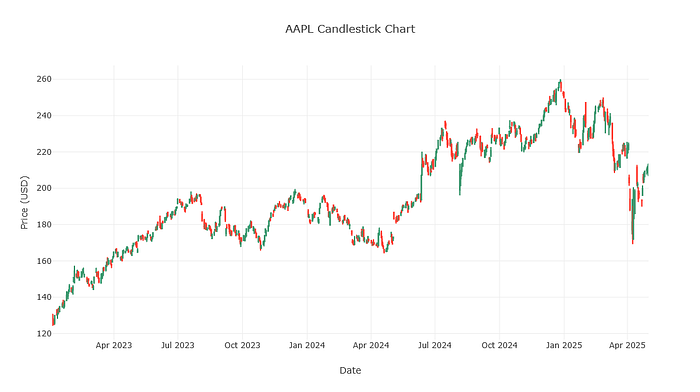
Step 8: TRUE Victory! 📈🥳
We opened the new AAPL_candlestick_chart.html. And there it was. A beautiful, interactive candlestick chart showing Apple's stock performance. Success! Real, actual, visual success!
The AI had guided me through the entire process, from setting up the project structure to fixing browser security issues — problems I would have spent hours debugging on my own.
The Takeaway:
Building things, even simple things, is often a journey of trial, error, and debugging. Sometimes the errors are cryptic, sometimes the environment throws curveballs, and sometimes the browser wants a CDN link. But working through it step-by-step, with an AI partner, makes the final result all the more satisfying.
The combined Cursor AI agent and MCP setup transformed the coding experience. Rather than just getting suggestions, the AI could:
- Generate complete code solutions based on my requirements
- Read and write files directly in my project
- Execute commands to install packages and run scripts
- Debug issues by examining actual execution results
- Make targeted edits to fix specific problems
A simple request became a mini-adventure in Node.js, npm, APIs, HTML generation, and browser security quirks. And we ended up with a working chart!
What should we build next…? 😉 Maybe something using Express.js to make our chart accessible via a web server? With my AI pair programmer by my side, I'm ready for the next challenge!