


You have reached the fifth part of the Data Science Made Easy series. In this article, I will be teaching you some basic steps to perform image analytics using Orange. For your information, Orange can be used for image analytics tasks as well apart from the normal classification and regression tasks. By now you should be familiar with the user interface of Orange. Before we start, make sure that you have installed Orange. Kindly read the first part for setup and installation if you have missed it, there will be links at the bottom for you to navigate the entire Data Science Made Easy series. Let's get started!
Installing Image Analytics Add-On
Orange comes with quite a lot of add-on that are quite useful. In this article, we will be focusing on just one of it called the Image Analytics.
- Click on the Options menu and a dropdown list will appear.
- Select Add-ons and click on the button to open up the Add-on interface.
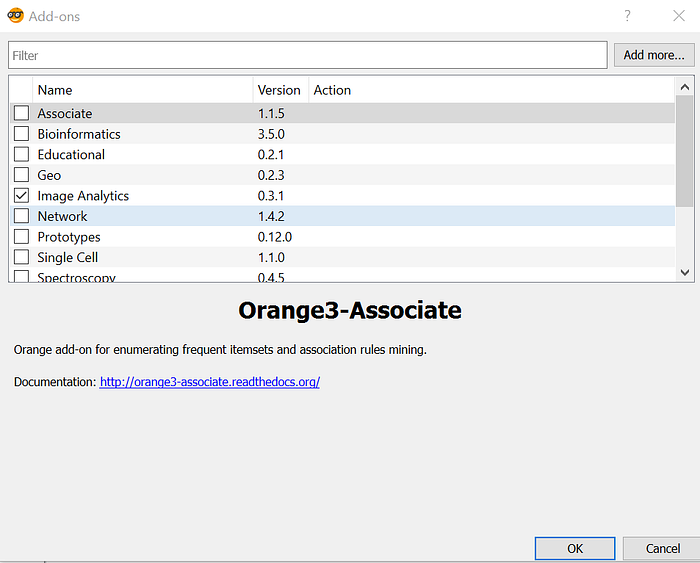
Tick on the Image Analytics and click the "OK" button at the bottom right. Wait for the installation to finish and you are good to go. You might need to restart Orange for it to work. You should be able to see the Image Analytics widget as shown in the figure below.

Widgets
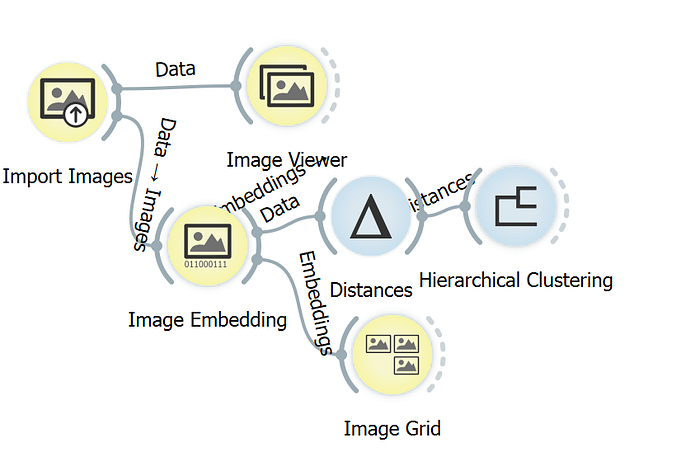
Import Images
The first thing to do is to import the image via the Import Images widget. You can think this widget as the File widget for image. However, Import Images widget accepts a directory instead of a file.
- Add Import Images widget to the canvas.
- Double click on it to open up the interface.
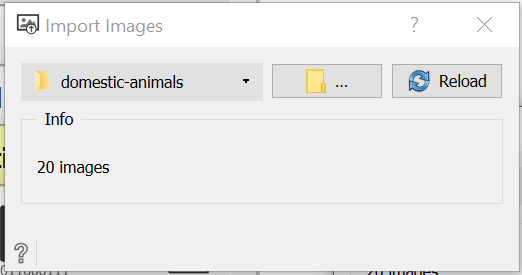
The dropdown list shows the past directory while the middle button is to open any new directory. If you have added or removed any images in the directory, you can use the "Reload" button to refresh the content. There is also an info text showing the number of images in the directory. For this tutorial, I will be using some sample images provided by the official blog post made by Orange. You can get the dataset from the following link. It should contains 19 images of domestic animals. Extract it and you should have a domestic-animals folder.
Image Viewer
Next, we will be relying on the Image Viewer widget to check the content of the directory. This widget will display all of the loaded images. This is useful as the entire workflow can do done via Orange without the need to open up the Explorer. Let's continue from the previous session.
- Add a Image Viewer widget to the canvas.
- Connect Import Images widget with Image Viewer widget.
- Double click on the Image Viewer widget to open up the interface.
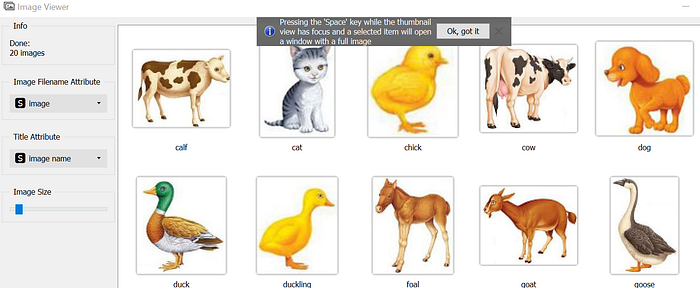
You should see the interface as shown in the figure above.
Image Embedding
This widget is the most important for the entire Image Analytics package as this is where the magic happens. For your information, classification and regressions tasks requires data in the form of numbers and there isn't a good way to perform such tasks with images unless we represent it in the form of numbers. This is where Image Embedding widget works by converting it to a vectors of numbers. Image Embedding widget reads images and uploads them to a remote server or evaluate them locally.
- Add a Image Embedding widget to the canvas.
- Connect Import Images widget with Image Embedding widget.
- Double click on the Image Embedding widget to open up the interface.
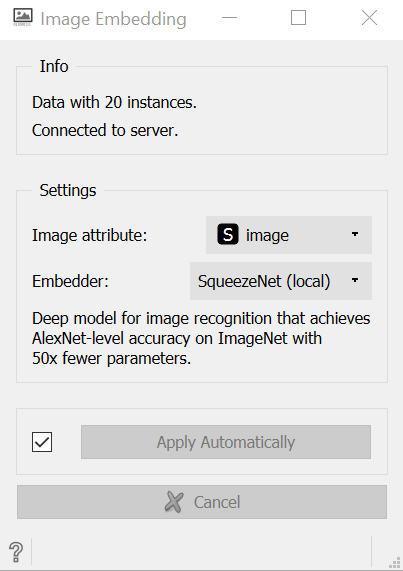
The most important parameters for the Image Embedding interface is the Embedder. You can quite a number of embedder that you can use. Most of them require internet connect to do the conversion except for SqueezeNet. Based on the official documentation, the list is as follow:
- SqueezeNet: Small and fast model for image recognition trained on ImageNet.
- Inception v3: Google's Inception v3 model trained on ImageNet.
- VGG-16: 16-layer image recognition model trained on ImageNet.
- VGG-19: 19-layer image recognition model trained on ImageNet.
- Painters: A model trained to predict painters from artwork images.
- DeepLoc: A model trained to analyze yeast cell images.
The safest choice is to choose SqueezeNet if you do not have any internet connection. Feel free to play around with it as each Embedder will produce different output. Please be noted that the official documentation states that images sent to the server are not stored anywhere.
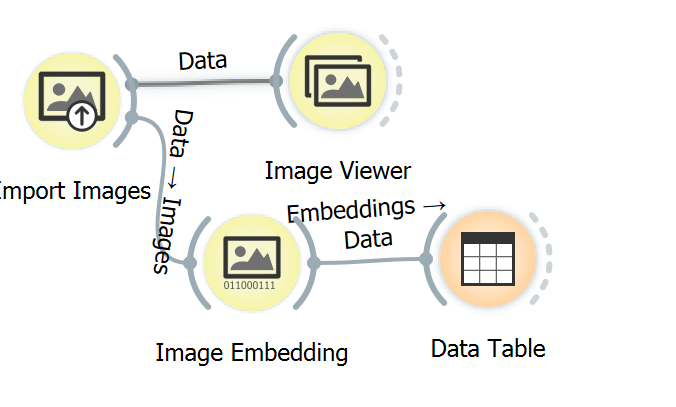
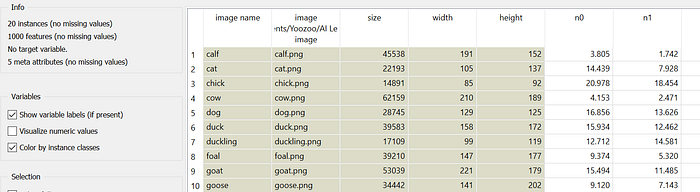
You can connect it with a Data Table widget to see the output. You should obtain something similar to the figure below.
Distances and Hierarchical Clustering
You can analyze it further by passing the output from Image Embedding widget into Distances widget and Hierarchical Clustering widget. You will be able to see a dendogram which is a tree diagram frequently used to illustrate the arrangement of the clusters produced by hierarchical clustering.
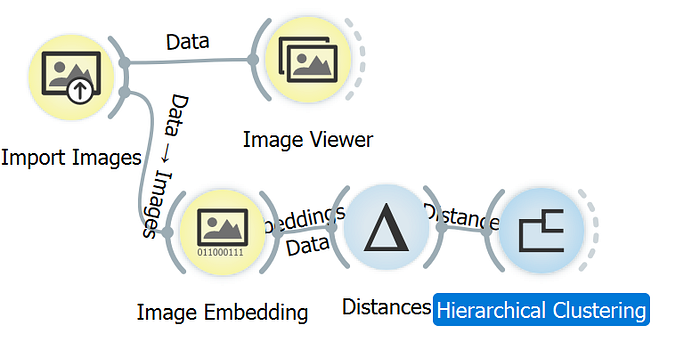
- Add a Distances widget to the canvas.
- Connect Image Embedding widget with Distances widget.
- Add a Hierarchical Clustering widget to the canvas.
- Connect Distances widget with Hierarchical Clustering.
- Double click on Hierarchical Clustering widget to open up the interface.
You should be able to see the interface as shown in the figure above.
Image Grid
If you are more of a visual person, you can try the Image Grid widget instead. Based on the official documentation, Image Grid widget can display images from a dataset in a similarity grid. This means that images with similar content are placed closer to each other. It can be used for image comparison, while looking for similarities or discrepancies between selected data instances.
- Add a Image Grid widget to the canvas.
- Connect Image Embedding widget with Image Grid widget.
- Double click on Image Grid widget to open the interface.
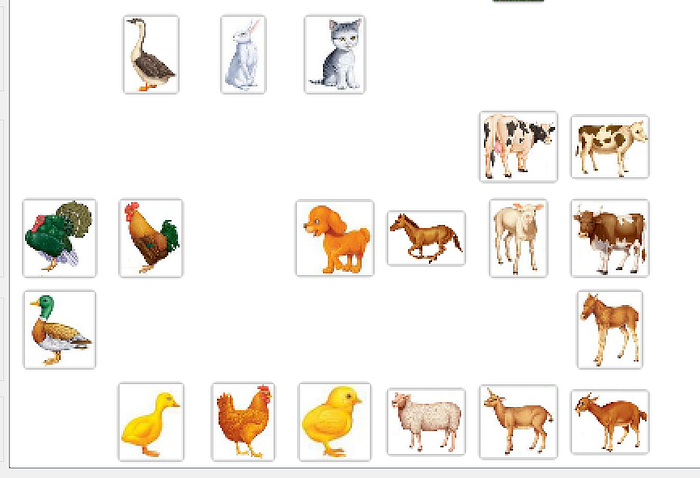
You should be able to obtain something similar to the image above. You can see the images are separated nicely into different clusters based on shape and colour.
Test
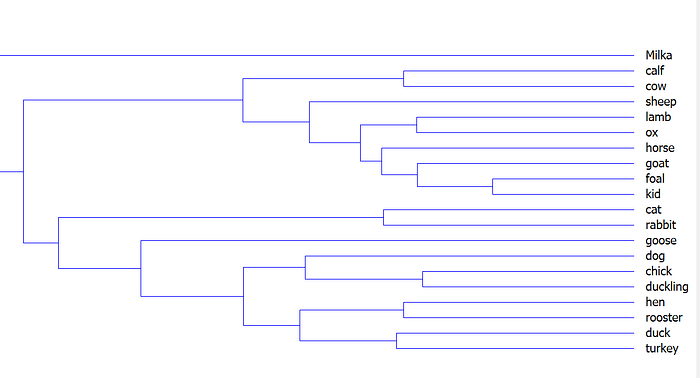
Let's try out how the clustering works by using a different kind of images. The official blog provide us with Milka that face the front camera. This differs a lot from any of our existing images. Will it be able to cluster it together with calf or cow?
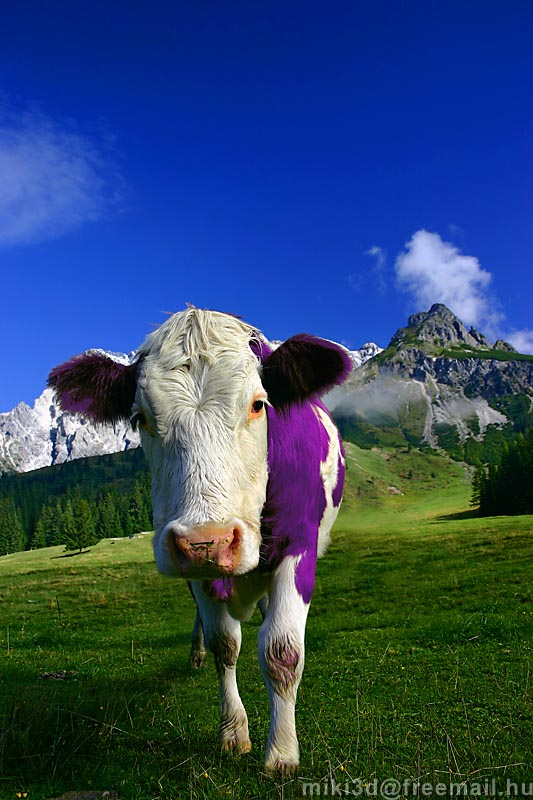
Save the image and put inside the domestic-animal folder. Refresh the Import Images widget and double click the Hierarchical Clustering widget.
You should be able to see that Milka is placed right above calf and cow. However, it does not reside within the same cluster. Feel free to try it out with a few images of your choice from the internet.
Conclusion
Congratulations for reaching this far! Let's recap on what we have learned today. We started off with installing image analytics add-on which provides us with a few new widgets. Then, we load the images via the the Import Images widget. You can point it to a directory of your choice. You can check the images via the Image Viewer widget. Besides, we also learned to use the Image Embedding widget to convert the images to vector of numbers. There are different kind of Embedders that can be used. Next, we tried out Distances widget and Hierarchical Clustering widget to show a dendogram of the cluster. Finally, we test it out with a sample image. Thanks for reading the part 5 of Data Science Made Easy tutorial. See you in the next tutorial. ❤️
Data Science Made Easy
- Interactive Data Visualization
- Data Processing
- Test and Evaluation
- Data Modeling and Prediction
- Image Analytics