

WEEKLY BUSINESS ROUNDUP
Stocks climbed on Friday after U.S. consumer sentiment increased and inflation showed signs of easing. This boosted optimism about the economy's resilience, leading to expectations that the Federal Reserve would halt its interest rate increases. According to data from the U.S. Department of Commerce, the June core personal consumption expenditures price index, which is the Federal Reserve's preferred measure of inflation, moderated on a monthly and yearly basis.
Additionally, consumer spending in June outpaced income growth. The positive economic indicators, along with better-than-expected GDP results and earnings season, have fueled analysts' beliefs that the market will continue its upward trajectory, possibly reaching new record highs. In the week's performance, the Nasdaq rose by 2%, the S&P 500 increased by 1%, and the Dow Jones average climbed by 0.6%. The Dow Jones' 13-day winning streak, which had been the longest since 1987, came to an end on Thursday, but the index rebounded on Friday.
During this week, major global central banks made significant announcements regarding their monetary policies, leading to considerable volatility in the foreign exchange market. Among the currency pairs affected, EUR/USD and EUR/JPY experienced notable fluctuations in the latter part of the week. The US dollar index strengthened due to positive US economic data and a weakening Euro, reaching levels not seen in nearly three weeks.
The week's data from the US indicated favorable conditions for the dollar, with advanced Q2 GDP showing robust growth of 2.4%, a strong reading of 4.7% in durable goods, and encouraging job data that reflected the strength of the US labor market. The positive economic indicators provided a boost to the US dollar, and the market is now looking forward to the Core PCE data next.
Bitcoin's price performance has been lackluster, but it managed to stay above the $29,000 mark. The week began with a sharp decline, taking the price from over $30,000 to a monthly low of just under $29,000. However, the bulls stepped in to support the price and pushed it slightly above that level. Subsequently, the market remained relatively quiet with little movement, even in response to the US Fed's interest rate hike on Wednesday, which historically caused higher volatility.
Similarly, other alternative coins have also been relatively stagnant. Ethereum and XRP, two prominent cryptocurrencies, have seen marginal daily increases of less than 0.5%, trading at levels above $1,870 and $0.7, respectively. On the other hand, Shiba Inu, a larger-cap altcoin, experienced the most significant increase following the release of the Shibarium beta version.
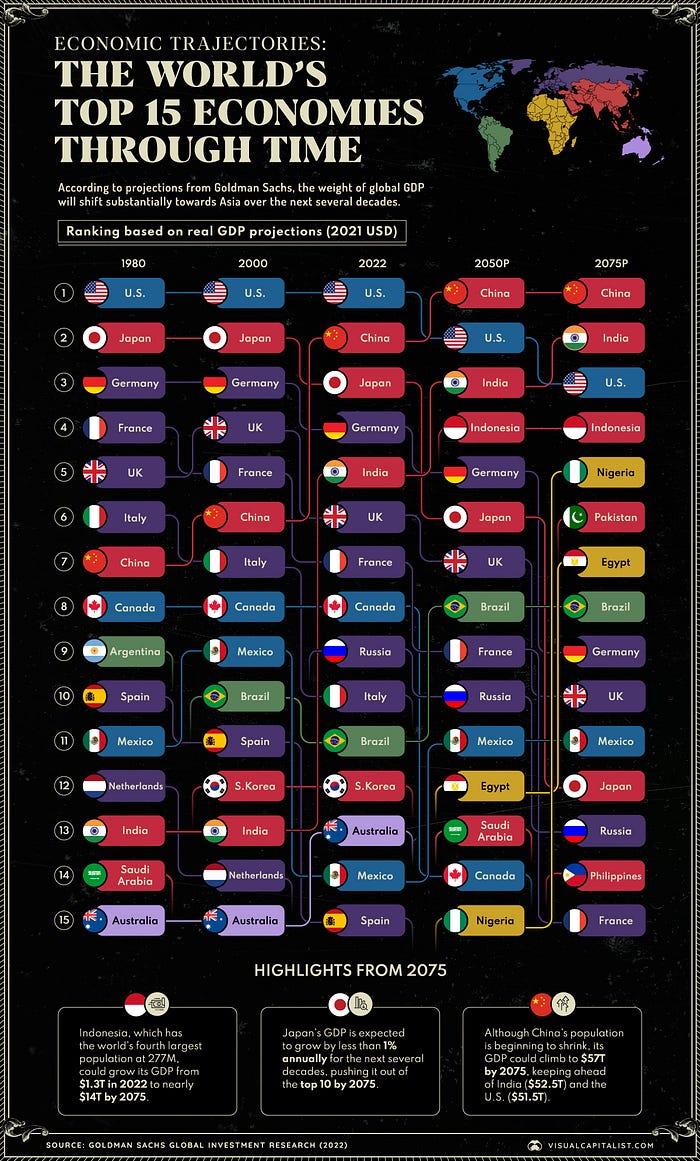
Goldman Sachs' recent report indicates a significant projected shift in the balance of global economic power over the next few decades. The provided bump chart (above) illustrates a historical and predictive representation of the world's top 15 economies at various milestones: 1980, 2000, 2022, and Goldman Sachs' projections for 2050 and 2075.
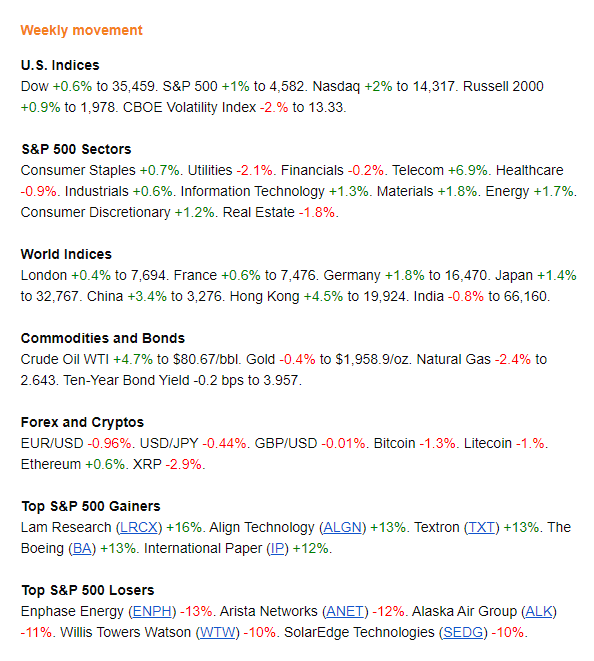
And finally, before moving on to other statistics, here are the weekly & YTD numbers from various markets and assets (Figure 1).
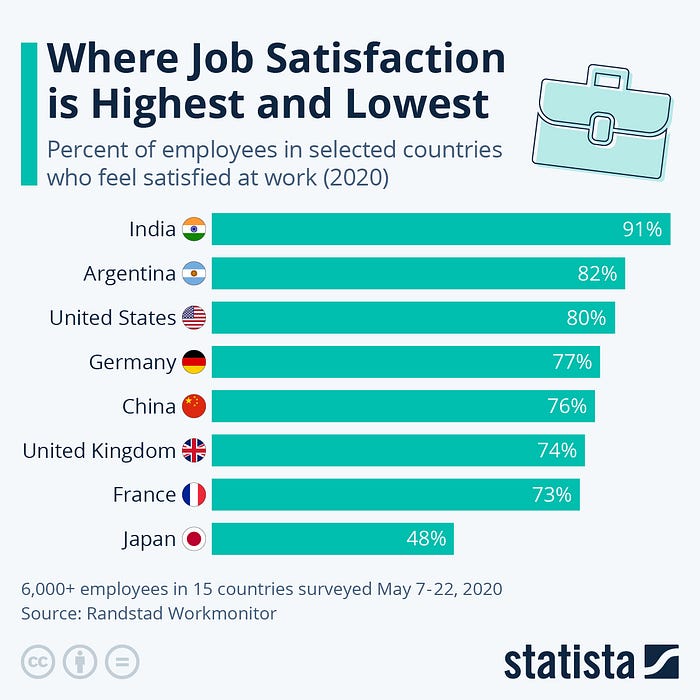
Job Satisfaction
Based on the Randstad Workmonitor survey of 15 countries, Indians expressed the highest level of job satisfaction, whereas Japanese workers reported the lowest satisfaction rate, with only 48% stating they were content with their work (Figure 2). Various factors can contribute to work dissatisfaction, and the cutthroat nature of Japanese working culture has been widely discussed as one potential reason. A negative work environment also plays a role in contributing to unhappiness. On the other hand, higher levels of job satisfaction were observed in India and Latin America. North American workers also reported satisfaction levels above the global average. In Southern & Eastern Europe, and the APAC region, satisfaction levels were somewhat lower compared to the global average.
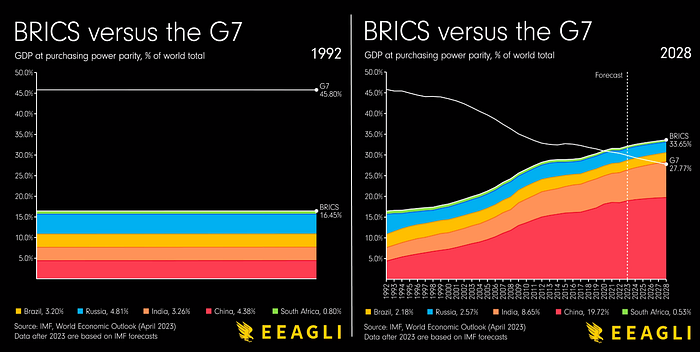
BRCIS vs. G7
The G7 has its origins fifty years ago when government finance leaders from the UK, West Germany, France, and the U.S. held an informal meeting. This gathering marked the beginning of the G7. With time, the group expanded by including Japan, Italy, and Canada. These industrialized nations were thriving due to the post-war productivity boom and held considerable economic power, with their combined output historically accounting for approximately 40% of global GDP. However, in more recent times, another international group known as BRICS (Brazil, Russia, India, China, and South Africa) has emerged and has been establishing its place within the global economic landscape (Figure 3).
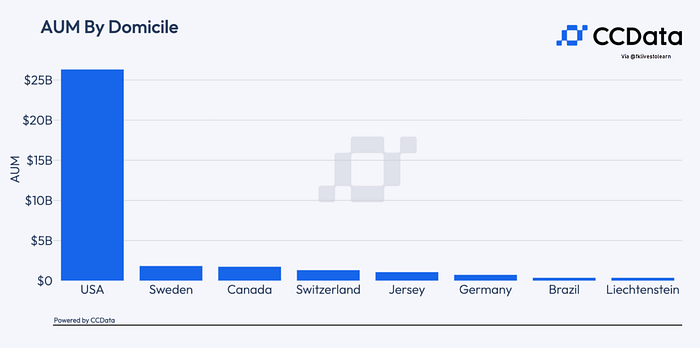
U.S Dominates Digital AUM
The United States continues to hold its top position (Figure 4) in terms of digital assets under management (AUM). Recent ETF filings and renewed interest in US investment products have played a role in easing concerns about regulatory scrutiny that had affected the market in recent months. With a monthly AUM of $26.3 billion and a market share of 78.0% in July, the US remains a dominant force in the digital asset space.
Global Growth Projections
According to the latest IMF forecast, global economic growth is expected to slow down from 3.5% last year to 3% for both this year and the following year. This represents a slight improvement of 0.2 percentage points for the 2023 projection compared to the April estimates (Figure 5). In terms of inflation, the forecast indicates a decline from 8.7% in the previous year to 6.8% for this year, with a downward revision of 0.2 percentage points. Looking ahead to 2024, inflation is projected to further decrease to 5.2%.
The slowdown in economic growth is primarily concentrated in advanced economies, where growth is anticipated to decline from 2.7% in 2022 to 1.5% this year, with a modest uptick to 1.4% next year. The euro area, still recovering from the impact of last year's sharp increase in gas prices due to the war, is expected to experience a significant deceleration. In contrast, emerging markets and developing economies are expected to show more resilience, with year-on-year growth forecasted to accelerate from 3.1% in 2022 to 4.1% for both this year and the next.
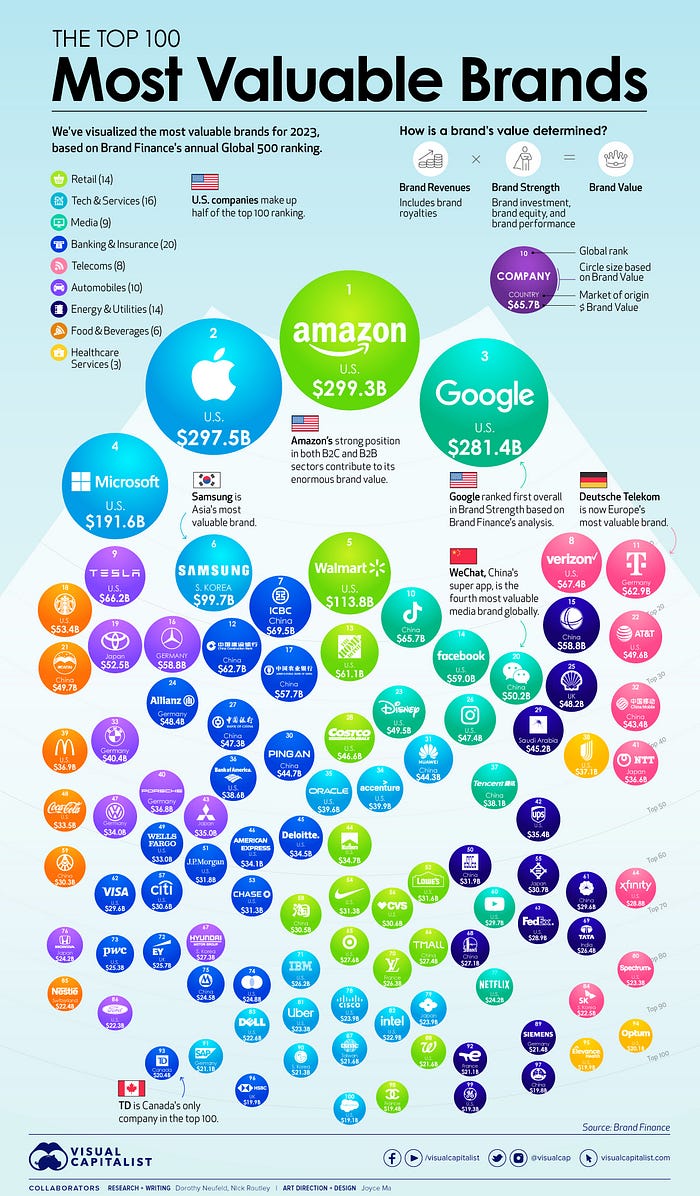
100 Most Valuable Brands
Brand value holds significant importance among a company's intangible assets. Non-physical assets like patents and brand names are becoming increasingly influential in determining a company's overall worth. A study conducted in 2020 revealed that intangibles accounted for 90% of the S&P 500's market value, marking a notable increase of 22 percentage points since 1995. The infographic provided (Figure 6) showcases the world's 100 most valuable brands in 2023, ranked annually by Brand Finance. This visual representation highlights the pivotal role brand equity plays in determining a company's market position.
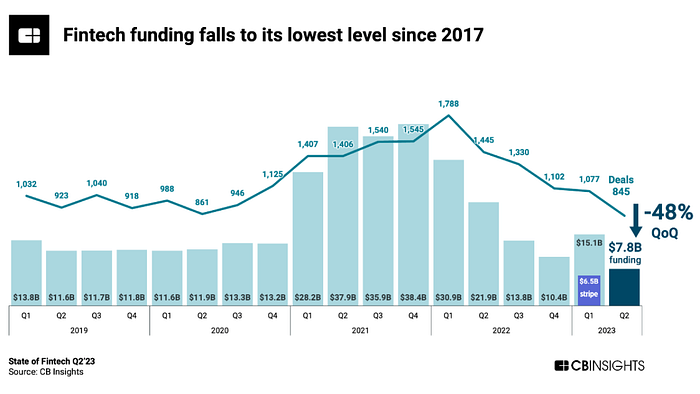
Fintech Funding
In Q2ན, the global fintech ecosystem experienced a slowdown, with both funding and deals declining to levels last seen in 2017. Despite a surge in funding during Q1ན, primarily driven by Stripe's $6.5 billion round, global fintech funding dropped significantly by 48% quarter-over-quarter (QoQ) in Q2ན, amounting to $7.8 billion. Concurrently, the number of fintech deals also decreased for the fifth consecutive quarter, reaching a total of 845 deals. According to CB Insights data (Figure 7), this decline in global fintech funding represents nearly a 50% decrease, marking its lowest point since 2017. Among all fintech sectors, payments funding experienced the most substantial decline, falling by 75% QoQ.
Income Inequalities
Income inequalities have been on the rise for several decades, leading to a stagnation in social mobility. People at the lower end of the socioeconomic ladder are facing increasing challenges in upward mobility, while the extremely wealthy continue to accumulate wealth. An OECD study delved into the average number of generations required for individuals born into the poorest families (within the lowest 10%) to reach the average income level in their respective countries.
The accompanying infographic (Figure 8) highlights Colombia's poor performance within the OECD, as it takes an average of 11 generations for individuals from the poorest backgrounds to attain the country's average income level. This stands in stark contrast to the overall average of 4.5 generations for the 30 countries analyzed. On the other end of the spectrum, Denmark emerges as a role model for social mobility, with individuals from modest backgrounds needing only two generations, on average, to reach the country's average income level.

Market Comic: Will Fed Chair Powell Spoil The Party?


Previous Edition of GBW:
Read more stories like this and others by Faisal Khan on Medium
Stay informed with the content that matters — Join my weekly Newsletter