Marketing campaigns live and die by numbers.
We send thousands of emails… But beneath the surface of simple "open rates" and "click-through rates" lie powerful probability models that can transform you from a reporter of data into a strategic architect of success.
Let's explore three lenses for looking at campaign outcomes: Binomial distribution, Poisson distribution, and Markov chains. Each tells a different part of the story.
📊 Binomial Distribution: The Basics of "How Many"
The Binomial distribution is your basic yes-or-no coin flip. Instead of heads or tails, your customer either shops (success) or doesn't shop (failure) 🛒.
- Business framing: If you send 50 emails and your historical shop probability is 80%, the Binomial model tells you the likelihood of getting exactly 30, 40, or 50 purchases.
- Why it matters: It quantifies the risk of underperformance. If you expected 40 buyers, but only got 30, Binomial shows that this outcome had only a 0.1% probability. In other words, it's a red flag worth investigating.
Takeaway: Use Binomial when you want to validate whether your campaign results match expectations. It answers the question: 👉R
But what happens when your success rate is so tiny that the Binomial math gets clunky? We turn to Poisson
🔢 Poisson Distribution: When Events Are Rare
Sometimes the math of Binomial gets messy — especially when you have a large audience but very small conversion rates. That's where Poisson shines.
- Business framing: Imagine sending 100 emails with a 0.5% shop rate. You expect about 0.5 purchases. Poisson helps you model the probability of seeing exactly 0, 1, or 2 shoppers.
- Why it matters: It's perfect for forecasting "rare but important" events. In campaigns, that might mean low-probability actions such as high-value product purchases, survey responses, or referral sign-ups.
Takeaway: Use Poisson for quick forecasting when success rates are tiny but audience sizes are large. It answers: 👉R
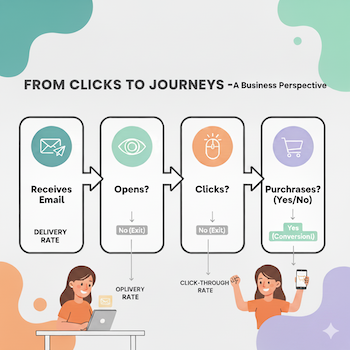
🔄 Markov Chains: Beyond Counts, Into Journeys
Binomial and Poisson stop at counting. But customers don't just "buy" or "not buy" — they move through a funnel: open, click, browse, purchase. Markov chains give you a map of that journey.
- Business framing: In one campaign with 100 customers, 70 never open the email, 30 open it, but 22 stop there, 8 click, but only 3 go on to purchase.
- How: While Binomial just tells you how many ultimately bought, Markov tells you the story of the ones who quit. It reveals, for example, that the biggest probability drop-off isn't between the click and the purchase — it's between receiving the email and opening it. This immediately signals that your time is better spent optimising subject lines than optimising the checkout page.
- Why it matters: Markov chains reveal where customers drop off. Maybe your subject lines are strong (good open rates), but your CTA is weak (few clicks). Or maybe you drive clicks but fail to close sales.
Takeaway: Use Markov chains to optimize the funnel. It answers: 👉R
💡 Bringing It Together
- Binomial helps you test whether campaign results are within the realm of expectation.
- Poisson helps you forecast rare events quickly and simply.
- Markov chains help you see the bigger picture: the customer journey across touchpoints.
Together, they move you from counting conversions to understanding behavior.
And in marketing, that shift is the difference between reporting yesterday's numbers and actively designing tomorrow's success.
✨ Closing thought: Next time you're analysing a campaign, don't just ask
"How many bought?". Ask "How did they get there, what are the odds, and where did we lose the rest?".
Probability models give you those answers — and in the process, make you a more strategic marketer.
Thank you for staying till the end! 😃
If you enjoyed reading, please give it a CLAP! 🙌