

Application Load Balancers (ALBs) are a popular way to distribute traffic across multiple servers in AWS. By default, ALBs will scale capacity up or down based on metrics like overall request volume. However, these predefined metrics don't always accurately reflect the real-time user load on your system.
In this tutorial, we will explore how to configure an ALB to dynamically scale using a custom CloudWatch metric tailored to your traffic patterns. The key steps will be developing a metric that tracks concurrent users, creating an auto scaling policy to respond to changes in that metric, and setting up CloudWatch alarms that trigger the scaling.
Taking the time to implement custom metrics allows your ALB to scale in a much smarter way aligned with user demand, rather than just overall traffic. The end result is a more efficient system that provides just the right amount of capacity at any given time. While it requires some thoughtful configuration, auto scaling based on custom metrics can be a huge performance and cost enhancement for production workloads.
We'll walk through a full example demonstrating how to tie together custom metrics, auto scaling policies, and CloudWatch alarms to build a dynamic scaling solution for ALBs. By the end, you should have a template to implement similar data-driven scaling for other AWS resources as well.
Prerequisites
- An existing ALB deployed in AWS
- The ability to publish custom metrics to CloudWatch
- Basic understanding of Auto Scaling and CloudWatch alarms/rules
Create a Custom Metric
Counting Concurrent Users
There are a couple approaches we could use to count the number of concurrent users connected to the ALB:
Approach 1: Session tracking
- Maintain a dictionary/map that stores the session ID of each connected user
- Increment the count when a new session starts
- Decrement when a session ends or times out
- On a regular interval, publish the current size of the session map to CloudWatch as the metric
Approach 2: Analytics tracking
- Instrument your application code to send analytics events when a user connects or disconnects
- Aggregate these events in a tool like Amazon Kinesis Data Analytics
- Use a SQL query to calculate the current number of connected users
- Publish the output of the query to CloudWatch as the metric
metricInterval
We will want to publish the concurrent user count on a regular interval like 60 seconds. This provides sufficient data points for the auto scaling policies to act on.
metricName
The custom metric will need a distinct name like "ConcurrentUsersConnected" to differentiate it from other metrics.
metricNamespace
For metrics specifically related to the ALB, we could publish under a namespace like "ALB/metrics" to keep them organized.
The key is to emit a metric that accurately represents the real-time user load so the scaling works effectively. Experimenting with different approaches can help narrow in on the best metric.
Create a Scaling Policy
Scaling Adjustments
In the scaling policy configuration, we can tune how aggressively the ALB scales up and down in response to changes in the metric.
The main settings that control this are:
Scale-out adjustment — How many additional ALB instances to add when scaling up. Can start with +1.
Scale-in adjustment — How many ALB instances to remove when scaling down. Should be -1 to remove one instance at a time.
Cool-down period — The number of seconds to wait between scaling adjustments. Can start with 60 seconds.
Scaling Limits
We should set appropriate minimum and maximum limits on how large or small the ALB can scale:
Minimum capacity — The lowest number of ALB instances, even if metric is low. Can be 1–2 for high availability.
Maximum capacity — The highest number of ALB instances needed for peak loads. Set based on load testing.
These limits prevent "thrashing" and runaway scaling activity.
Scaling Costs
When enabling auto scaling, we need to consider the additional hourly costs of running more ALB capacity. Monitor the scaling over time and adjust as needed based on usage patterns.
Setting up auto scaling takes some trial and error, but pays off in the long run by allowing the ALB to dynamically adjust to traffic levels.
Trigger Scaling with an Alarm
Alarm Evaluation Periods
The period we choose for the alarm evaluation impacts how responsive the scaling is. Shorter periods (e.g. 60 secs) cause scaling to happen faster. Longer periods (5–10 mins) reduce the chance of false alarms but scaling takes longer. Can start with 60 secs for responsiveness and adjust as needed.
Alarm Threshold Buffer
When setting the alarm threshold, add a buffer above the target metric value. For example, target = 100 users, threshold = 125 users. This prevents rapidly toggling between scale in/out around the exact threshold value.
Alarm Actions
Make sure the alarm is configured to take the intended auto scaling actions:
Scale out — increase ALB capacity
Scale in — decrease ALB capacity
The alarm state must match the scale in/out actions.
Alarm Notification
Optionally configure SNS notifications when the alarm fires, to get notified of scaling events. This can help monitor if scaling is working as expected.
High Resolution Metrics
Use 1-minute metrics for the alarm for faster scaling based on detailed data. The default is only 5-minute metrics. With some tuning of the above alarm settings, we can achieve responsive scaling that closely trails load changes. Monitor closely and continue optimizing based on real-world usage patterns.
AWS CLI Commands for Scaling ALB Capacity with Custom Metrics
Here are some example AWS CLI commands for creating the custom metric, scaling policy, and alarm to dynamically scale the ALB:
Publish custom metric

Create scaling policy
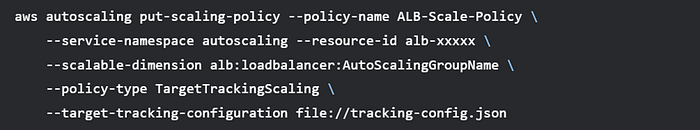
tracking-config.json:
Create CloudWatch alarm
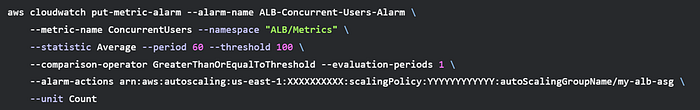
This uses the CLI to publish the custom metric, create a target tracking scaling policy, and set up a CloudWatch alarm to trigger scaling when the metric breaches the threshold. The CLI provides a programmatic way to automate setting up the dynamic scaling solution.
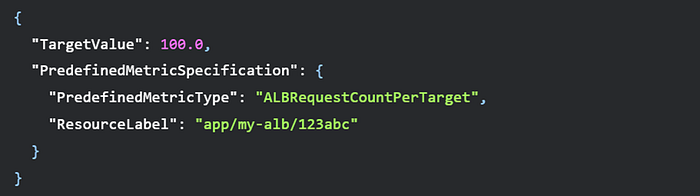
Example Tracking Config JSON
Here is an example tracking-config.json file that could be used with the AWS CLI command to create the scaling policy:
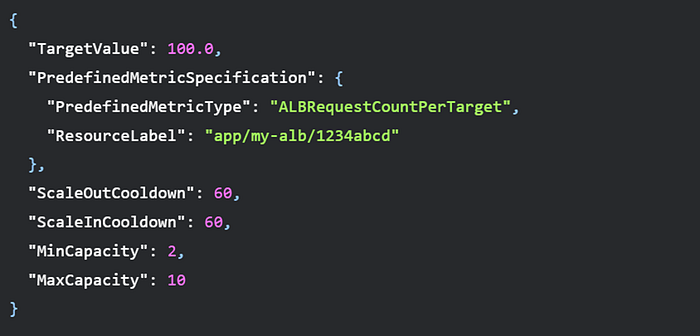
This configures the policy to:
- Target 100 requests per target on average
- Scale based on the ALBRequestCountPerTarget metric
- Set a cooldown of 60 seconds after scaling up or down
- Have a minimum of 2 ALB instances
- Have a maximum of 10 ALB instances
The "ResourceLabel" would need to be updated to match the actual resource ID of your ALB target group.
This JSON file could then be referenced in the CLI command to create the scaling policy:

The file provides an easy way to define the policy details in a reusable JSON format instead of directly in the CLI command.
Conclusion
In this tutorial, we went through the steps to set up dynamic scaling for an Application Load Balancer based on real-time user metrics.
The key was developing a custom CloudWatch metric that captures the current number of concurrent users connected to the system. This provides a more relevant signal for scaling compared to default traffic metrics like request counts.
We created a target tracking auto scaling policy that responds to changes in the user metric by adding or removing ALB capacity. CloudWatch alarms were used to trigger the scaling adjustments when the user count exceeded configured thresholds.
Together, these components enable the ALB to scale out seamlessly during traffic spikes and scale back down when demand drops. The end result is optimizing cost efficiency by providing just the right level of resources to match real user load.
Implementing custom metrics requires upfront work to design the right indicators and instrumentation. But the payoff is responsive scaling that aligns perfectly with your workload patterns. This helps maintain high performance while avoiding over-provisioning.
The same principles can be applied to scale any resource like EC2, containers, lambda functions, and more. Dynamic scaling based on custom metrics is a useful technique to keep systems stable and efficient. Use this tutorial as a blueprint when implementing auto scaling in your own AWS environments.