

We have seen a lot of interdisciplinary cross-overs with Data Science. This is one of my favorites. Why? The use cases are infinitive as Psychometrics meets Behavioral Analytics! Will it be as great as the crossover seen in the gif?
Well, let's see 😉
What is Item Response Theory?
In psychometrics, item response theory is a paradigm for the design, analysis, and scoring of tests, questionnaires, and similar instruments measuring abilities, attitudes, or other variables — Wikipedia [1]
Let's analyze this!
Why item and response?
Okay, let's imagine this. You and your partner have been blindfolded by a host and is asked to guess the food in front of you but only by licking it. Remember where this is from? 😂
Yes! That is exactly what will happen. The way you describe an item and how your partner would describe it could vary significantly. So, now if I have to analyze this what do I do? Hence the main objective revolves around the theory of the item. Think of it like trying to analyze something at the very atom level.
But if every item is different? How do we come to a consensus?
There are many ways to do this. It can be a multiple choice which has pre defined incorrect/ correct responses tailored to change according to your response, or statements which test one's response based on the a rating or Likert scale.
Hence, essentially these responses at their atom level, with the help of probability links an individual and his/her own item responses. In short, IRT models tries to relate the unobservable trait by analyzing their responses. These models can tell more about you than you!
Why not the whole test as unit?
Classical Test theory looks into the whole test as the unit of analysis as opposed to the notion of each item with IRT. The former is definitely reliable than its alternatives when you have responses with longer list of items.
- But what if you don't have that luxury for asking a long list of queries?
- Moreover, we all know how we feel when we fill long forms/questionnaires! It will impact your user's experience and in return your user story will crash down.
- Additionally what if you are releasing a new cutting edge product which you expect to disrupt the market with but have no validation as there is no representative sample to work with?
- Last but not least, scalability and flexibility! You might not know what you don't know when you venture into something new. So it would be great if you have the freedom to have different response categories to derive traits from.
With IRT models, measures with lesser items can be more reliable than their counterparts, they don't depend on a representative sample and items on a measure can have different response categories. — Columbia Edu [2]
Great! So can I use the model with no assumptions? Nope.
As with any other model, IRT too assumes some concepts to be able to adopted with:
1. Dominant Trait
We hunt for a good leader and hope that leader will guide us to our needs and happiness. Similarly the model presumes that there is one trait which is dominant and it is predominantly the force which motivates every other response of the measure.
2. Invariance
Remember flexibility mentioned above? Yes! you can estimate/extrapolate the parameters of an item from any point of your choice of the item response curve.
3. Local Independence
Every separate item's response are mutually independent provided there is a significant extent of capability.
4. Monotonous
Keep increasing! That's the motto of the model. Hence always assumes inherently that the ability of the trait is always increasing, which means that the probability of a "correct" response also increases!
Alright. But where is the cross over?
Behavioral Analytics is your answer!
Behavioral Analytics is a recent advancement in business analytics that reveals new insights into the behavior of consumers on Ecommerce platforms, online games, web and mobile applications and IoT — Wikipedia [3]
The right questions will lead you to the right cross over. The link of these two concepts answers a wide range of use cases such as:
- Is my product's vision and growth more aligned towards what my audience customer expects?
- Is the new version of my product working well with my A/B testing groups?
- Are my employees happy? As a company, are we aligned with what each of my employee expects?
- For products that are highly dependent on user preference and perceptional adjectives, am I able to classify my products into categories efficiently to improve my recommendations?
These are some of the use cases that IRT can answer for you provided you have a well crafted and distinctive test case.
But then what are these parameters, curves and how do we achieve the model?
Lets take a look at an example by using the famous PSC Job Satisfaction dataset [4]. The dataset is organized as a Likert scale of 1 to 8 from strongly agree to strongly disagree with 8 being N/A with a range of statement survey questions. It is in the format of three series A, B, C and the intention of this is to understand the impact of their job satisfaction.
The plots and codes are a snippet of my Kaggle notebook. You can find the whole analysis here. I used R for the development of this analysis.
Pre Model Check 1: Correlation
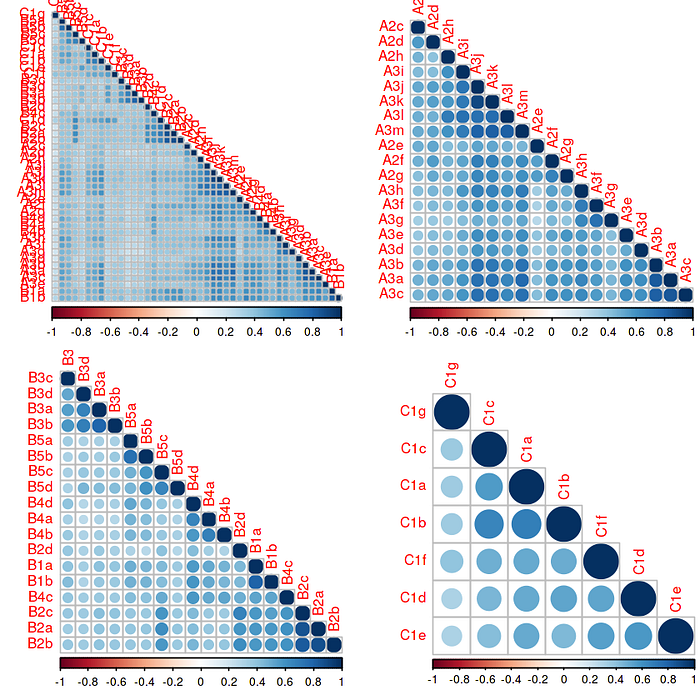
A general principle is that we can turn to correlation when we are yet to define the response variable alongside measuring the qualitative strength with direction of the relationship between two variables. In the following plot, the visualizations of correlations between all three series as an entity and as individual series themselves is seen. There exists strong positive correlations. Which establishes the assumption of that one dominant latent trait and all the items being interrelated to that one dominant latent trait.
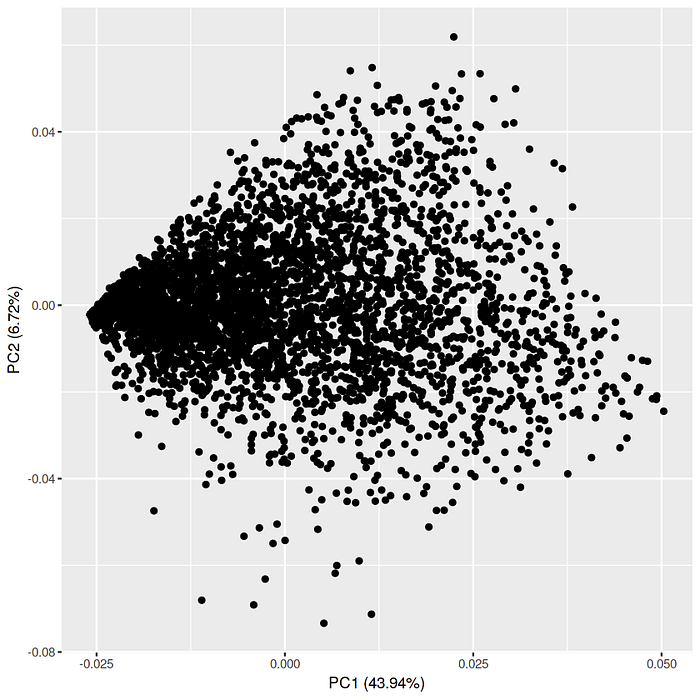
Pre Model Check 2: Principal Component Analysis (PCA)
Let's take a look at the respective PCA plot and Scree Plot.
PCA is a methodology that is used to reduce the dimensionality of the data. We can also use it for analyzing which component would contain most information post transformation. This way, we would know whether we need to approach in a unidimensional or multi dimensional way.
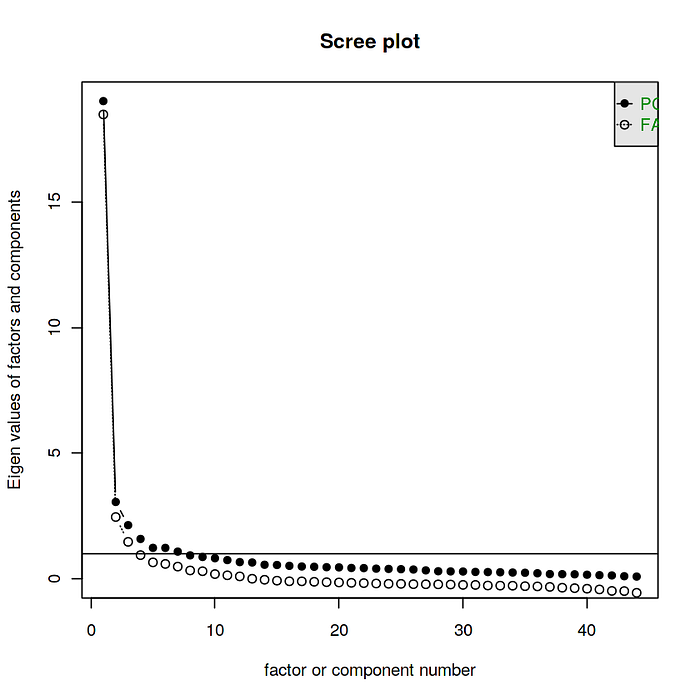
In multivariate statistics, a scree plot is a line plot of the eigenvalues of factors or principal components in an analysis and it is used to determine the number of factors to retain in an exploratory factor analysis (FA) or principal components to keep in a principal component analysis (PCA) — Wikipedia [5]
Both these plots suggests that a unidimensional approach is mathematically supportive. In general, based on years of research for this particular case a 40% or higher PC1 component can be sufficient to come to this conclusion. However this threshold is highly subjective.
What about the structure of the data?
Pre Model Check 3: Factor Model for underlying Structure
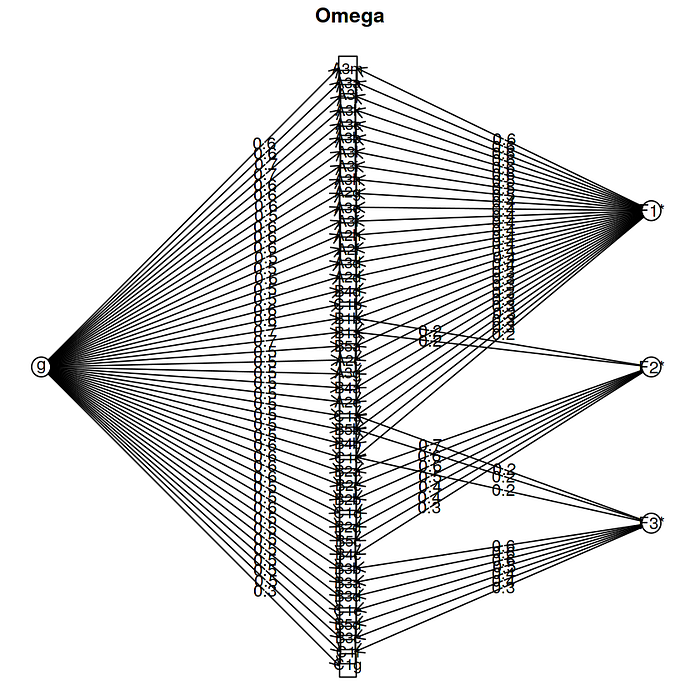
This plot depicts the underlying structure of the dataset. It is easily identifiable that the load factor is distributed within the three factors (A, B, C series). But IRT does not consider these underlying three structure and tries to follow the one dominant trait assumption which is the "latent trait".
Additionally, if you look closely into this plot you can see that item B2a appears to have a much higher load which is quite distinctive than the general trend, which could depict that this item could be super generalized and it is not able to be distinctive enough to be generalized into series. What if I decide to remove item B2a? Well then the whole structure would be different again and the analysis would be repeated. Further establishing the importance of having a well thought of item based approach, i.e. the qualitative aspect of it.
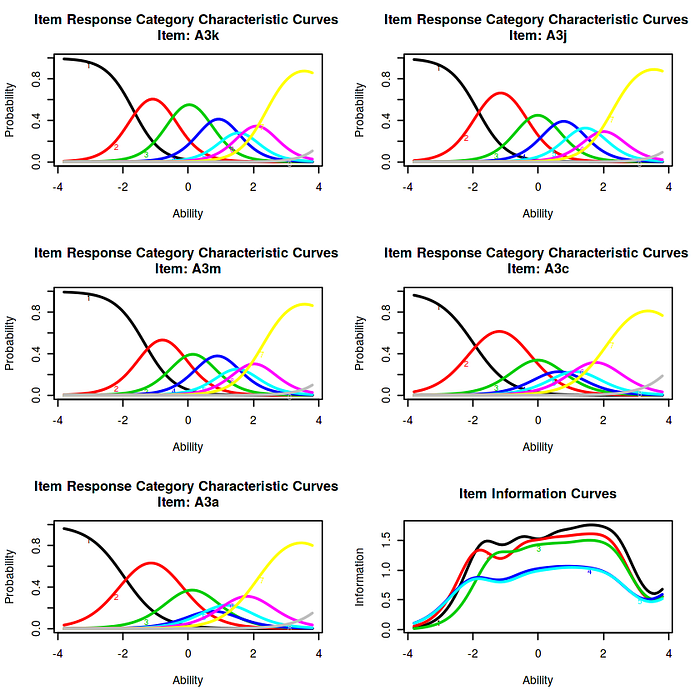
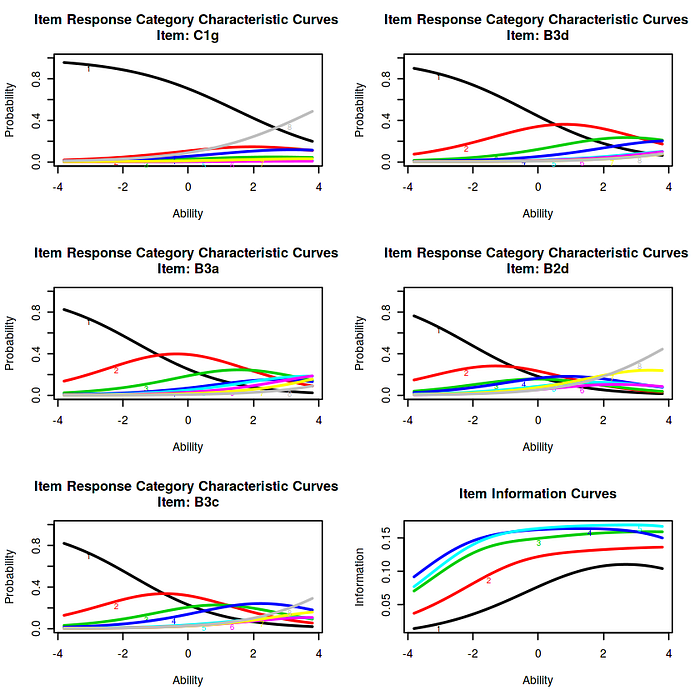
Graded Response Model
Since there is a particular order to the Likert scale and we want to measure a single underlying dimension, we will use the GRM model.
It allows us to evaluate/estimate the probability of a particular test subject's level of ability or latent trait, i.e., how well the test questions measure that latent trait or ability — Statisticshowto.com [6]
In an ideal scenario, the model should result in high discriminative power in order to arrive at a conclusion towards a good latent trait analysis. The model output is shown below:

Some insights on this output:
- The observed item response of these series is a function of the latent trait.
- The rating scale is treated as an ordered set and not interval sets.
- We can observe that there is a high discriminative powers in series A, low in C and somewhat average in B.
- The negative coefficients are due to reversed scaling.
- The low discriminative power in series C could suggest that the survey is lengthy and an individuals attention span has been lost to be able to focus. Same reason why A could reflect high discriminative powers.
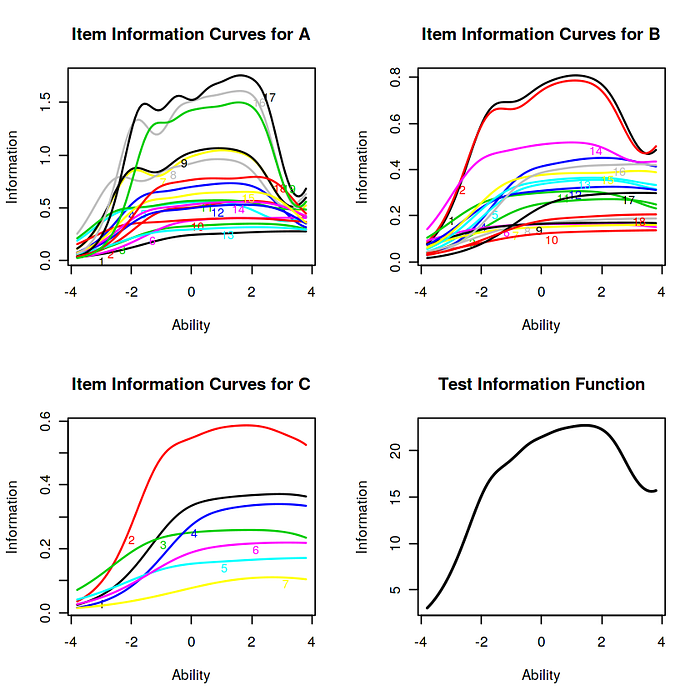
The x axis label is 'Ability' as the model depicts it as a accomplishment testing. In this case ability is our proposed latent trait.
As we interpreted rightly, we can notice a high information capability with series A followed by relatively high information capability for series B and least for series C. Hence we can conclude that the dataset contributes significantly in understanding the latent trait of job satisfaction.
If we focus on the first plot of A series, the plot with the highest discriminative power, we can see that it speaks of job dissatisfaction as the inherent ratings goes from strongly agree to strongly disagree. Hence individuals strongly agree that they are not satisfied i.e. the latent trait. For the B series however, the plots are not highly discriminative as they stoop low, which could mean low information for the particular item. This can be avoided by not generalizing the statement and improving the qualitative aspects of the statement.
And with that, I conclude my discussion on one of the amazing cross over's with data science I have come across! What are some other amazing interdisciplinary topics with Data Science that interests you guys? Feel free to drop it down on comments!
Hope this read was interesting. Excited to see how you would use IRT in your use cases 😊
Thanks!
References
[1] Wikipedia, Item Response Theory [2] Columbia Edu, Population Health Methods [3] Wikipedia, Behavioral Analytics [4] Kaggle, IRT Analysis Using Job Satisfaction Survey [5]Wikipedia, Scree plot [6] Statisticshowto.com, Graded Response Models [7] Towards Data Science (Medium), Facebook Analytics, Getting Started with Behavioral Analytics