
we will be deploying a Netflix clone. We will be using Jenkins as a CICD tool and deploying our application on a Docker container and Kubernetes Cluster and we will monitor the Jenkins and Kubernetes metrics using Grafana, Prometheus and Node exporter. I Hope this detailed blog is useful.
Git repo-https://github.com/rajeshmamuddu/Netflix-clone.git
Steps:-
Step 1 — Launch an Ubuntu(22.04) T2 Large Instance
Step 2 — Install Jenkins, Docker and Trivy. Create a Sonarqube Container using Docker.
Step 3 — Create a TMDB API Key.
Step 4 — Install Prometheus and Grafana On the new Server.
Step 5 — Install the Prometheus Plugin and Integrate it with the Prometheus server.
Step 6 — Email Integration With Jenkins and Plugin setup.
Step 7 — Install Plugins like JDK, Sonarqube Scanner, Nodejs, and OWASP Dependency Check.
Step 8 — Create a Pipeline Project in Jenkins using a Declarative Pipeline
Step 9 — Install OWASP Dependency Check Plugins
Step 10 — Docker Image Build and Push
Step 11 — Deploy the image using Docker
Step 12 — Kubernetes master and slave setup on Ubuntu (20.04)
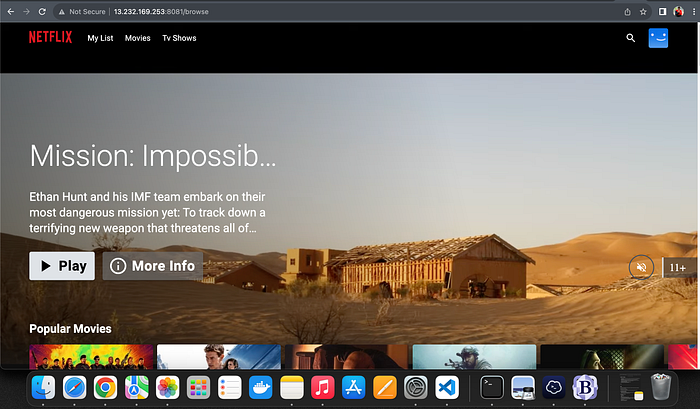
Step 13 — Access the Netflix app on the Browser.
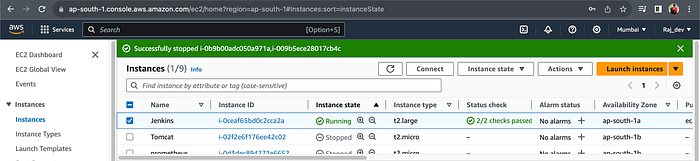
Step 14 — Terminate the AWS EC2 Instances.
Now, let's get started and dig deeper into each of these steps:-
STEP1:Launch an Ubuntu(22.04) T2 Large Instance
Launch an AWS T2 Large Instance. Use the image as Ubuntu. You can create a new key pair or use an existing one. Enable HTTP and HTTPS settings in the Security Group and open all ports (not best case to open all ports but just for learning purposes it's okay).
Step 2 — Install Jenkins, Docker and Trivy
To Install Jenkins
Connect to your console, and enter these commands to Install Jenkins
sudo apt update -y
sudo apt upgrade -y
wget -O - https://packages.adoptium.net/artifactory/api/gpg/key/public | tee /etc/apt/keyrings/adoptium.asc
echo "deb [signed-by=/etc/apt/keyrings/adoptium.asc] https://packages.adoptium.net/artifactory/deb $(awk -F= '/^VERSION_CODENAME/{print$2}' /etc/os-release) main" | tee /etc/apt/sources.list.d/adoptium.list
sudo apt update -y
sudo apt install temurin-17-jdk -y
/usr/bin/java --version
curl -fsSL https://pkg.jenkins.io/debian-stable/jenkins.io-2023.key | sudo tee \
                  /usr/share/keyrings/jenkins-keyring.asc > /dev/null
echo deb [signed-by=/usr/share/keyrings/jenkins-keyring.asc] \
                  https://pkg.jenkins.io/debian-stable binary/ | sudo tee \
                              /etc/apt/sources.list.d/jenkins.list > /dev/null
sudo apt-get update -y
sudo apt-get install jenkins -y
sudo systemctl start jenkins
sudo systemctl status jenkins
Once Jenkins is installed, you will need to go to your AWS EC2 Security Group and open Inbound Port 8080, since Jenkins works on Port 8080.
Now, grab your Public IP Address
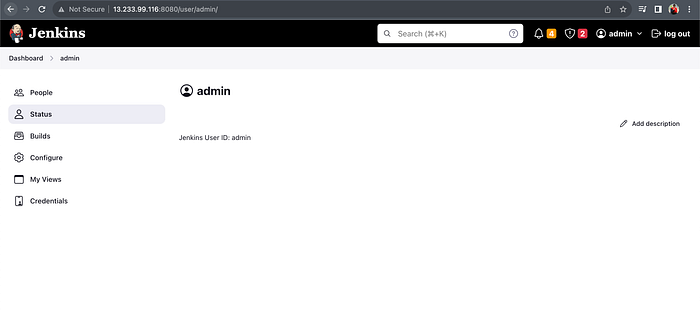
sudo cat /var/lib/jenkins/secrets/initialAdminPasswordUnlock Jenkins using an administrative password and install the suggested plugins.
Create a user click on save and continue.
Jenkins Getting Started Screen.
Install Docker on ec2-jenkins machine
sudo apt-get update
sudo apt-get install docker.io -y
sudo usermod -aG docker ubuntu
newgrp docker
sudo chmod 777 /var/run/docker.sock
After the docker installation, we create a sonarqube container (Remember to add 9000 ports in the security group).
docker run -d --name sonar -p 9000:9000 sonarqube:lts-community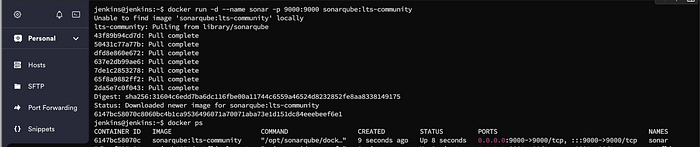
Now our sonarqube is up and running
Enter username and password, click on login and change password
username admin
password admin
Update New password, This is Sonar Dashboard.

Install Trivy
sudo apt-get install wget apt-transport-https gnupg lsb-release -y
wget -qO - https://aquasecurity.github.io/trivy-repo/deb/public.key | gpg --dearmor | sudo tee /usr/share/keyrings/trivy.gpg > /dev/null
echo "deb [signed-by=/usr/share/keyrings/trivy.gpg] https://aquasecurity.github.io/trivy-repo/deb $(lsb_release -sc) main" | sudo tee -a /etc/apt/sources.list.d/trivy.list
sudo apt-get update
sudo apt-get install trivy -y
Step 3: Create a TMDB API Key
Next, we will create a TMDB API key
Open a new tab in the Browser and search for TMDB
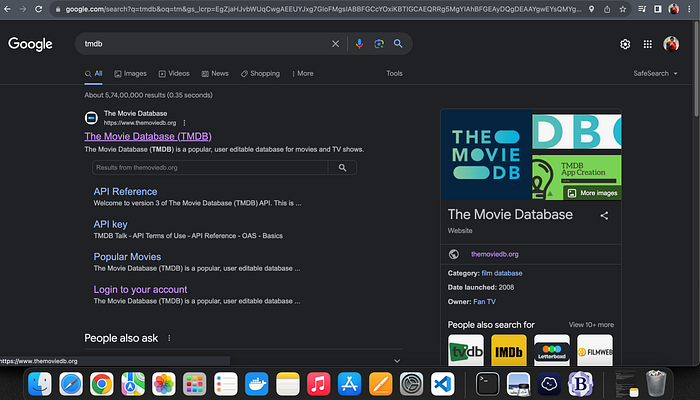
Click on the Login on the top right. You will get this page.
You need to create an account here. click on click here. I have account that's why i added my details there.
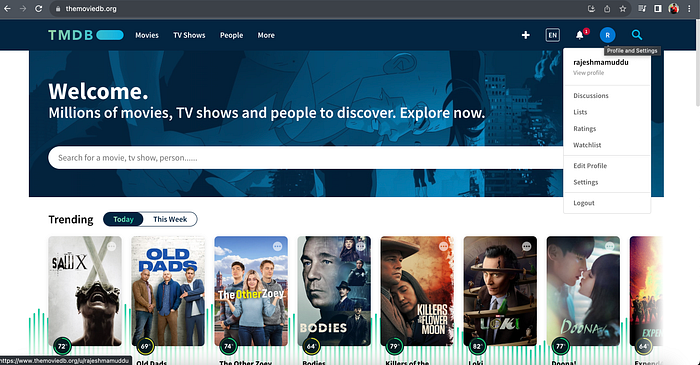
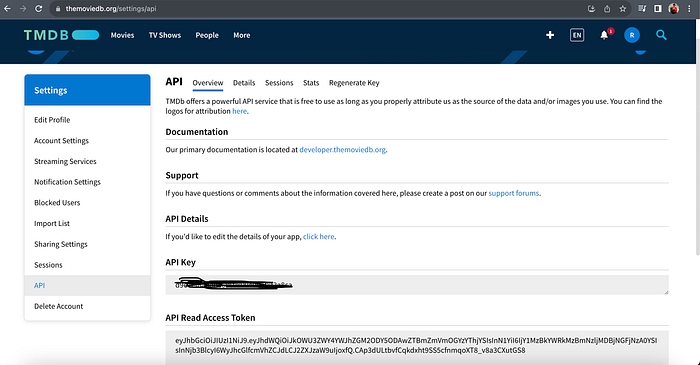
Once you go to the settings you will see the API from the left side panel.
Now click on create - Click on Developer-Provide basic details-Click on submit and you will get your API key.
Step 4 — Install Prometheus and Grafana On the new Server
First of all, let's create a dedicated Linux user sometimes called a system account for Prometheus. Having individual users for each service serves two main purposes:
It is a security measure to reduce the impact in case of an incident with the service.
It simplifies administration as it becomes easier to track down what resources belong to which service.
To create a system user or system account, run the following command
sudo useradd \
    --system \
    --no-create-home \
    --shell /bin/false prometheus
— system — Will create a system account. — no-create-home — We don't need a home directory for Prometheus or any other system accounts in our case. — shell /bin/false — It prevents logging in as a Prometheus user. Prometheus — Will create a Prometheus user and a group with the same name.
You can use the curl or wget command to download Prometheus.
wget https://github.com/prometheus/prometheus/releases/download/v2.47.1/prometheus-2.47.1.linux-amd64.tar.gzThen, we need to extract all Prometheus files from the archive.
tar -xvf prometheus-2.47.1.linux-amd64.tar.gzUsually, you would have a disk mounted to the data directory. For this tutorial, I will simply create a /data directory. Also, you need a folder for Prometheus configuration files.
sudo mkdir -p /data /etc/prometheusNow, let's change the directory to Prometheus and move some files.
cd prometheus-2.47.1.linux-amd64/First of all, let's move the Prometheus binary and a promtool to the /usr/local/bin/. promtool is used to check configuration files and Prometheus rules.
sudo mv prometheus promtool /usr/local/bin/Optionally, we can move console libraries to the Prometheus configuration directory. Console templates allow for the creation of arbitrary consoles using the Go templating language. You don't need to worry about it if you're just getting started.
sudo mv consoles/ console_libraries/ /etc/prometheus/Finally, let's move the example of the main Prometheus configuration file.
sudo mv prometheus.yml /etc/prometheus/prometheus.ymlTo avoid permission issues, you need to set the correct ownership for the /etc/prometheus/ and data directory.
sudo chown -R prometheus:prometheus /etc/prometheus/ /data/Verify that you can execute the Prometheus binary by running the following command:
prometheus --version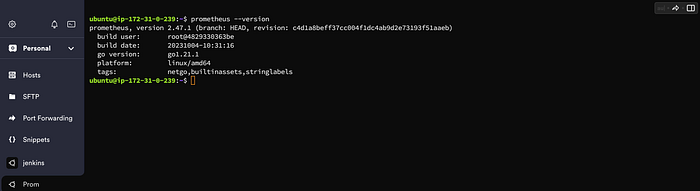
We're going to use some of these options in the service definition.
We're going to use Systemd, which is a system and service manager for Linux operating systems. For that, we need to create a Systemd unit configuration file
sudo vim /etc/systemd/system/prometheus.servicePrometheus.service
[Unit]
Description=Prometheus
Wants=network-online.target
After=network-online.target

StartLimitIntervalSec=500
StartLimitBurst=5

[Service]
User=prometheus
Group=prometheus
Type=simple
Restart=on-failure
RestartSec=5s
ExecStart=/usr/local/bin/prometheus \
  --config.file=/etc/prometheus/prometheus.yml \
  --storage.tsdb.path=/data \
  --web.console.templates=/etc/prometheus/consoles \
  --web.console.libraries=/etc/prometheus/console_libraries \
  --web.listen-address=0.0.0.0:9090 \
  --web.enable-lifecycle

[Install]
WantedBy=multi-user.target
Let's go over a few of the most important options related to Systemd and Prometheus. Restart — Configures whether the service shall be restarted when the service process exits, is killed, or a timeout is reached. RestartSec — Configures the time to sleep before restarting a service. User and Group — Are Linux user and a group to start a Prometheus process. — config.file=/etc/prometheus/prometheus.yml — Path to the main Prometheus configuration file. — storage.tsdb.path=/data — Location to store Prometheus data. — web.listen-address=0.0.0.0:9090 — Configure to listen on all network interfaces. In some situations, you may have a proxy such as nginx to redirect requests to Prometheus. In that case, you would configure Prometheus to listen only on localhost. — web.enable-lifecycle — Allows to manage Prometheus, for example, to reload configuration without restarting the service.
To automatically start the Prometheus after reboot, run enable.
sudo systemctl enable prometheusThen just start the Prometheus.
sudo systemctl start prometheusTo check the status of Prometheus run the following command:
sudo systemctl status Prometheus
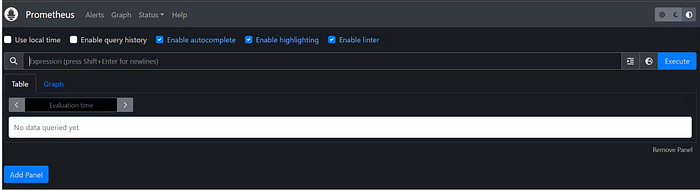
Now we can try to access it via the browser. I'm going to be using the IP address of the Ubuntu server. You need to append port 9090 to the IP.
Install Node Exporter on Ubuntu 22.04
Next, we're going to set up and configure Node Exporter to collect Linux system metrics like CPU load and disk I/O. Node Exporter will expose these as Prometheus-style metrics. Since the installation process is very similar, I'm not going to cover as deep as Prometheus.
First, let's create a system user for Node Exporter by running the following command:
sudo useradd \
    --system \
    --no-create-home \
    --shell /bin/false node_exporter
Use the wget command to download the binary.
wget https://github.com/prometheus/node_exporter/releases/download/v1.6.1/node_exporter-1.6.1.linux-amd64.tar.gzExtract the node exporter from the archive.
C
tar -xvf node_exporter-1.6.1.linux-amd64.tar.gz
Move binary to the /usr/local/bin. sudo mv \ node_exporter-1.6.1.linux-amd64/node_exporter \ /usr/local/bin/
Clean up, and delete node_exporter archive and a folder.
rm -rf node_exporter*Verify that you can run the binary.
node_exporter --version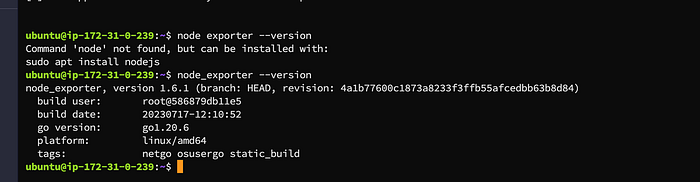
Node Exporter has a lot of plugins that we can enable. If you run Node Exporter help you will get all the options.
Next, create a similar systemd unit file.
sudo vim /etc/systemd/system/node_exporter.servicenode_exporter.service
[Unit]
Description=Node Exporter
Wants=network-online.target
After=network-online.target

StartLimitIntervalSec=500
StartLimitBurst=5

[Service]
User=node_exporter
Group=node_exporter
Type=simple
Restart=on-failure
RestartSec=5s
ExecStart=/usr/local/bin/node_exporter \
    --collector.logind

[Install]
WantedBy=multi-user.target
Replace Prometheus user and group to node_exporter, and update the ExecStart command.
To automatically start the Node Exporter after reboot, enable the service.
sudo systemctl enable node_exporterCheck the status of Node Exporter with the following command:
sudo systemctl status node_exporter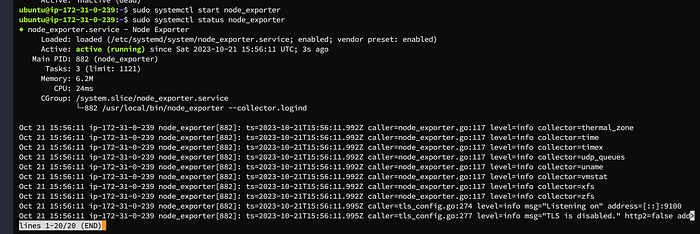
To create a static target, you need to add job_name with static_configs.
sudo vim /etc/prometheus/prometheus.ymlprometheus.yml
- job_name: node_export
    static_configs:
      - targets: ["localhost:9100"]
By default, Node Exporter will be exposed on port 9100.
Since we enabled lifecycle management via API calls, we can reload the Prometheus config without restarting the service and causing downtime.
Before, restarting check if the config is valid.
promtool check config /etc/prometheus/prometheus.ymlThen, you can use a POST request to reload the config.
curl -X POST http://localhost:9090/-/reloadCheck the targets section
http://<ip>:9090/targets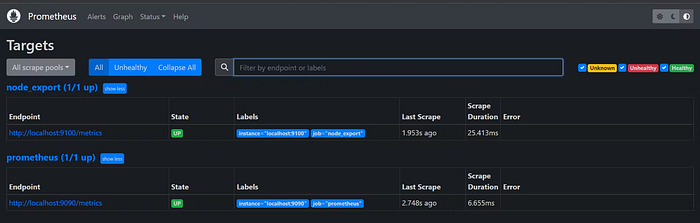
Install Grafana on Ubuntu 22.04
To visualize metrics we can use Grafana. There are many different data sources that Grafana supports, one of them is Prometheus.
First, let's make sure that all the dependencies are installed.
sudo apt-get install -y apt-transport-https software-properties-commonNext, add the GPG key.
wget -q -O - https://packages.grafana.com/gpg.key | sudo apt-key add -Add this repository for stable releases.
echo "deb https://packages.grafana.com/oss/deb stable main" | sudo tee -a /etc/apt/sources.list.d/grafana.listAfter you add the repository, update and install Garafana.
sudo apt-get update
sudo apt-get -y install grafana
To automatically start the Grafana after reboot, enable the service.
sudo systemctl enable grafana-serverTo check the status of Grafana, run the following command:
sudo systemctl status grafana-server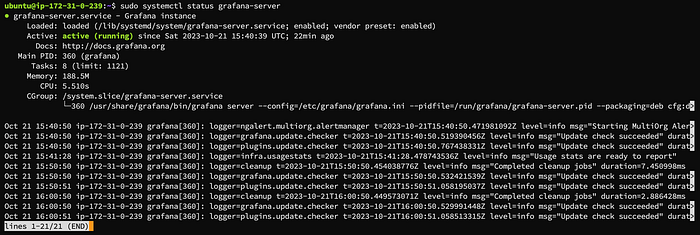
Go to http://<ip>:3000 and log in to the Grafana using default credentials. The username is admin, and the password is admin as well.
username admin
password admin
When you log in for the first time, you get the option to change the password.
To visualize metrics, you need to add a data source first.
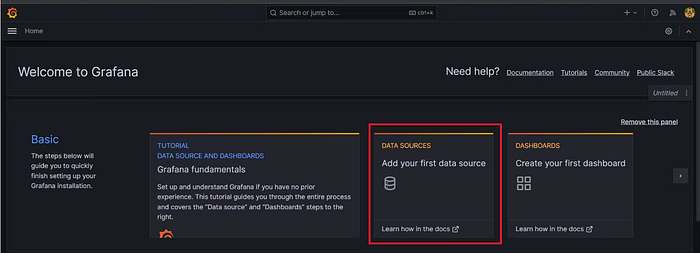
Click Add data source and select Prometheus.
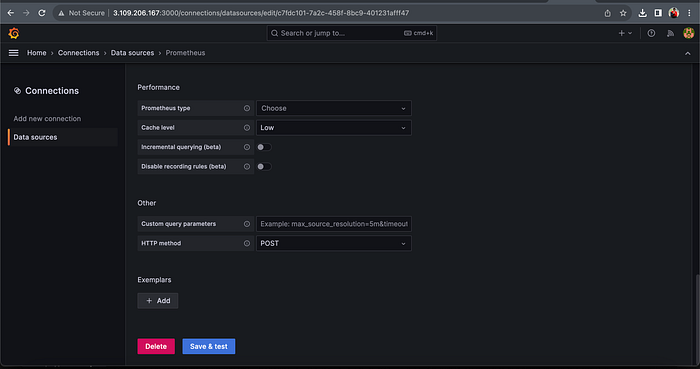
For the URL, enter localhost:9090 and click Save and test. You can see Data source is working.
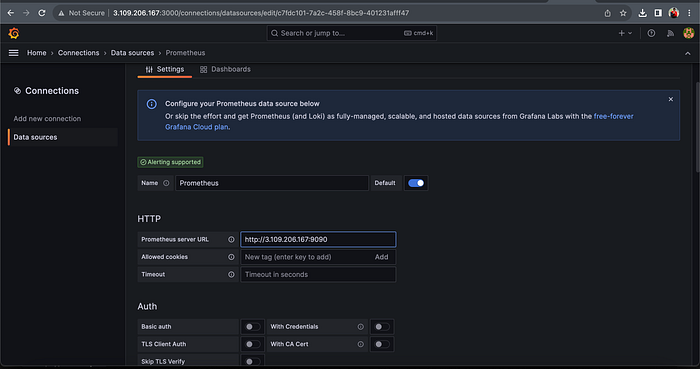
Click on Save and Test.
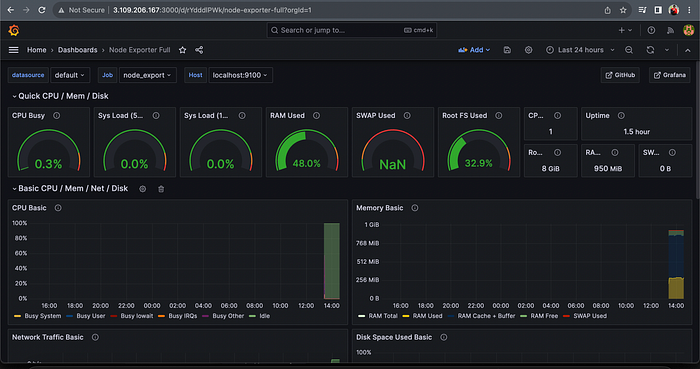
Let's add Dashboard for a better view
Click on Import Dashboard paste this code 1860 and click on load
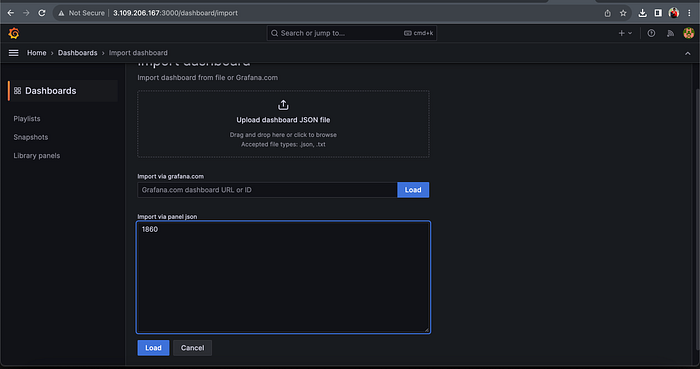
Select the Datasource as Prometheus and click on Import
You will see this output
Step 5 — Install the Prometheus Plugin and Integrate it with the Prometheus server
Let's Monitor JENKINS SYSTEM
Need Jenkins up and running machine
Goto Manage Jenkins → Plugins → Available Plugins
Search for Prometheus and install it
Once that is done you will Prometheus is set to /Prometheus path in system configurations
Nothing to change click on apply and save
To create a static target, you need to add job_name with static_configs. go to Prometheus server
sudo vim /etc/prometheus/prometheus.yml
- job_name: 'jenkins'
    metrics_path: '/prometheus'
    static_configs:
      - targets: ['<jenkins-ip>:8080']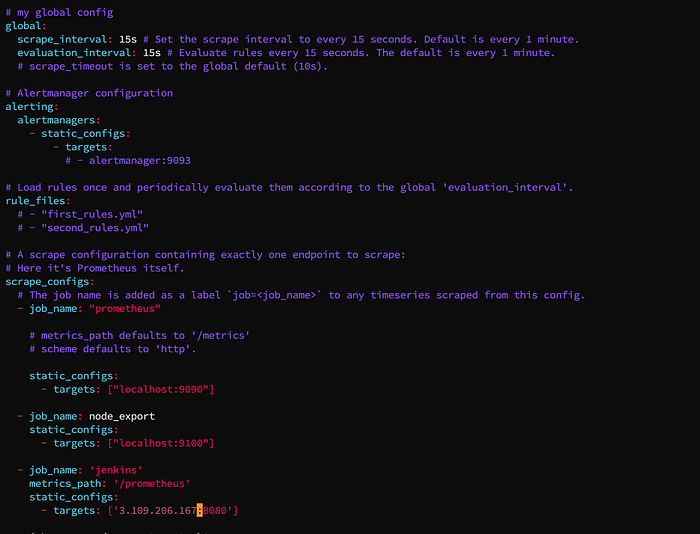
http://<ip>:9090/targets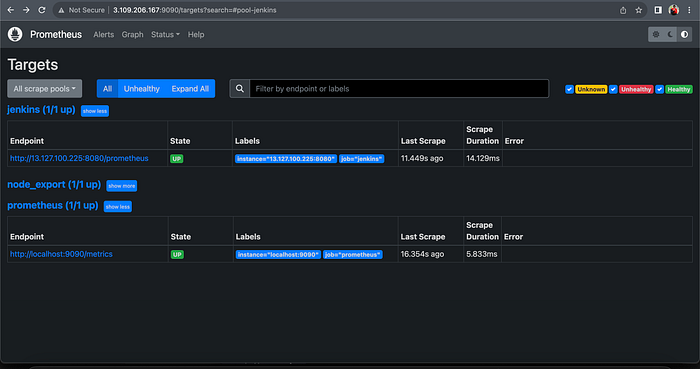
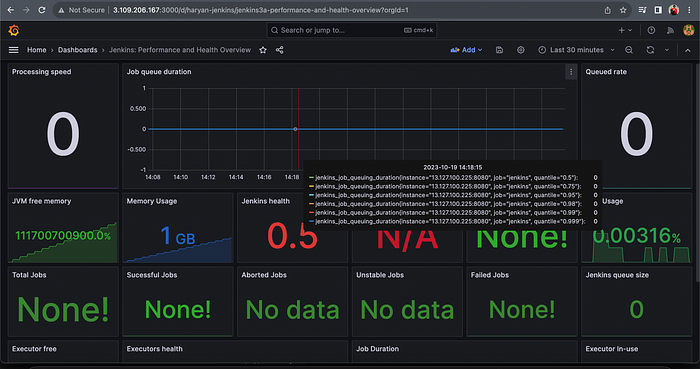
Let's add Dashboard for a better view in Grafana
Click On Dashboard → + symbol → Import Dashboard
Use Id 9964 and click on load
Step 6— Install Plugins like JDK, Sonarqube Scanner, NodeJs, OWASP Dependency Check
— Install Plugin
Goto Manage Jenkins →Plugins → Available Plugins →
Install below plugins
1 → Eclipse Temurin Installer (Install without restart)
2 → SonarQube Scanner (Install without restart)
3 → NodeJs Plugin (Install Without restart)
Configure Java and Nodejs in Global Tool Configuration
Goto Manage Jenkins → Tools → Install JDK(17) and NodeJs(16)→ Click on Apply and Save
Create a Job
create a job as Netflix Name, select pipeline and click on ok.
Step 7— Configure Sonar Server in Manage Jenkins
Grab the Public IP Address of your EC2 Instance, Sonarqube works on Port 9000, so <Public IP>:9000. Goto your Sonarqube Server. Click on Administration → Security → Users → Click on Tokens and Update Token → Give it a name → and click on Generate Token
click on update Token
Create a token with a name and generate
copy Token
Goto Jenkins Dashboard → Manage Jenkins → Credentials → Add Secret Text. It should look like this
You will this page once you click on create
Now, go to Dashboard → Manage Jenkins → System and Add like the below image.
Click on Apply and Save
The Configure System option is used in Jenkins to configure different server
Global Tool Configuration is used to configure different tools that we install using Plugins
We will install a sonar scanner in the tools.
In the Sonarqube Dashboard add a quality gate also
Administration → Configuration →Webhooks
Click on Create
<http://jenkins-public-ip:8080>/sonarqube-webhook/Let's go to our Pipeline and add the script in our Pipeline Script.
pipeline{
agent any
tools{
jdk 'jdk17'
nodejs 'node16'
}
environment {
SCANNER_HOME=tool 'sonar-scanner'
}
stages {
stage('clean workspace'){
steps{
cleanWs()
}
}
stage('Checkout from Git'){
steps{
git branch: 'main', url: 'https://github.com/rajeshmamuddu/Netflix-clone.git'
}
}
stage("Sonarqube Analysis "){
steps{
withSonarQubeEnv('sonar-server') {
sh ''' $SCANNER_HOME/bin/sonar-scanner -Dsonar.projectName=Netflix \
-Dsonar.projectKey=Netflix '''
}
}
}
stage("quality gate"){
steps {
script {
waitForQualityGate abortPipeline: false, credentialsId: 'Sonar-token'
}
}
}
stage('Install Dependencies') {
steps {
sh "npm install"
}
}
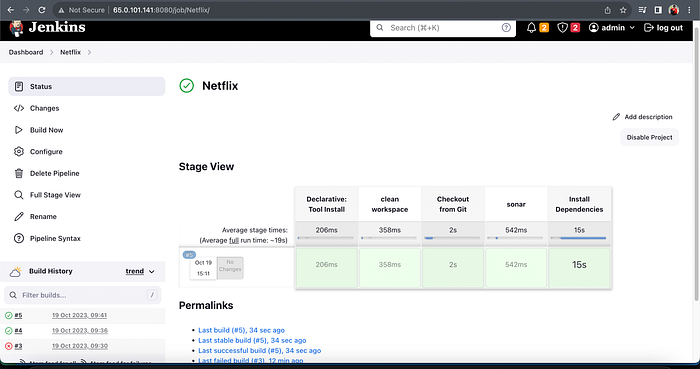
}Click on Build now, you will see the stage view like this
To see the report, you can go to Sonarqube Server and go to Projects.
You can see the report has been generated and the status shows as passed. You can see that there are 3.2k lines it scanned. To see a detailed report, you can go to issues.
Step 8— Install OWASP Dependency Check Plugins
GotoDashboard → Manage Jenkins → Plugins → OWASP Dependency-Check. Click on it and install it without restart.
First, we configured the Plugin and next, we had to configure the Tool
Goto Dashboard → Manage Jenkins → Tools →
Click on Apply and Save here.
Now go configure → Pipeline and add this stage to your pipeline and build.
stage('OWASP FS SCAN') {
            steps {
                dependencyCheck additionalArguments: '--scan ./ --disableYarnAudit --disableNodeAudit', odcInstallation: 'DP-Check'
                dependencyCheckPublisher pattern: '**/dependency-check-report.xml'
            }
        }
        stage('TRIVY FS SCAN') {
            steps {
                sh "trivy fs . > trivyfs.txt"
            }

Build view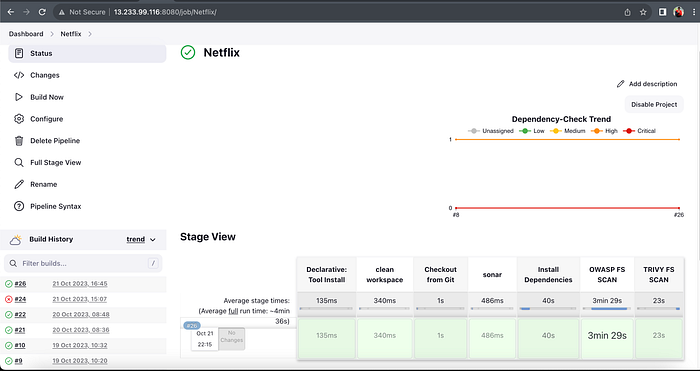
Step 9— Docker Image Build and PushWe need to install the Docker tool in our system, Goto Dashboard → Manage Plugins → Available plugins → Search for Docker and install these plugins
Docker
Docker Commons
Docker Pipeline
Docker API
docker-build-step
and click on install without restart
Now, goto Dashboard → Manage Jenkins → Tools →
Add DockerHub Username and Password under Global Credentials
Add this stage to Pipeline Script
stage("Docker Build & Push"){
steps{
script{
withDockerRegistry(credentialsId: 'docker', toolName: 'docker'){
sh "docker build --build-arg TMDB_V3_API_KEY=Aj795192152334x -t netflix ."
sh "docker tag netflix rajesh4851/netflix:latest "
sh "docker push rajesh4851/netflix:latest "
}
}
}
}
stage('Deploy to container'){
steps{
sh 'docker run -d --name netflix -p 8081:80 rajesh4851/netflix:latest'
}
}
stage("TRIVY"){
steps{
sh "trivy image rajesh4851/netflix:latest > trivyimage.txt"
}
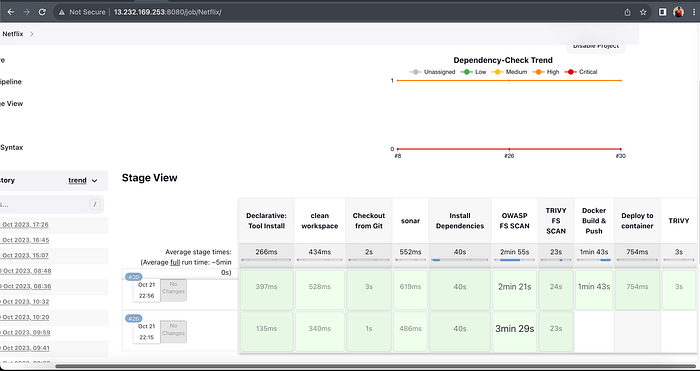
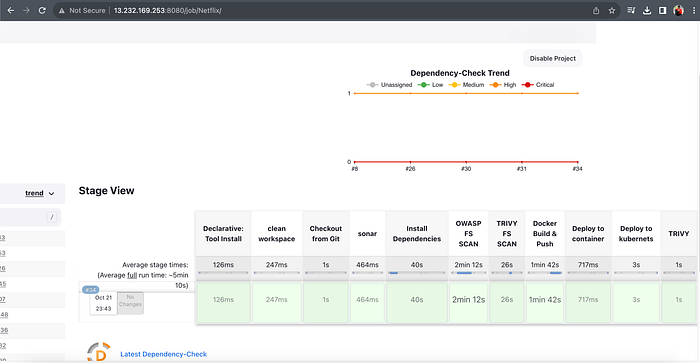
}You will see the output below, with a dependency trend once you start build now.
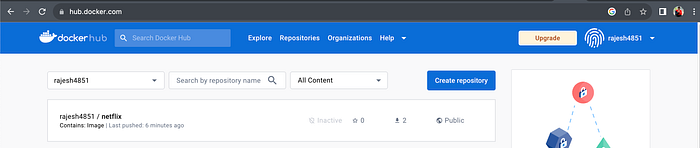
When you log in to Dockerhub, you will see a new image is created
<Jenkins-public-ip:8081>
You will get this output without API
Step 10 — Kuberenetes Setup
Connect your machines to Putty or Mobaxtreme
Take-Two Ubuntu 20.04 instances one for k8s master and the other one for worker.
Install Kubectl on Jenkins machine also
Kubectl is to be installed on Jenkins also
sudo apt update
sudo apt install curl
curl -LO https://dl.k8s.io/release/$(curl -L -s https://dl.k8s.io/release/stable.txt)/bin/linux/amd64/kubectl
sudo install -o root -g root -m 0755 kubectl /usr/local/bin/kubectl
kubectl version --client
Part 1 — — — — — Master Node — — — — — —
sudo hostnamectl set-hostname K8s-Master— — — — — Worker Node — — — — — —
sudo hostnamectl set-hostname K8s-Worker— — — — Apply on Both Master & Node — — — — — —
sudo apt-get update

sudo apt-get install -y docker.io
sudo usermod –aG docker Ubuntu
newgrp docker
sudo chmod 777 /var/run/docker.sock

sudo curl -s https://packages.cloud.google.com/apt/doc/apt-key.gpg | sudo apt-key add -

sudo tee /etc/apt/sources.list.d/kubernetes.list <<EOF
deb https://apt.kubernetes.io/ kubernetes-xenial main
EOF

sudo apt-get update

sudo apt-get install -y kubelet kubeadm kubectl

sudo snap install kube-apiserver
— — — — — — — — Master — — — — — — — -
sudo kubeadm init --pod-network-cidr=10.244.0.0/16
# in case your in root exit from it and run below commands
mkdir -p $HOME/.kube
sudo cp -i /etc/kubernetes/admin.conf $HOME/.kube/config
sudo chown $(id -u):$(id -g) $HOME/.kube/config
kubectl apply -f https://raw.githubusercontent.com/coreos/flannel/master/Documentation/kube-flannel.yml
— — — — — Worker Node — — — — — —
sudo kubeadm join <master-node-ip>:<master-node-port> --token <token> --discovery-token-ca-cert-hash <hash>Copy the config file to Jenkins master or the local file manager and save it
by typing the command as cd. kube then cat config
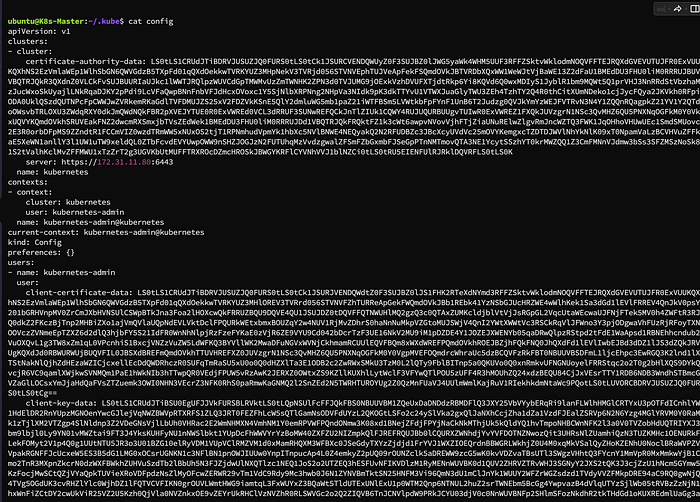
opy it and save it in documents or another folder save it as secret-file.txt
Note: create a secret-file.txt in your file explorer save the config in it and use this at the kubernetes credential section.
Install Kubernetes Plugin, Once it's installed successfully
goto manage Jenkins → manage credentials → Click on Jenkins global → add credentials
final step to deploy on the Kubernetes cluster
stage('Deploy to kubernets'){
            steps{
                script{
                    dir('Kubernetes') {
                        withKubeConfig(caCertificate: '', clusterName: '', contextName: '', credentialsId: 'k8s', namespace: '', restrictKubeConfigAccess: false, serverUrl: '') {
                                sh 'kubectl apply -f deployment.yml'
                                sh 'kubectl apply -f service.yml'
                        }
                    }
                }
            }
        }
Here we go with API refresh the page you can able to stream with video ,audio.

Hope you like this interesting project please follow for more projects.