
Simply focusing on one metric when selecting stocks may not suffice. Multi-factor stock screening allows investors to analyze multiple indicators simultaneously to identify the best investment opportunities. In this article, I will show you how to build a powerful stock screening tool using Python that considers key financial metrics like the Price-to-Earnings (P/E) ratio, Earnings Per Share (EPS) growth, and the Price/Earnings to Growth (PEG) ratio.
Why This is Important
In the world of investing, simply looking at one financial metric often doesn't give the full picture of a stock's value. The stock market is dynamic, and various factors impact the performance of a stock, including valuation, growth, and profitability. Relying solely on the Price-to-Earnings (P/E) ratio, for example, can lead to misleading conclusions. A stock with a low P/E ratio might seem cheap, but it could also signal underlying issues in the business. Conversely, a high P/E ratio doesn't necessarily mean a stock is overpriced if the company is growing quickly.
This is where multi-factor screening becomes crucial. By evaluating multiple metrics simultaneously, you can form a more comprehensive understanding of a company's overall health and investment potential. In this Python-based stock screener, we use three key metrics to assess a stock's attractiveness:
- P/E Ratio — Tells us if a stock is relatively cheap or expensive.
- EPS Growth — Gives insight into how fast a company's profits are growing.
- PEG Ratio — Combines the P/E ratio with growth expectations, giving a clearer picture of whether a stock is over or undervalued relative to its growth.
Using these metrics together, you can avoid the risk of focusing too much on one aspect and gain a broader perspective on the stock's performance potential. This method is particularly valuable for investors who want to maximize returns while minimizing risk, whether you're a long-term investor or a trader.
nputs
Stock Tickers: These are the symbols that represent the stocks of companies we want to analyze. In this case, we'll use well-known large-cap stocks like AAPL (Apple), MSFT (Microsoft), GOOGL (Google), and others. These stocks are from major indices like the S&P 500, which ensures we're focusing on established companies with reliable data.
Financial Metrics:
- P/E Ratio: This is the Price-to-Earnings ratio, calculated as the stock price divided by its earnings per share (EPS). It shows how much investors are willing to pay for each dollar of a company's earnings. A lower P/E ratio may indicate that the stock is undervalued, while a higher P/E ratio could indicate overvaluation.
- EPS Growth: The Earnings Per Share (EPS) growth measures the rate at which a company's earnings are growing over time. Companies with high EPS growth are generally seen as more attractive because they're expanding and increasing profitability.
- PEG Ratio: The Price/Earnings to Growth (PEG) ratio combines the P/E ratio with expected growth rates, providing a more complete picture of the stock's valuation relative to its growth potential. A PEG ratio below 1 suggests the stock may be undervalued given its growth prospects, while a PEG ratio above 1 indicates it may be overvalued.
Stock Universe: The stock universe refers to the collection of stocks that we will analyze. In this script, we're focusing on large-cap stocks from major indices like the S&P 500.
Outputs
Screened Stock List: After running the analysis, the script will generate a table that displays the selected stocks along with their corresponding P/E ratio, EPS growth, PEG ratio, and a final recommendation.
Recommendation: The final recommendation for each stock will be based on the PEG ratio and will include one of the following:
- Buy: If the stock is undervalued relative to its growth potential.
- Hold: If the stock is fairly valued but doesn't present immediate buying opportunities.
- Sell: If the stock is overvalued based on the metrics.
Feature Explanation
P/E Ratio (Price-to-Earnings Ratio):
- The P/E ratio is one of the most widely used valuation metrics in the stock market. It indicates how much investors are willing to pay for each dollar of a company's earnings.
- Example: If a stock has a P/E ratio of 15, investors are willing to pay $15 for every $1 of the company's earnings.
- Low P/E ratios might indicate undervalued stocks, but they could also mean the company is struggling.
- High P/E ratios suggest strong growth potential but could also signal overvaluation.
EPS Growth (Earnings Per Share Growth):
- EPS growth measures how much a company's earnings have grown over a certain period. Consistent and high EPS growth usually means that a company is expanding its profitability.
- High EPS growth is typically seen as a positive sign because it reflects a company's ability to increase earnings over time.
PEG Ratio (Price/Earnings to Growth Ratio):
- The PEG ratio is more comprehensive than the P/E ratio because it accounts for the company's earnings growth.
- PEG Ratio < 1: Typically indicates that the stock is undervalued relative to its growth, making it an attractive investment.
- PEG Ratio > 1: Suggests that the stock may be overvalued considering its growth potential.
Enough with prep-work, let's move to the code
import yfinance as yf
import pandas as pd
import numpy as np
import streamlit as st

def get_sp500_tickers():
    url = "https://en.wikipedia.org/wiki/List_of_S%26P_500_companies"
    table = pd.read_html(url)
    sp500_tickers = table[0]['Symbol'].tolist()
    return sp500_tickers
Importing Libraries:
- We're using the
yfinancelibrary to retrieve financial data for the stocks. This is a widely-used API for stock data, making it reliable and accessible for real-world applications. pandashelps us store and manipulate the stock data, whilestreamlitallows for an interactive and user-friendly interface.
Defining the Stock Tickers:
- We use SP500 stock name acquisition for popular large-cap stocks for the screening. These are well-known companies that are likely to be on most investors' watchlists.
def calculate_peg(pe_ratio, eps_growth):
    try:
        return pe_ratio / eps_growth
    except ZeroDivisionError:
        return np.nan

# Function to get fundamental data
def get_fundamentals(ticker):
    stock = yf.Ticker(ticker)
    pe_ratio = stock.info.get('trailingPE', np.nan)  # Handle missing trailingPE
    eps_growth = stock.info.get('earningsGrowth', np.nan)  # Handle missing earningsGrowth
    peg_ratio = calculate_peg(pe_ratio, eps_growth)
    return pe_ratio, eps_growth, peg_ratio

# Create DataFrame for results
results = pd.DataFrame(columns=['Ticker', 'P/E Ratio', 'EPS Growth', 'PEG Ratio', 'Recommendation'])

# Define screening criteria
def screening_criteria(pe_ratio, eps_growth, peg_ratio):
    if pe_ratio and eps_growth and peg_ratio:
        if peg_ratio < 1:
            return 'Buy'
        elif peg_ratio < 2:
            return 'Hold'
        else:
            return 'Sell'
    return 'Insufficient Data'

def get_technical_indicators(ticker):
    stock = yf.Ticker(ticker)
    df = stock.history(period="6mo")
    sma_50 = df['Close'].rolling(window=50).mean().iloc[-1]
    sma_200 = df['Close'].rolling(window=200).mean().iloc[-1]
    rsi = calculate_rsi(df['Close'], 14).iloc[-1]
    return sma_50, sma_200, rsi

# Function to calculate RSI
def calculate_rsi(prices, period):
    delta = prices.diff(1)
    gain = (delta.where(delta > 0, 0)).fillna(0)
    loss = (-delta.where(delta < 0, 0)).fillna(0)
    avg_gain = gain.rolling(window=period, min_periods=1).mean()
    avg_loss = loss.rolling(window=period, min_periods=1).mean()
    rs = avg_gain / avg_loss
    rsi = 100 - (100 / (1 + rs))
    return rsi
Retrieving Financial Metrics:
- The functions above define set of our important metrics for screening retrieves the P/E ratio, EPS growth, PEG ratio and other fundamental metrics for each stock from Yahoo Finance. We use the
infoattribute of theyfinancelibrary to get these values.
Screening Criteria:
- The
screening_criteriafunction evaluates the stock based on the PEG ratio. Stocks with a PEG ratio below 1 are considered undervalued and marked as "Buy". Stocks with a PEG ratio between 1 and 2 are labeled "Hold", while stocks with PEG ratios above 2 are flagged as "Sell".
# Streamlit dashboard setup
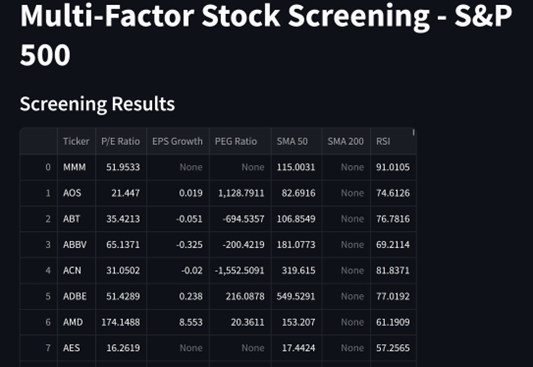
st.title("Multi-Factor Stock Screening - S&P 500")
# Fetch S&P 500 tickers
tickers = get_sp500_tickers()
# List to store results
results = []
# Loop through each stock ticker
for ticker in tickers:
try:
pe_ratio, eps_growth, peg_ratio = get_fundamentals(ticker)
sma_50, sma_200, rsi = get_technical_indicators(ticker)
# Append the results to the list
results.append({
'Ticker': ticker,
'P/E Ratio': pe_ratio,
'EPS Growth': eps_growth,
'PEG Ratio': peg_ratio,
'SMA 50': sma_50,
'SMA 200': sma_200,
'RSI': rsi
})
except Exception as e:
print(f"Error processing {ticker}: {e}")After acquisition of all the data, we're preparing Streamlit platform for the display within the data format.
# Convert the list of results to a DataFrame
results_df = pd.DataFrame(results)

# Display the results
st.write("### Screening Results")
st.dataframe(results_df)

# Highlight top stocks based on specific criteria
top_stocks = results_df[(results_df['PEG Ratio'] < 1) & (results_df['RSI'] < 30)]
st.write("### Top Stocks Based on Criteria")
st.dataframe(top_stocks)
Lastly we display our results in a nicely shaped Streamlit table.
And the results….
Conclusion
By combining multiple financial metrics, this multi-factor stock screening approach allows you to gain a clearer understanding of a stock's value and growth potential. It helps investors avoid the risks of over-reliance on just one metric and provides a balanced view of both the valuation and growth of a company. With this Python tool, investors can make smarter, data-driven decisions to find the best stocks for their portfolio.
Complete code:
# Loop through each stock ticker
for ticker in tickers:
    try:
        pe_ratio, eps_growth, peg_ratio = get_fundamentals(ticker)
        sma_50, sma_200, rsi = get_technical_indicators(ticker)
        # Append the results to the list
        results.append({
            'Ticker': ticker,
            'P/E Ratio': pe_ratio,
            'EPS Growth': eps_growth,
            'PEG Ratio': peg_ratio,
            'SMA 50': sma_50,
            'SMA 200': sma_200,
            'RSI': rsi
        })
    except Exception as e:
        print(f"Error processing {ticker}: {e}")

# Convert the list of results to a DataFrame
results_df = pd.DataFrame(results)

# Display the results
st.write("### Screening Results")
st.dataframe(results_df)

# Highlight top stocks based on specific criteria
top_stocks = results_df[(results_df['PEG Ratio'] < 1) & (results_df['RSI'] < 30)]
st.write("### Top Stocks Based on Criteria")
st.dataframe(top_stocks)
Hope you enjoyed this little exercise.
My TG channel for Python Codes is https://t.me/PythonScriptsFinance
My Youtube channel for Python scripts is https://www.youtube.com/@PythonFinance-t3b. Would be happy to see you all there. Subscribe and stay tuned for more fun scripts and codes.
Happy Cod-vesting!