
Introduction
Imagine you're a Data Engineer working on a real-time analytics pipeline processing millions of transactions per hour. Suddenly, queries slow down, jobs fail due to memory overload, and joins take forever to execute. Why? Because PySpark is powerful, but achieving peak performance requires knowing when and how to tune.
Apache Spark has become a cornerstone in big data processing, and PySpark (Spark's Python API) allows engineers to work with distributed data efficiently. However, working with large datasets at scale comes with challenges: slow transformations, inefficient joins, data skew, and poor query performance.
This article isn't just a theoretical guide — it's a practical deep dive into common PySpark bottlenecks and how to solve them. We'll cover essential transformations, performance tuning strategies, and best practices that every junior to mid-level Data Engineer should understand when working with PySpark in production environments.
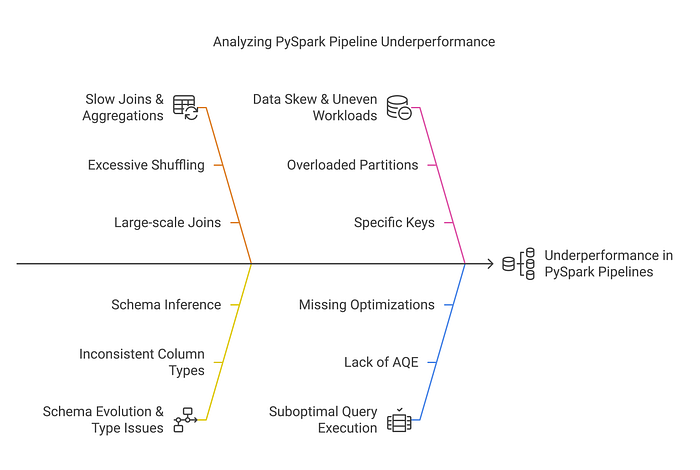
Why Do Some PySpark Pipelines Underperform?
Many Data Engineers encounter these performance issues:
- Slow Joins & Aggregations → Large-scale joins causing excessive shuffling.
- Schema Evolution & Type Issues → Schema inference leading to inconsistent column types.
- Data Skew & Uneven Workloads → Certain keys overloading specific partitions.
- Suboptimal Query Execution → Queries not leveraging Adaptive Query Execution (AQE) or optimizations.
Throughout this guide, we'll explore real-world solutions to these challenges and discuss best practices for optimizing PySpark workloads.
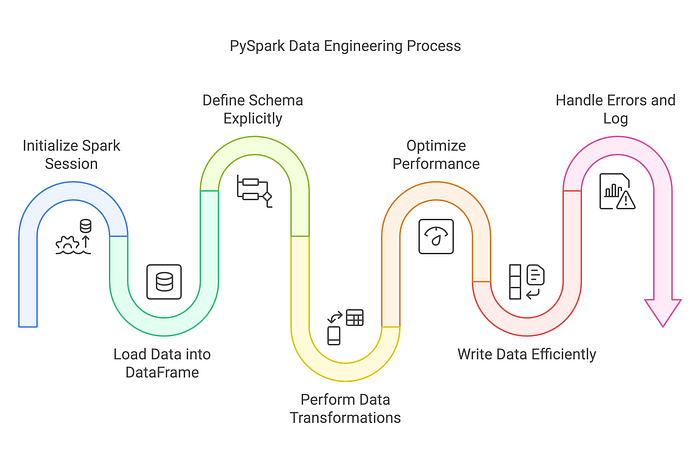
Loading Data into a DataFrame
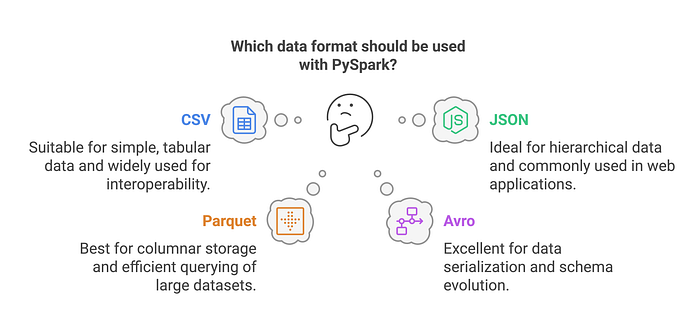
PySpark supports multiple data formats such as CSV, JSON, Parquet, Avro, and ORC. DataFrames provide an efficient abstraction for working with structured data, but they are independent of the source or target file format. A DataFrame can be created from any of these formats or other sources such as databases and in-memory collections.
The Risk of Schema Inference in Production
While using inferSchema=True is convenient, it can increase load times because Spark performs an initial scan of a subset of rows to infer the schema before performing the actual data processing. Providing the schema upfront eliminates this extra step and improves performance. However, this consideration primarily applies to formats like CSV and JSON, as Parquet, ORC, and Avro already include schema information within their metadata.
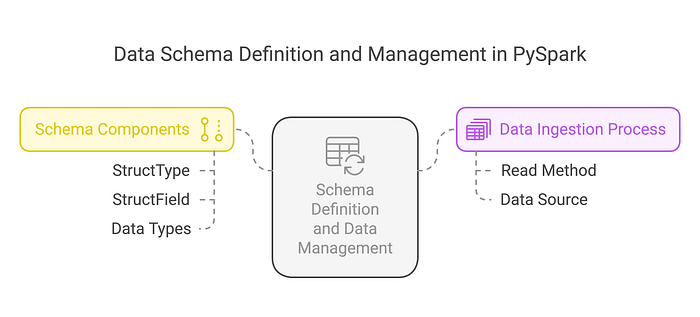
Defining Schemas Explicitly for Stability
from pyspark.sql.types import StructType, StructField, IntegerType, StringType

# Define schema for stability and performance
schema = StructType([
    StructField("id", IntegerType(), True),
    StructField("name", StringType(), True),
    StructField("salary", IntegerType(), True)
])

df = spark.read.schema(schema).json("data.json")
By explicitly defining schemas, Spark skips type inference, reducing unnecessary computations and ensuring data consistency.
Optimizing Data Transformations
The Problem: Why Are Some PySpark Queries Slow?
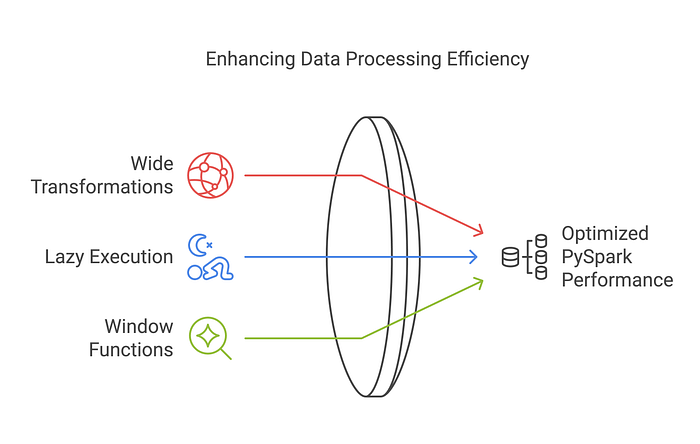
- Using wide transformations (
groupBy(),join()) without optimization. - Running transformations without understanding lazy execution.
- Not leveraging window functions for efficient aggregations.
Best Practices for Optimizing Transformations
Selecting Columns Efficiently
# Instead of dropping columns, select only needed ones
df = df.select("important_col1", "important_col2")
Selecting specific columns upfront avoids unnecessary column scans.
Using Efficient Aggregations
# Reduce full dataset scans with proper grouping
df_grouped = df.groupBy("Dept").agg({"Salary": "sum"})
⚠️ While groupByKey() works, it's generally less efficient than reduceByKey() or aggregateByKey() because it doesn't perform local aggregation before the shuffle. Use it only when no aggregation is needed or when datasets are small and balanced.
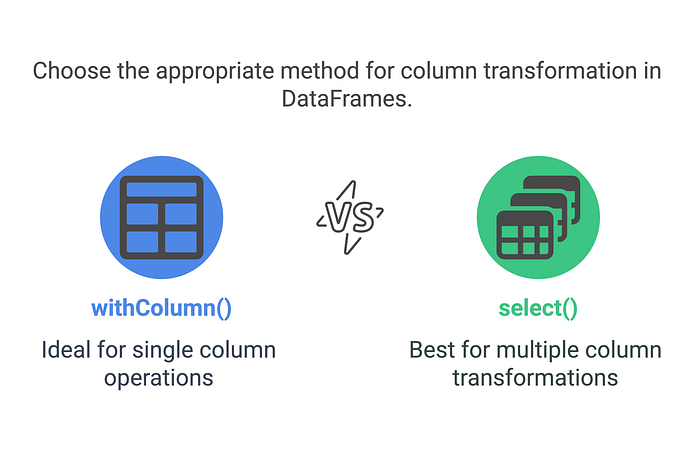
When to Use withColumn() vs. select()
When adding or modifying multiple columns, using a single .select() statement is preferred over multiple .withColumn() calls. Each .withColumn() call creates a new DataFrame with an additional execution plan, which can lead to performance overhead. However, it's important to note that .select() does not reduce DataFrame shuffles. Shuffles occur in operations involving row-to-row comparisons, such as joins, aggregations, and window functions.
Additionally, .select() can be used to add a new column efficiently, for example: .select("*", lit("value").alias("new_column")).
Avoiding UDFs When You Don't Need Them
User-defined functions (UDFs) in PySpark provide flexibility, but they come with a cost. UDFs force Spark to serialize/deserialize data and prevent Catalyst from optimizing your query plan. In most cases, you can achieve the same results using built-in Spark SQL functions — which are faster, safer, and more scalable.
from pyspark.sql.functions import upper, col

# Preferred
df = df.withColumn("upper_name", upper(col("name")))

# Slower, less optimized
from pyspark.sql.functions import udf
from pyspark.sql.types import StringType

@udf(returnType=StringType())
def to_upper_udf(s):
    return s.upper()

df = df.withColumn("upper_name", to_upper_udf(col("name")))
If you're reaching for a UDF, double-check whether a built-in alternative exists — it'll almost always perform better.
Handling Performance Bottlenecks in PySpark
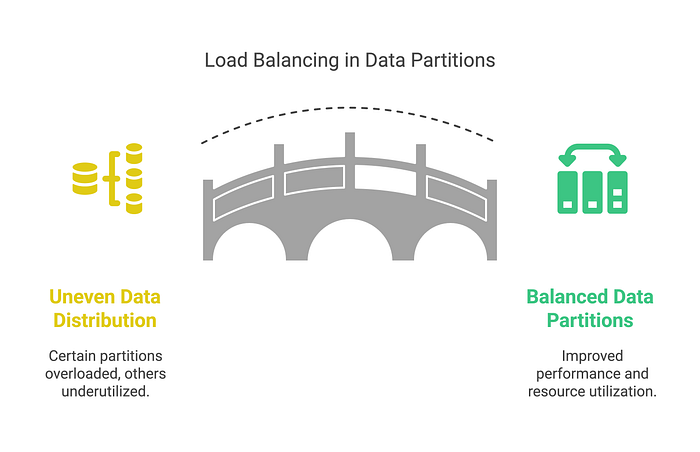
Issue 1: Data Skew in Joins
Imagine an e-commerce dataset where 90% of transactions come from a single region. This creates data skew, overloading certain partitions while others remain underutilized.
Why Data Skew Happens?
Data skew occurs when certain keys are significantly more frequent than others, leading to an imbalance in how Spark partitions and processes the data. This issue is particularly problematic in joins and aggregations, where a small subset of keys may dominate processing time.
Why Salting is Not Always the Best Solution
A common misconception is that adding a randomized salt to a join key always alleviates skew. While salting can help distribute data more evenly, it requires careful application. Specifically, one of the datasets must contain duplicate records for all possible salt values to maintain correctness. Otherwise, the join logic will break, leading to incorrect results.
For example, if we salt only one side of the join:
from pyspark.sql.functions import col, lit, rand

# Adding salt to the key
df = df.withColumn("skew_key", col("key").cast("string") + lit("_") + (rand() * 10).cast("int"))
This spreads data across partitions, but unless the other dataset in the join also has the corresponding salted keys, the join will fail to match records correctly.
Better Strategies for Handling Data Skew
Instead of relying solely on salting, consider the following alternative strategies:
- Refine Partitioning Strategy — If possible, consider using repartition() when increasing the number of partitions for parallelism — just keep in mind that it triggers a full shuffle. If you're reducing partitions after a shuffle, prefer coalesce() to avoid unnecessary data movement. Partitioning is one of the simplest ways to reduce skew, but it's also one of the most misunderstood — always monitor with the Spark UI when tuning.
- Leverage Adaptive Query Execution (AQE) — Spark's AQE can dynamically optimize shuffle partitions at runtime to balance skewed workloads:
spark.conf.set("spark.sql.adaptive.enabled", True)3. Skew Join Optimization — Use Spark's built-in skew join handling by enabling:
spark.conf.set("spark.sql.adaptive.skewJoin.enabled", True)4. Broadcast Joins for Small Tables — If one table is small, use broadcasting to avoid excessive shuffling:
from pyspark.sql.functions import
broadcast df_joined = df.join(broadcast(small_df), "key")
By prioritizing partitioning improvements and AQE, you can achieve better performance without introducing potential correctness issues from improper salting.
Issue 2: Slow Joins Due to Excessive Shuffling
Large table joins lead to expensive shuffle operations, which slow down query performance.
Solution:
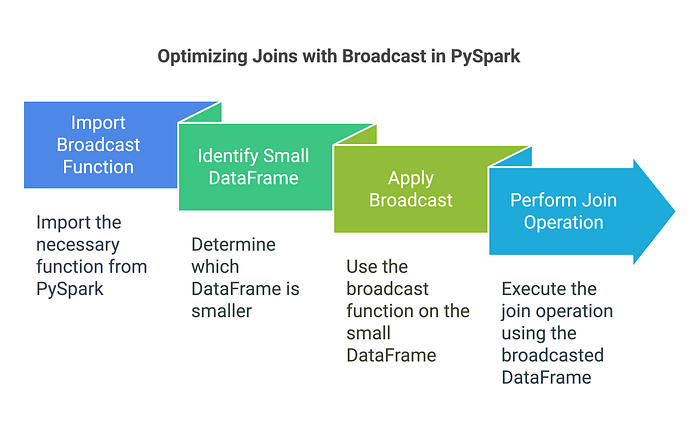
Use Broadcast Joins for Small Tables
from pyspark.sql.functions import broadcast

# Broadcast small_df to optimize join
df_joined = df.join(broadcast(small_df), "key")
Broadcast joins can significantly reduce shuffle costs — especially when one side of the join is small. Spark sends the smaller DataFrame to each executor, avoiding the need for a distributed shuffle.
But here's the catch: the broadcasted table must fit in memory. Spark tries to broadcast DataFrames below a certain size threshold (default: ~10MB, configurable via spark.sql.autoBroadcastJoinThreshold). If the dataset is too large to fit, it may either fail the job or silently fall back to a regular shuffle join — negating the performance benefit.
Rule of thumb: Always check the size of the DataFrame before broadcasting. And if you're unsure, inspect the Spark UI or logs to verify whether broadcasting actually occurred.
# Quick size check before broadcasting
print(small_df.count())

# Rough size estimation in bytes
approx_size = small_df.rdd.map(lambda row: len(str(row))).sum()
print(f"Approx size: {approx_size / (1024 * 1024):.2f} MB")

# Optional: Change broadcast threshold (default is ~10MB)
spark.conf.set("spark.sql.autoBroadcastJoinThreshold", 50 * 1024 * 1024) # 50 MB
⚠️ NOTE: These aren't perfect methods for production-level monitoring, but they're good enough to help you avoid surprises before triggering a broadcast.
Adaptive Query Execution (AQE): Let Spark Optimize Queries for You
Issue 3: Static Query Execution Plans
Without optimizations, Spark executes queries statically, often leading to suboptimal resource allocation.
Solution:
Enable AQE for Dynamic Query Optimization
spark.conf.set("spark.sql.adaptive.enabled", True)AQE automatically optimizes shuffle partitions and coalesces them based on real-time execution statistics.

When (Not) to Cache in PySpark
Caching can improve performance when the same DataFrame is reused across multiple actions, like writing, counting, and filtering. But if used blindly, it can lead to excessive memory use or even out-of-memory errors.
Only persist data when recomputation is more expensive than memory usage. Otherwise, you're holding onto data that Spark could recompute more efficiently.
Also, prefer `persist(StorageLevel.MEMORY_AND_DISK)` over `cache()` in production pipelines to avoid crashes when memory isn't sufficient.
Tuning Spark Configurations for Real-World Performance
Even if your transformations are efficient, Spark can still struggle if key configurations aren't tuned to match your data size and cluster setup.
Here are a few settings that often make the biggest impact:
- spark.sql.shuffle.partitions — controls the number of partitions for wide operations.
- spark.sql.adaptive.enabled — enables Spark's adaptive query engine.
- spark.sql.autoBroadcastJoinThreshold — defines the max size for broadcast joins.
- spark.memory.fraction — governs how much of your executor memory is allocated for execution (vs. caching).
Here's how you can switch Spark to use Kryo:
# Set the number of shuffle partitions for wide transformations (joins, groupBy, etc.)
spark.conf.set("spark.sql.shuffle.partitions", 200)  # Default is 200; tune based on cluster size and data

# Enable adaptive query optimization if not already on
spark.conf.set("spark.sql.adaptive.enabled", True)

# Broadcast join threshold (in bytes) – useful for small lookup tables
spark.conf.set("spark.sql.autoBroadcastJoinThreshold", 50 * 1024 * 1024)  # 50MB

# Control memory usage for execution (vs. caching)
spark.conf.set("spark.memory.fraction", 0.6)
These aren't one-size-fits-all — tune them based on actual data volume, job complexity, and how your cluster behaves under load. The Spark UI, event logs, and trial runs are your best friend here.
Using Kryo for Efficient Serialization
Spark uses Java serialization by default, which is generic but slow and bulky. If your jobs involve heavy caching or shuffling, switching to Kryo can save time and memory.
To enable Kryo serialization in Spark:
spark.conf.set("spark.serializer", "org.apache.spark.serializer.KryoSerializer")If you're working with custom classes or large, complex objects, you can register them for even better performance:
spark.conf.set("spark.kryo.registrationRequired", True)
spark.conf.set("spark.kryo.classesToRegister", "com.example.YourCustomClass")
⚠️ You don't have to register classes for Kryo to work — but doing so can improve serialization speed when you're pushing large volumes across partitions.
Writing Data Efficiently in PySpark
Issue 4: Slow Writes & Storage Bottlenecks
Writing large datasets without optimization increases job execution time and storage costs.
Solution:
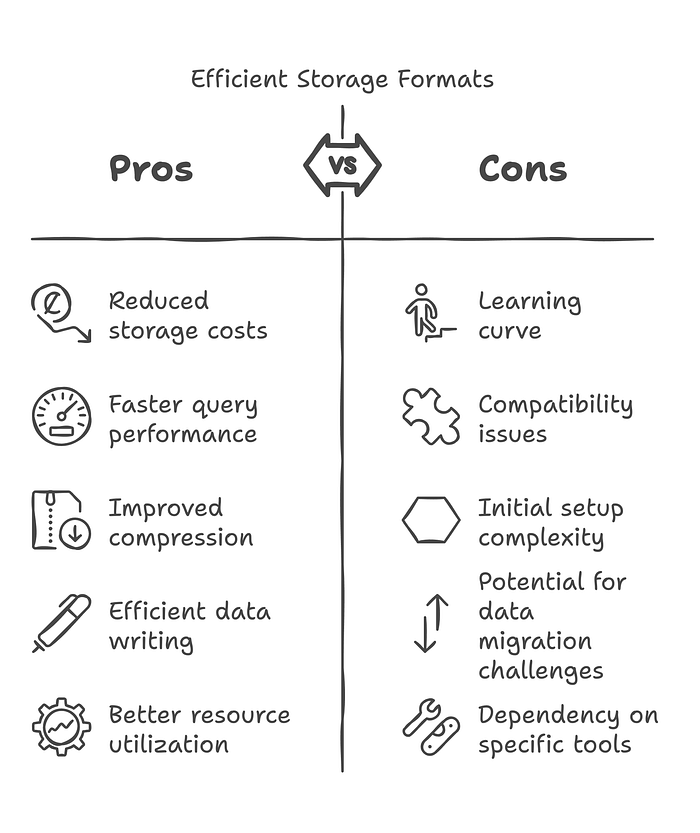
Use Efficient Storage Formats
# Writing to Parquet
df.write.mode("overwrite").parquet("output.parquet")

# Writing to Delta Lake
df.write.format("delta").mode("append").save("delta_table_path")
Using Parquet and Delta formats improves compression and query performance.
Issue 5: Too Many Small Files on Disk
Writing large DataFrames with too many partitions can result in hundreds or thousands of small files. This bloats your metadata, increases overhead for file listing, and slows down query engines like Athena, Presto, or Delta Lake — even if the data volume is small.
Solution:
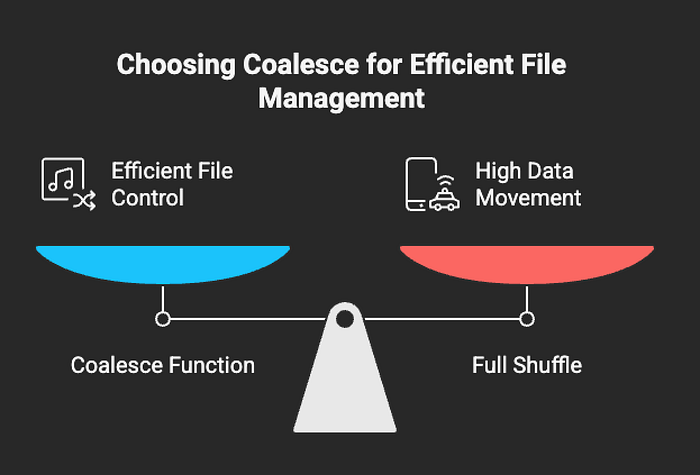
Coalesce Before Writing
# Reduce number of output files to 1
df.coalesce(1).write.mode("overwrite").parquet("output/path")

# Or, for moderate parallelism
df.coalesce(10).write.mode("append").format("delta").save("delta_table_path")
Using coalesce() helps you control the number of files Spark generates without triggering a full shuffle. This is especially useful when writing to S3, HDFS, or Delta tables at scale.
Key Takeaways:
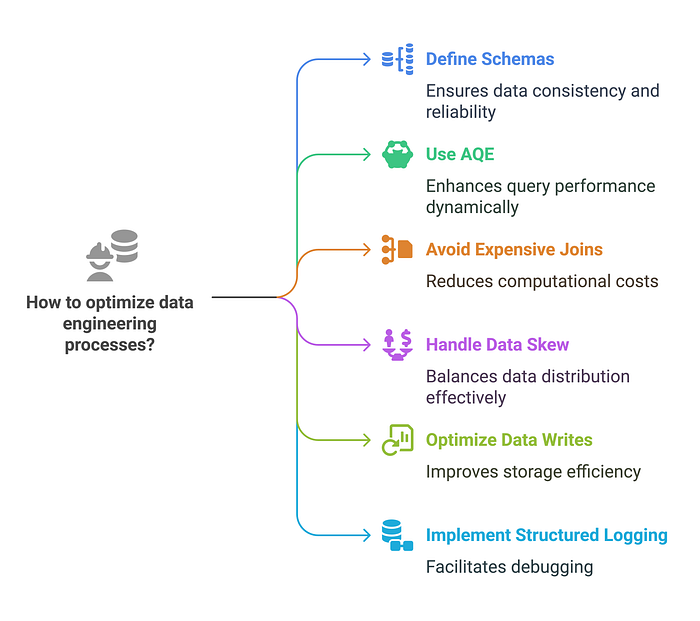
What Every Data Engineer Should Know
✅ Define schemas explicitly instead of relying on inference. ✅ Use AQE to dynamically optimize queries at runtime. ✅ Avoid expensive shuffle joins by using broadcast joins when appropriate. ✅ Handle data skew with strategies like salting (used carefully), partitioning, AQE, or broadcast joins depending on the situation. ✅ Optimize data writes by using Parquet or Delta formats. ✅ Implement structured logging for debugging large-scale Spark jobs.
Tools like the Spark UI, SparkListener, or history server can give deeper visibility into task distribution, shuffles, and skew — worth checking during tuning.
For long-running jobs or production clusters, external tools like Ganglia, Prometheus + Grafana, or cloud-native monitors (e.g. AWS CloudWatch, Azure Monitor, GCP Stackdriver) help track key metrics such as:
- Task failures
- Executor memory pressure
- GC overhead
- Shuffle size trends
- Skew and stage retries over time
These tools give you visibility beyond the Spark UI and let you spot problems before they break your pipeline.
Next Steps: Improve Your PySpark Skills
Building efficient PySpark pipelines requires continuous learning. Here's what you can explore next:
- Real-time processing with Spark Streaming
- Leveraging Delta Lake for scalable data lakes
- Advanced MLlib applications in Spark
— — —
What's your biggest challenge in optimizing PySpark jobs? Have you used salting, partitioning, or AQE in your work?
Drop your thoughts in the comments, and let's discuss real-world PySpark performance tips!
— — —