
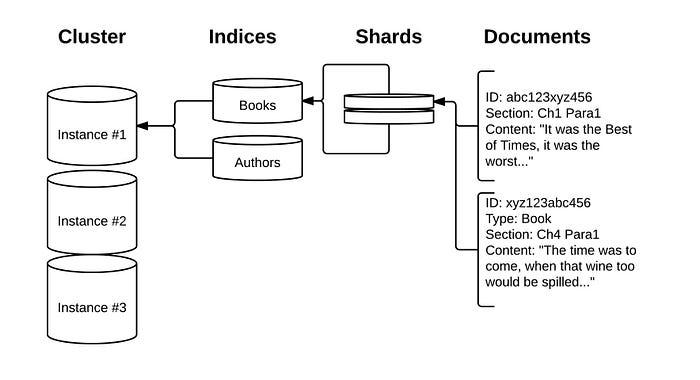
Elasticsearch is a powerful and popular open-source search and analytics engine that can handle large amounts of structured and unstructured data. It is often used as a backend for web applications, log analysis, business intelligence, and more. In this blog post, I will show you how to upload data from CSV, JSON, or text files directly into Elasticsearch using the Data Visualizer feature in Kibana.
The Data Visualizer feature is part of the Machine Learning module in Kibana, which provides various tools and functionalities for data analysis and anomaly detection. The Data Visualizer allows you to ingest, parse, and index your file with a few clicks, without having to write any code or configuration. It also provides a preview of your data and some basic statistics and visualizations.
To use the Data Visualizer, you need to have access to the Machine Learning module in Kibana, which requires a Platinum or Enterprise license, or a free trial. You also need to have an Elasticsearch cluster running and accessible from Kibana. You can use the Elastic Cloud service to easily set up a cloud-based cluster, or follow the installation guide to set up a local cluster in the previous tutorial here.
Step 1: Select or drag and drop a file
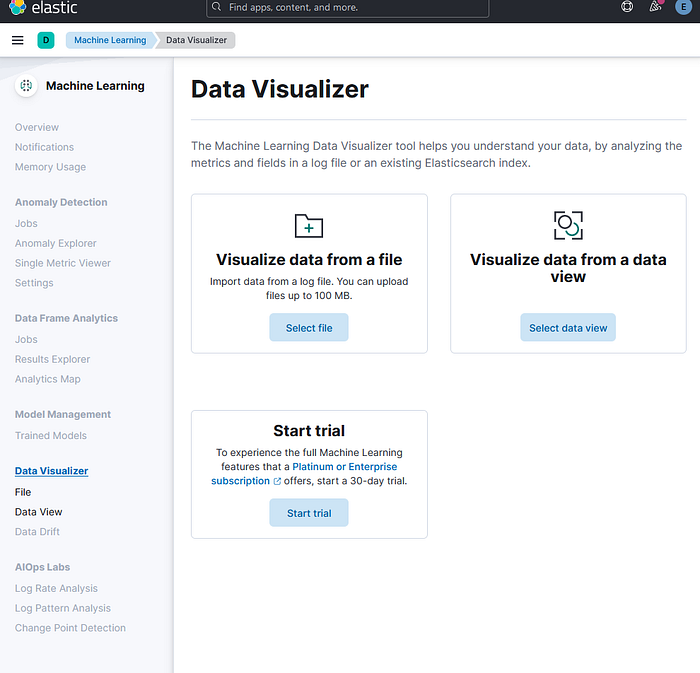
The first step is to select or drag and drop a file that you want to upload into Elasticsearch. The file can be in CSV, JSON, or text format, and it should not exceed 100 MB in size. You can find the Data Visualizer feature in Kibana under the Machine Learning > Data Visualizer > File section. You will see a page like this:
For the purpose of this exercise, We are going to get the Kaggle News Category Dataset: https://www.kaggle.com/datasets/rmisra/news-category-dataset?resource=download
You can either click on the "Select or drag and drop a file" button to browse and choose a file from your computer, or simply drag and drop a file into the highlighted area. For this example, I will use a CSV file containing some sample data about movies, which you can download from here. The file looks like this:
Step 2: Review the file analysis and settings
Once you select or drag and drop a file, the Data Visualizer will analyze the file and display a summary of its findings, such as the file format, the number of lines, the delimiter, the header row, the time field, etc. It will also show you a list of fields and their types, along with some basic statistics and visualizations. For example, for the CSV file that I used, the Data Visualizer shows me this:
You can review the file analysis and settings and make sure that they are correct and suitable for your data. You can also change some of the settings, such as the index name, the number of shards, the number of replicas, the mappings, etc. by clicking on the "Override settings" button. For this example, I will keep the default settings and use the index name "movies".
Step 3: Import the file into Elasticsearch
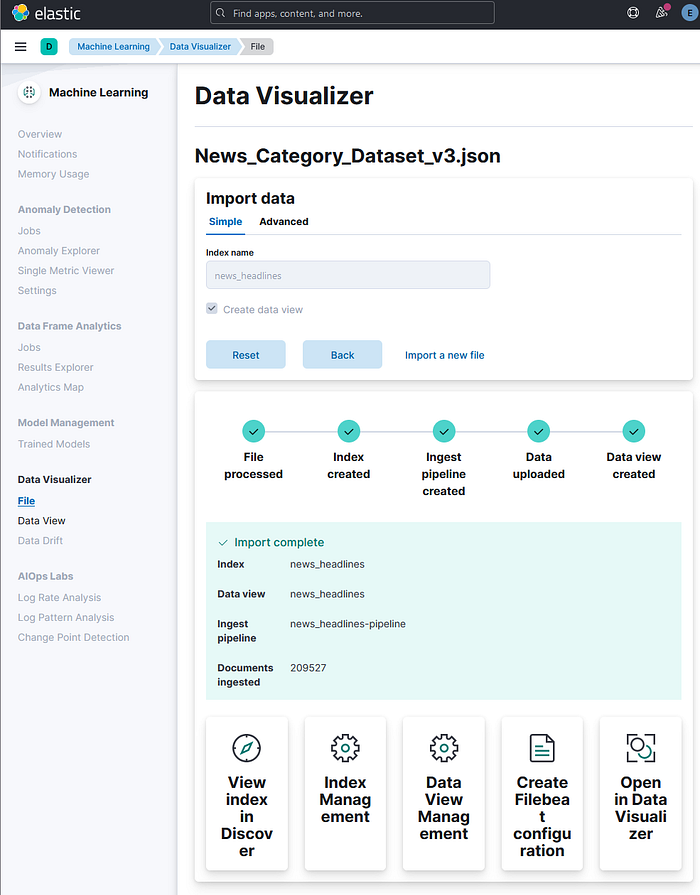
The final step is to import the file into Elasticsearch and create an index with the data. You can do this by clicking on the "Import" button at the bottom of the page. The Data Visualizer will show you a progress bar and a message indicating the status of the import operation. For example, for the CSV file that I used, the Data Visualizer shows me this:
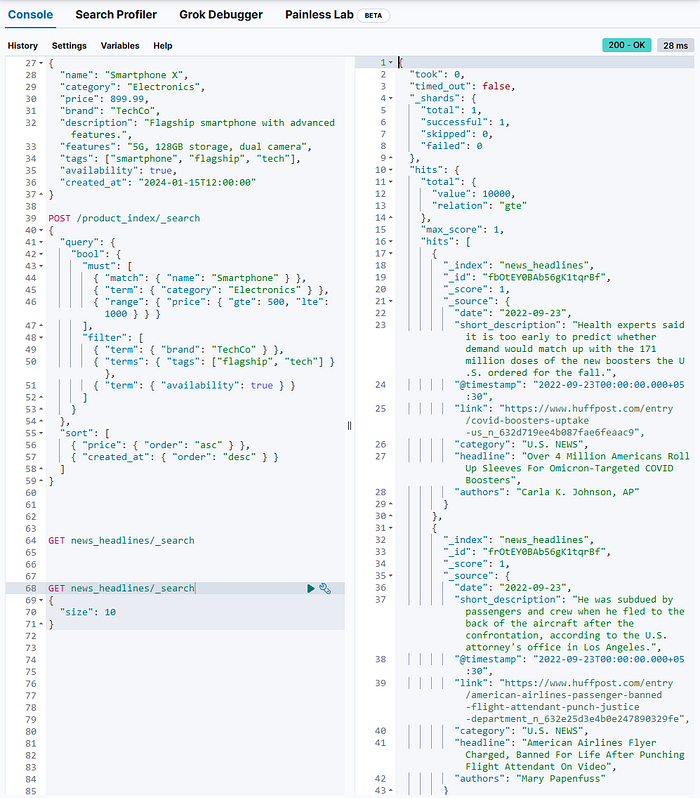
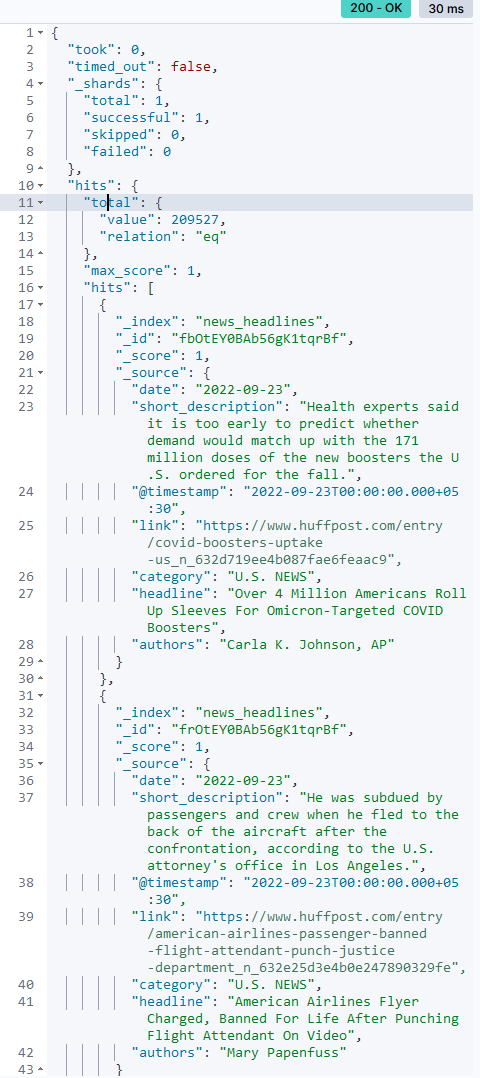
Once the import is completed, you will see a message saying "Import complete" and a link to view the index in the Discover app. You can also use the Dev Tools console or any other HTTP client to query the index and verify that the data has been uploaded correctly. For example, to get the first 10 documents from the "movies" index, you can use the following command:
GET news_headlines/_search
{
  "size": 10
}
This will return a response like this:
Get the exact total number of hits
To improve the response speed on large datasets, Elasticsearch limits the total count to 10,000 by default. If you want the exact total number of hits, use the following query.
Syntax:
GET enter_name_of_the_index_here/_search
{
  "track_total_hits": true
}
Example:
GET news_headlines/_search
{
  "track_total_hits": true
}
The concept of score and hit on Search Engines are crucial. Search Engines work on the concept of linguistic processing of words. Using different algorithms to rank the subject word and the supporting words, like the example which we have already seen, "How to form Good Habits". In the above habits is the subject word and "How to Form Good" is the supporting word which can have a lot of supporting words like:
- "How to form good Behavior"?
- "How to form good attitude"?
- "How to form good ethics"?
- "How to form good friends"?
How to search for news within a specific date, as between successive dates!
GET enter_name_of_the_index_here/_search
{
  "query": {
    "Specify the type of query here": {
      "Enter name of the field here": {
        "gte": "Enter lowest value of the range here",
        "lte": "Enter highest value of the range here"
      }
    }
  }
}
Example:
GET news_headlines/_search
{
  "query": {
    "range": {
      "date": {
        "gte": "2015-06-20",
        "lte": "2015-09-22"
      }
    }
  }
}
Expected response from Elasticsearch:
It will pull up articles published from June 20, 2015 through September 22, 2015. A document from the result set was shown as an example.

Aggregations
An aggregation summarizes your data as metrics, statistics, and other analytics.
Analyze the data to show the categories of news headlines in our dataset
Syntax:
GET enter_name_of_the_index_here/_search
{
  "aggs": {
    "name your aggregation here": {
      "specify aggregation type here": {
        "field": "name the field you want to aggregate here",
        "size": state how many buckets you want returned here
      }
    }
  }
}
Example:
GET news_headlines/_search
{
  "aggs": {
    "by_category": {
      "terms": {
        "field": "category",
        "size": 100
      }
    }
  }
}
Expected response from Elasticsearch:

A combination of query and aggregation request
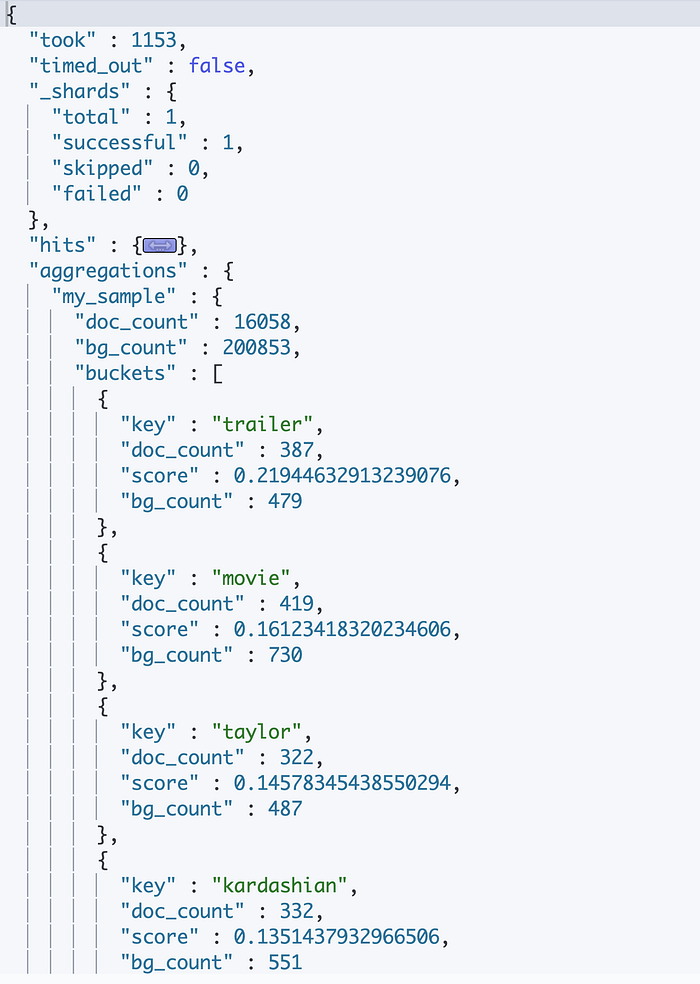
Search for the most significant term in a category
Syntax:
GET enter_name_of_the_index_here/_search
{
  "query": {
    "match": {
      "Enter the name of the field": "Enter the value you are looking for"
    }
  },
  "aggregations": {
    "Name your aggregation here": {
      "significant_text": {
        "field": "Enter the name of the field you are searching for"
      }
    }
  }
}
Example:
GET news_headlines/_search
{
  "query": {
    "match": {
      "category": "ENTERTAINMENT"
    }
  },
  "aggregations": {
    "popular_in_entertainment": {
      "significant_text": {
        "field": "headline"
      }
    }
  }
}
Expected response from Elasticsearch:
Precision and Recall
Increasing Recall
Syntax:
GET enter_name_of_index_here/_search
{
  "query": {
    "match": {
      "Specify the field you want to search": {
        "query": "Enter search terms"
      }
    }
  }
}
Example:
GET news_headlines/_search
{
  "query": {
    "match": {
      "headline": {
        "query": "Khloe Kardashian Kendall Jenner"
      }
    }
  }
}
Expected response from Elasticsearch:
By default, the match query uses an "OR" logic. If a document contains one of the search terms, Elasticsearch will consider that document as a hit.
"OR" logic results in higher number of hits, thereby increasing recall. However, the hits are loosely related to the query and lowering precision as a result.

Increasing Precision
We can increase precision by adding an "and" operator to the query.
Syntax:
GET enter_name_of_index_here/_search
{
  "query": {
    "match": {
      "Specify the field you want to search": {
        "query": "Enter search terms",
        "operator": "and"
      }
    }
  }
}
Example:
GET news_headlines/_search
{
"query": {
"match": {
"headline": {
"query": "Khloe Kardashian Kendall Jenner",
"operator": "and"
}
}
}
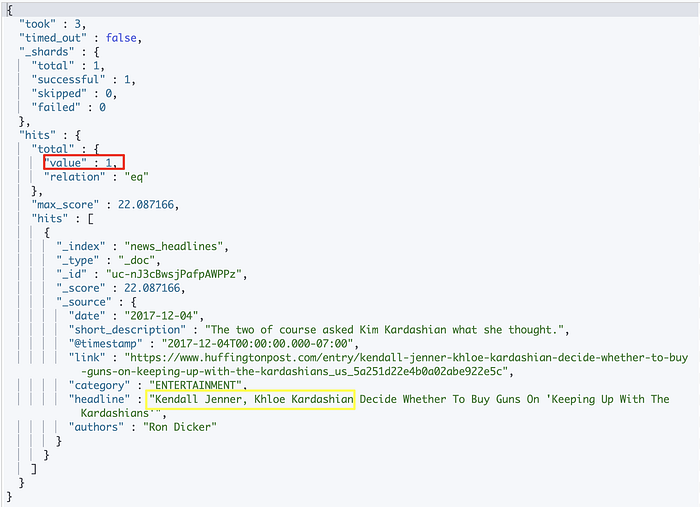
}Expected response from Elasticsearch:
"AND" operator will result in getting more precise matches, thereby increasing precision. However, it will reduce the number of hits returned, resulting in lower recall.
minimum_should_match
This parameter allows you to specify the minimum number of terms a document should have to be included in the search results.
This parameter gives you more control over fine tuning precision and recall of your search.
Syntax:
GET enter_name_of_index_here/_search
{
  "query": {
    "match": {
      "headline": {
        "query": "Enter search term here",
        "minimum_should_match": Enter a number here
      }
    }
  }
}
Example:
GET news_headlines/_search
{
  "query": {
    "match": {
      "headline": {
        "query": "Khloe Kardashian Kendall Jenner",
        "minimum_should_match": 3
      }
    }
  }
}
Expected response from Elasticsearch:
With minimum_should_match parameter, we were able to finetune both precision and recall!

Conclusion
In this blog post, I have shown you how to upload data from CSV, JSON, or text files into Elasticsearch using the Data Visualizer feature in Kibana. This feature enables you to ingest, parse, and index your file with a few clicks, without having to write any code or configuration. It also provides a preview of your data and some basic statistics and visualizations.
You can use this feature to easily get your data into Elasticsearch and explore it with Kibana or Machine Learning. You can also use the Data Visualizer to upload different types of files, such as log files, NDJSON files, etc. You can find more information and examples about the Data Visualizer in the [official documentation].
I hope this blog post was helpful and informative. If you have any questions or feedback, please leave a comment below. Thank you for reading! 😊