
You draw your support, mark your levels, load 10 indicators, and convince yourself everything is aligned… But the moment you enter the trade, the price moves against you. It's that you're missing one thing:
Clarity.
Most traders take trades without actually knowing:
- What is my exact stop-loss?
- What is my exact target?
- What is the real risk-to-reward?
- Is momentum supporting the trade?
And without these answers, every trade becomes emotional.
But recently, I came across a TradingView tool that changes all of this instantly. A tool that visualises your TP, SL, and RR directly on the chart the moment a signal appears.
After backtesting it, I removed all my old indicators — because this system finally brings structure into your trading.
Let's break it down.
The Core Idea
Trading becomes easier when your chart shows you two things:
- What direction to trade
- Exactly where to enter and exit
The TP/SL Percentage & RR Visual Tool gives you the second part. The Fund Flow Trend Oscillator gives you the first.
Direction → Confirmation → TP/SL → Execute.
Setting Up the Tools
Before we dive into the strategy, let's add the indicators.
1. TP/SL Percentage & RR Visual Tool
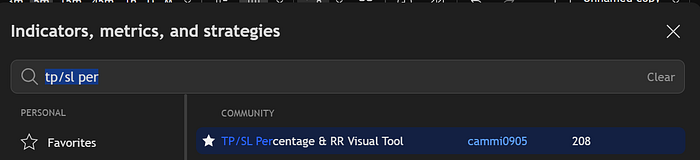
Go to TradingView → Indicators → Search:
TP/SL Percentage and RR Visual Tool
Add it to the chart and adjust settings:
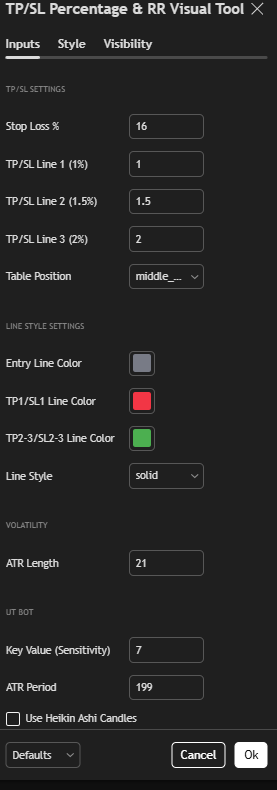
- Stop-loss per cent: 1 → 16
- ATR Length: 14 → 21
- Key Sensitivity: 1 → 7
- ATR Period: 10 → 199
- EMA 20 Length: 20 → 10
- Hide extra style options
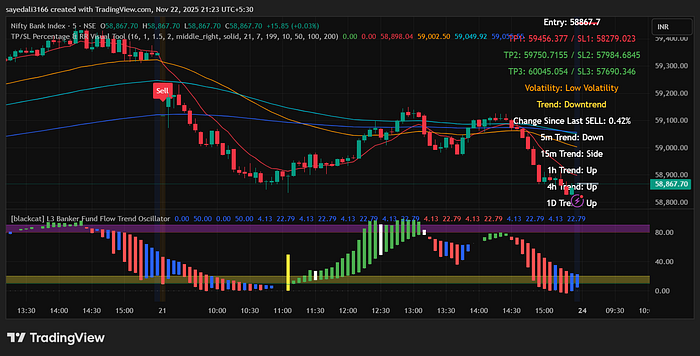
This tool now plots your:
- Entry
- Take-profit
- Stop-loss
- RR ratio (like 1:1.5)
Directly on your candles.
2. L3 Banker Fund Flow Trend Oscillator
Search:
L3 Banker Fund Flow Trend Oscillator
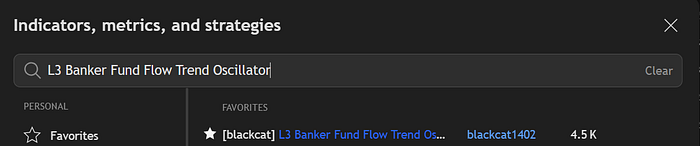
Add it → Hide unwanted visuals.
This oscillator shows:
- Green for bullish fund flow
- Red for bearish fund flow
When combined with price action, it confirms the true direction of the market.
Your setup is now complete.
How The Strategy Works
Price gives you a signal. The indicator auto-plots TP and SL. The fund flow confirms direction. You execute with discipline.
Let's go step-by-step.
Trading Rules — Step by Step
1. Short Setup (Sell Trade)
A valid sell trade needs three confirmations:
- TP/SL RR indicator gives a Sell signal
- Price forms a bearish candle
- The Fund Flow Oscillator candle is red and in a downtrend
Only then do you enter.
Stop-Loss: Place SL at the current candle's higher level
Target: 1: 1.5 RR
This creates a clean, mechanical short trade.
2. Long Setup (Buy Trade)
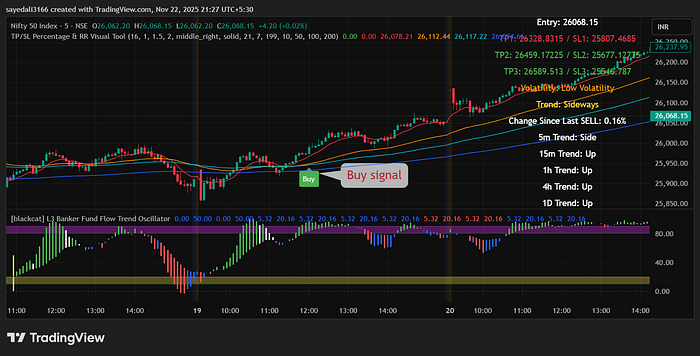
A buy setup follows the same logic:
- TP/SL RR indicator gives a Buy signal
- A bullish candle forms
- Fund Flow Oscillator shows green and an uptrend
Stop-Loss: Place SL at the lower level of the current candle
Target: 1: 1.5 RR
Why This System Works
Most indicators tell you what to do.
This one tells you:
- What to do
- Where to enter
- Where to exit
- How much are you risking
- Whether momentum agrees
- Whether RR is worth the trade
You trade with structure instead of hope.
Because the biggest difference between profitable and struggling traders is this:
Profitable traders don't chase candles — they plan trades.
And this visual RR tool forces you to plan every trade with defined risk.
The Mindset That Holds Everything Together
Trading becomes easier the moment you remove guesswork.
When everything aligns, confidence follows naturally.
And when confidence comes, discipline follows.
This is how you shift from emotional trading to mathematical trading.
Final Thoughts
Trading isn't about predicting the next candle.
It's about positioning yourself where:
- Direction is clear
- Momentum is aligned
- Risk is defined
- Reward is favourable
By combining:
TP/SL RR Visual Tool L3 Banker Fund Flow Oscillator
You get a strategy that's simple, visual, and powerful. A strategy that forces discipline and removes emotional mistakes.
Test it. And once it clicks, you'll understand why traders delete their old indicators after finding this one.