

Hi All , This story is open to everyone; non-member readers can click this link to read the story for Free.
Today , We will do a Hands on Exercise by Creating and Running a Dedicated Ethereum RPC Node in the Google Cloud.
So Let's Begin :
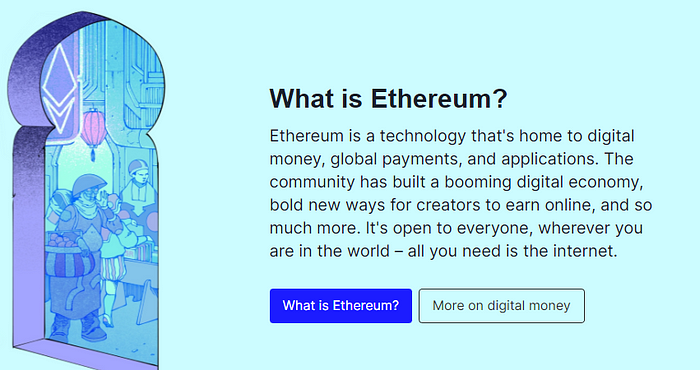
Ethereum Overview

Ethereum is a decentralized, open-source Turing-Complete blockchain with smart contract functionality. Smart contracts contain code that is executed on a blockchain.
On the Ethereum network, it's written in the the Solidity language and compiled into an ABI code that is deployed and executed. Smart contracts are essentially executable code that can represent applications performing certain actions or processing transactions of assets between two or more parties.
An Ethereum/Polygon transaction refers to an action initiated by an externally-owned account — in other words — an account managed by a human, not a smart contract.
For example, if Bob sends Alice 1 ETH, Bob's account must be debited and Alice's must be credited. This state-changing action takes place within a transaction.
Overview : Hosting Own Blockchain Nodes
Hosting your own blockchain nodes may be required for security, compliance, performance or privacy. And a decentralized, resilient and sustainable network is a critical foundation for any blockchain protocol.
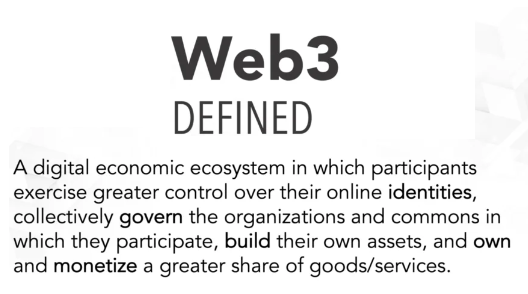
Web3 developers can use Google Cloud's Blockchain Node Engine, a fully managed node-hosting solution for Web3 development. Organizations can also configure and manage their own nodes in Google Cloud. As the trusted partner for Web3 infrastructure, Google Cloud offers secure, reliable, and scalable node hosting infrastructure.
To learn more about Hosting nodes on Google Cloud, visit blog post Introducing Blockchain Node Engine: fully managed node-hosting for Web3 development.
To learn more about technical considerations and architectural decisions you need to make when you deploy self-managed blockchain nodes to the cloud; please visit blog post Google Cloud for Web3.
In this lab, you create a virtual machine (VM) to deploy an Ethereum RPC node.
An Ethereum RPC node is capable of receiving blockchain updates from the network and processing RPC API requests.
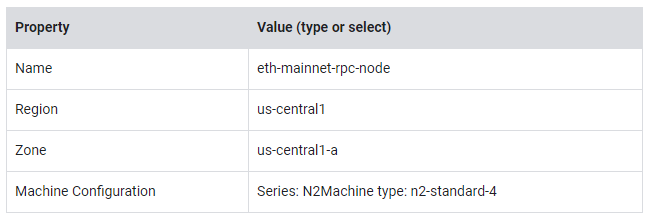
You use a n2-standard-4 machine type that includes a 20-GB boot disk, 4 virtual CPUs (vCPU) and 16 GB of RAM.
To ensure there is enough room for the blockchain data, you attach a 200GB SSD disk to the instance.
You use Ubuntu 20.04 and deploy two services: Geth, the "execution layer" and Lighthouse, the "consensus layer". Both of these services work together to form an Ethereum RPC node.
Objectives
In this lab, you learn how to perform the following tasks:
- Create a Compute Engine instance with a persistent disk
- Configure a static IP address and network firewall rules
- Schedule regular backups
- Deploy Geth, the execution layer for Ethereum
- Deploy Lighthouse, the consensus layer for Ethereum
- Make Ethereum RPC calls
- Configure Cloud Logging
- Configure Cloud Monitoring
- Configure uptime checks
- Click Open Google Console. The lab spins up resources, and then opens another tab that shows the Sign in page.
- Tip: Arrange the tabs in separate windows, side-by-side.
- Note: If you see the Choose an account dialog, click Use Another Account.
- If necessary, copy the Username from the Lab Details panel and paste it into the Sign in dialog. Click Next.
- Copy the Password from the Lab Details panel and paste it into the Welcome dialog. Click Next.
- Important: You must use the credentials from the left panel. Do not use your Google Cloud Skills Boost credentials.
- Note: Using your own Google Cloud account for this lab may incur extra charges.
- Click through the subsequent pages:
- Accept the terms and conditions.
- Do not add recovery options or two-factor authentication (because this is a temporary account).
- Do not sign up for free trials.
10. After a few moments, the Cloud Console opens in this tab.
Note: You can view the menu with a list of Google Cloud Products and Services by clicking the Navigation menu at the top-left.
Activate Cloud Shell
Cloud Shell is a virtual machine that is loaded with development tools. It offers a persistent 5GB home directory and runs on the Google Cloud. Cloud Shell provides command-line access to your Google Cloud resources.
- Click Activate Cloud Shell
2. at the top of the Google Cloud console.
When you are connected, you are already authenticated, and the project is set to your PROJECT_ID. The output contains a line that declares the PROJECT_ID for this session:
Your Cloud Platform project in this session is set to YOUR_PROJECT_IDgcloud is the command-line tool for Google Cloud. It comes pre-installed on Cloud Shell and supports tab-completion.
3.(Optional) You can list the active account name with this command:
gcloud auth listClick Authorize.
Your output should now look like this:
Output:
ACTIVE: *
ACCOUNT: student-01-xxxxxxxxxxxx@qwiklabs.net
To set the active account, run:
    $ gcloud config set account `ACCOUNT`
(Optional) You can list the project ID with this command:
gcloud config list projectOutput:
[core]
project = <project_ID>
Example output:
[core]
project = qwiklabs-gcp-44776a13dea667a6
Note: For full documentation of gcloud, in Google Cloud, refer to the gcloud CLI overview guide.
In this lab, you use the following tools:
- Ubuntu 20.04
- Geth
- Lighthouse
- Curl
- gCloud
Task 1. Create infrastructure for the Virtual Machine
Create a public static IP address, firewall rule, service account, snapshot schedule and a virtual machine with the new IP address. This is the infrastructure that Ethereum is deployed to.
Create a public static IP address
In this section, you set up the public IP address used for the virtual machine.
- From the Navigation menu, under the VPC Network section, click IP Addresses.
- Click on RESERVE EXTERNAL STATIC ADDRESS in the action bar to create the static IP address.
- For the static address configuration, use the following:
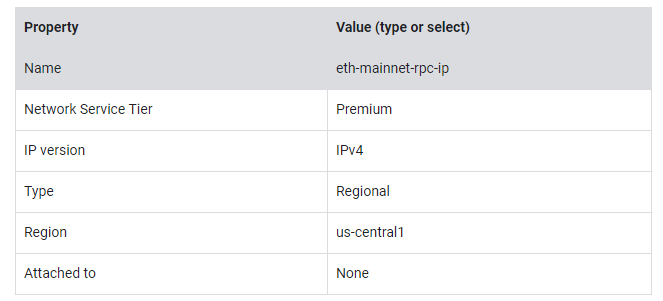
- Click RESERVE.
Create a firewall rule
Create Firewall rules so that the VM can communicate on designated ports.
Geth P2P communicates on TCP and UDP on port 30303. Lighthouse P2P communicates on TCP and UDP on port 9000. Geth RPC uses TCP 8545.
- From the Navigation menu, under the VPC Network section, click Firewall.
- Click on CREATE FIREWALL RULE in the action bar to create the firewall rules.
- For the firewall configuration, use the following:
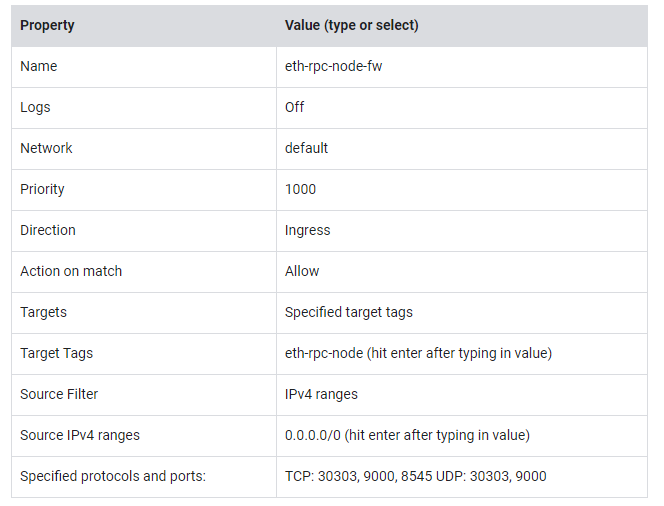
- Click CREATE.
Create a service account
Create a service account for the VM to operate under.
- From the Navigation Menu, under the IAM & Admin section, click Service Accounts.
- Click on CREATE SERVICE ACCOUNT in the action bar to create the service account.
- For the service account configuration, use the following:

- Click CREATE AND CONTINUE.
- Add the following roles:
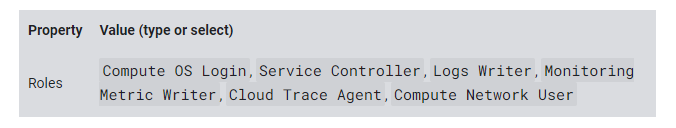
- Click CONTINUE.
- Click DONE.
Create a snapshot schedule
In this section, you set up the snapshot schedule used for the virtual machine's attached disk, which contains the blockchain data. This will backup the chain data.
- From the Navigation Menu, under the Compute Engine section, click Snapshots.
- Click CREATE SNAPSHOT SCHEDULE to create the snapshot schedule.
- For the snapshot schedule, use the following:
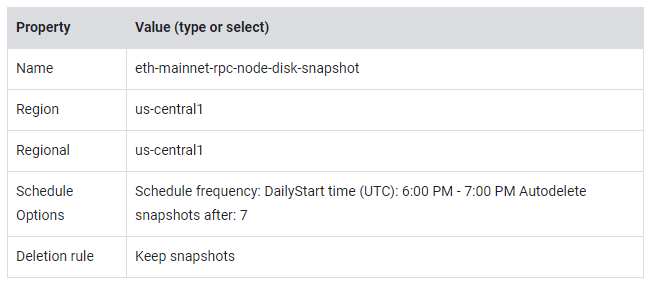
- Click CREATE.
Create a Virtual Machine
In this section, you set up the virtual machine used for the Ethereum deployment.
- From the Navigation Menu, under the Compute Engine section, click VM Instances.
- Click on CREATE INSTANCE to create the VM.
- For the virtual machine configuration, use the following:
- Under Boot Disk, click CHANGE. Choose the following values:
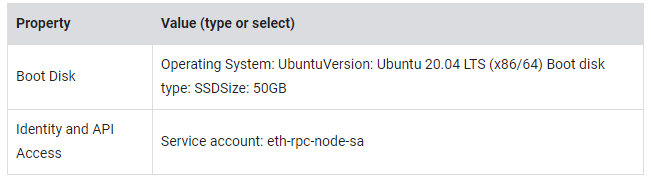
- Under Identity and API Access, SELECT the service account eth-rpc-node-sa.
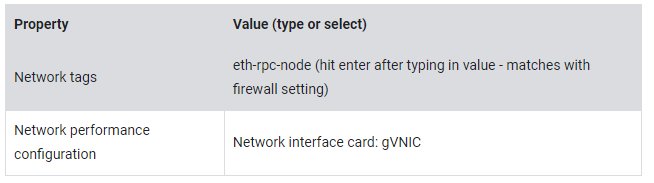
- Expand Advanced options
- Under Networking, enter the following values:
- Expand default:
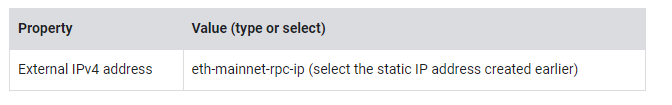
- Click DONE.
- Under Disks, click ADD NEW DISK and enter the following values:
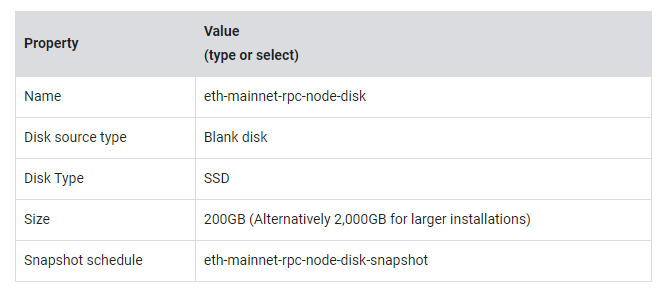
- Click SAVE.
- Click CREATE.
Task 2. Setup and Installation on the Virtual Machine
Now, ssh into the VM and run the commands to install the software.
SSH into the VM
- From the Navigation Menu, under the Compute Engine section, click VM Instances.
- On the same row as eth-mainnet-rpc-node, click SSH to open an ssh window.
- If prompted, click Connect without Identity Aware Proxy.
Create a Swap File on the VM
To give the processes extra RAM, you'll create a swap file. This is to increase the amount of RAM that the VM can use if it needs to.
- To create a 25GB swap file, execute the following command:
sudo dd if=/dev/zero of=/swapfile bs=1MiB count=25KiBNote that the first command will take a little time to execute.
- Update the permissions on the swap file:
sudo chmod 0600 /swapfile2. Designate the file to be used as a swap partition:
sudo mkswap /swapfileAdd the swap file configuration to /etc/fstab, which allows the mounted drive to be recognized upon reboot:
echo "/swapfile swap swap defaults 0 0" | sudo tee -a /etc/fstabEnable the swap file:
sudo swapon -a3.Confirm the swap has been recognized:
free -gYou should see a message with a line similar to this:
Output:
total  used   free  shared  buff/cache   available
Mem:          15     0      0     0            15          15
Swap:         24     0     24
Mount the attached disk on the VM
During the VM setup, you created an attached disk. The VM will not automatically recognize this. It needs to be formatted and "mounted" before it can be used.
- View the attached disk. You should see an entry for sdb with the size as 200GB:
sudo lsblkFormat the attached disk:
sudo mkfs.ext4 -m 0 -E lazy_itable_init=0,lazy_journal_init=0,discard /dev/sdbCreate the folder and mount the attached disk:
sudo mkdir -p /mnt/disks/chaindata-disk
sudo mount -o discard,defaults /dev/sdb /mnt/disks/chaindata-disk
2.Update the permissions for the folder so processes can read/write to it:
sudo chmod a+w /mnt/disks/chaindata-disk3.Retrieve the disk ID of the mounted drive to confirm that the drive was mounted:
sudo blkid /dev/sdbYou should see a message similar to the one displayed in the output box below:
Output:
/dev/sdb: UUID="7fa9c421-0054-4555-b0ca-b470a97a3d84" TYPE="ext4"- Retrieve the disk ID of the mounted disk and append it to the /etc/fstab file. This file ensures that the drive will still be mounted if the VM restarts.
export DISK_UUID=$(findmnt -n -o UUID /dev/sdb)
echo "UUID=$DISK_UUID /mnt/disks/chaindata-disk ext4 discard,defaults,nofail 0 2" | sudo tee -a /etc/fstab
2.Run the df command to confirm that the disk has been mounted, formatted and the correct size has been allocated:
df -hYou should see a message with a line similar to this, which shows the new mounted volume and the size:
Output:
/dev/sdb 200G 90G 110GB 45% /mnt/disks/chaindata-diskIf you need to resize the disk later, follow these instructions.
Create a user on the VM
Create a user to run the processes under.
- To create a user named ethereum, execute the following commands:
sudo useradd -m ethereum
sudo usermod -aG sudo ethereum
sudo usermod -aG google-sudoers ethereum
2.Switch to the ethereum user:
sudo su ethereumStart the bash command line:
bash3.Change to the ethereum user's home folder:
cd ~Install the Ethereum software
- Update the Operating System:
sudo apt update -y
sudo apt-get update -y- Install common software:
sudo apt install -y dstat jq2.Install the GCP Ops Agent:
curl -sSO https://dl.google.com/cloudagents/add-google-cloud-ops-agent-repo.sh
sudo bash add-google-cloud-ops-agent-repo.sh --also-install
3.Remove the script file that was downloaded:
rm add-google-cloud-ops-agent-repo.sh4.Create folders for the logs and chaindata for the Geth and Lighthouse clients:
mkdir /mnt/disks/chaindata-disk/ethereum/
mkdir /mnt/disks/chaindata-disk/ethereum/geth
mkdir /mnt/disks/chaindata-disk/ethereum/geth/chaindata
mkdir /mnt/disks/chaindata-disk/ethereum/geth/logs
mkdir /mnt/disks/chaindata-disk/ethereum/lighthouse
mkdir /mnt/disks/chaindata-disk/ethereum/lighthouse/chaindata
mkdir /mnt/disks/chaindata-disk/ethereum/lighthouse/logs
5.Install Geth from the package manager:
sudo add-apt-repository -y ppa:ethereum/ethereum
sudo apt-get -y install ethereum
6.Confirm that Geth is available and is the latest version:
geth versionYou should see a message with a line similar to this:
Output:
Geth
Version: 1.11.6-stable
Git Commit: ea9e62ca3db5c33aa7438ebf39c189afd53c6bf8
Architecture: amd64
Go Version: go1.20.3
Operating System: linux
GOPATH=
GOROOT=
1.Download the Lighthouse client; be sure to double check the version on their github releases page and download the latest release:
wget https://github.com/sigp/lighthouse/releases/download/v4.1.0/lighthouse-v4.1.0-x86_64-unknown-linux-gnu.tar.gz2.Extract the lighthouse tar file and remove:
tar -xvf ./lighthouse-v4.1.0-x86_64-unknown-linux-gnu.tar.gz
rm ./lighthouse-v4.1.0-x86_64-unknown-linux-gnu.tar.gz
3.Move the lighthouse binary to the /usr/bin folder and update the permissions:
sudo mv lighthouse /usr/bin4.Confirm that lighthouse is available and is the latest version:
lighthouse --versionYou should see a message with a line similar to this:
Output:
Lighthouse v4.1.0-693886b
BLS library: blst-modern
SHA256 hardware acceleration: false
Allocator: jemalloc
Specs: mainnet (true), minimal (false), gnosis (true)- Create the shared JWT secret. This JWT secret is used as a security mechanism that restricts who can call the execution client's RPC endpoint.
cd ~
mkdir ~/.secret
openssl rand -hex 32 > ~/.secret/jwtsecret
chmod 440 ~/.secret/jwtsecret
Task 3. Start the Ethereum Execution and Consensus Clients
Ethereum has two clients: Geth — the execution layer,
and Lighthouse — the consensus layer.
They run in parallel with each other and work together. Geth will then establishe an authrpc endpoint and port that Lighthouse will call. This endpoint is protected by a common security token saved locally. Lighthouse connects to Geth using the execution endpoint and security token.
For information on how Geth connects to the consensus client, read the Connecting to Consensus Clients documentation. For more information on how lighthouse connects to the execution client, take a look at the Merge Migration — Lighthouse Book documentation.
Start Geth
The following starts the Geth execution client.
- Set the external IP address environment variable:
export CHAIN=eth
export NETWORK=mainnet
export EXT_IP_ADDRESS_NAME=$CHAIN-$NETWORK-rpc-ip
export EXT_IP_ADDRESS=$(gcloud compute addresses list --filter=$EXT_IP_ADDRESS_NAME --format="value(address_range())")
2.Run the following command to start Geth as a background process. In this lab, you use the "snap" sync mode, which is a light node. To sync as a full node, use "full" as the sync mode. You can run this at the command line or save this to a .sh file first and then run it. You can also configure it to run as a service with systemd.
nohup geth --datadir "/mnt/disks/chaindata-disk/ethereum/geth/chaindata" \
--http.corsdomain "*" \
--http \
--http.addr 0.0.0.0 \
--http.port 8545 \
--http.corsdomain "*" \
--http.api admin,debug,web3,eth,txpool,net \
--http.vhosts "*" \
--gcmode full \
--cache 2048 \
--mainnet \
--metrics \
--metrics.addr 127.0.0.1 \
--syncmode snap \
--authrpc.vhosts="localhost" \
--authrpc.port 8551 \
--authrpc.jwtsecret=/home/ethereum/.secret/jwtsecret \
--txpool.accountslots 32 \
--txpool.globalslots 8192 \
--txpool.accountqueue 128 \
--txpool.globalqueue 2048 \
--nat extip:$EXT_IP_ADDRESS \
&> "/mnt/disks/chaindata-disk/ethereum/geth/logs/geth.log" &
Start Geth as a background process and use the snap sync mode
To see the process id, run this command:
ps -A | grep gethCheck the logs to see if the process started correctly:
tail -f /mnt/disks/chaindata-disk/ethereum/geth/logs/geth.logYou should see a message similar to the one displayed in the output box below. The Geth client won't continue until it pairs with a consensus client.
Output:
Looking for peers                        peercount=1 tried=27 static=0
Post-merge network, but no beacon client seen. Please launch one to follow the chain!- Enter Ctrl+C to break out of the log monitoring.
Start Lighthouse
Now, you'll start the lighthouse consensus client.
- Run the following command to launch lighthouse as a background process. You can run this at the command line or save this to a .sh file first and then run it. You can also configure it to run as a service with systemd.
nohup lighthouse bn \
--network mainnet \
--http \
--metrics \
--datadir /mnt/disks/chaindata-disk/ethereum/lighthouse/chaindata \
--execution-jwt /home/ethereum/.secret/jwtsecret \
--execution-endpoint http://localhost:8551 \
--checkpoint-sync-url https://sync-mainnet.beaconcha.in \
--disable-deposit-contract-sync \
&> "/mnt/disks/chaindata-disk/ethereum/lighthouse/logs/lighthouse.log" &
To see the process id, run the following command:
ps -A | grep lighthouseCheck the log file to see if the process started correctly. This may take a few minutes to show up:
tail -f /mnt/disks/chaindata-disk/ethereum/lighthouse/logs/lighthouse.logYou should see a message similar to the following:
Output:
INFO Syncing
INFO Synced
INFO New block received- Enter Ctrl+C to break out of the log monitoring.
- Check the Geth log again to confirm that the logs are being generated correctly.
tail -f /mnt/disks/chaindata-disk/ethereum/geth/logs/geth.logYou should see a message similar to the one displayed in the output box below.
Output:
Syncing beacon headersVerify node has been synced with the blockchain
Determine if the node is still syncing. It will take some time for the node to sync. (Note that you don't need to wait for the node to sync to complete the lab) There are two ways to find out the sync status: Geth and an RPC call.
- Run the following Geth command to check if the node is still syncing. Output of "false" means that it is synced with the network.
geth attach /mnt/disks/chaindata-disk/ethereum/geth/chaindata/geth.ipc2.At the Geth console execute:
eth.syncingYou should see something similar to the following:
Output:
#If not synced:
{
currentBlock: 5186007,
healedBytecodeBytes: 0,
healedBytecodes: 0,
healedTrienodeBytes: 0,
healedTrienodes: 0,
healingBytecode: 0,
healingTrienodes: 0,
highestBlock: 16193909,
startingBlock: 0,
syncedAccountBytes: 2338698797,
syncedAccounts: 9417189,
syncedBytecodeBytes: 302598044,
syncedBytecodes: 58012,
syncedStorage: 42832820,
syncedStorageBytes: 9263550660
}
#If synced:
false
3.Type exit to exit out of the Geth console.
4.Run the following curl command to check if the node is still syncing. The command line tool 'jq' will format the json output of the curl command. Output of "false" means that it is synced with the network.
curl -H "Content-Type: application/json" -X POST --data '{"jsonrpc":"2.0","method":"eth_syncing","id":67}' http://localhost:8545 | jqOutput:
#If not synced:
{
  "jsonrpc": "2.0",
  "id": 67,
  "result": {
    "currentBlock": "0x4d70e9",
    "healedBytecodeBytes": "0x0",
    "healedBytecodes": "0x0",
    "healedTrienodeBytes": "0x0",
    "healedTrienodes": "0x0",
    "healingBytecode": "0x0",
    "healingTrienodes": "0x0",
    "highestBlock": "0xf71975",
    "startingBlock": "0x0",
    "syncedAccountBytes": "0x8b65b62d",
    "syncedAccounts": "0x8fb1e5",
    "syncedBytecodeBytes": "0x1209479c",
    "syncedBytecodes": "0xe29c",
    "syncedStorage": "0x28d93b4",
    "syncedStorageBytes": "0x2282690c4"
  }
}
#If synced:
{"jsonrpc":"2.0","id":67,"result":false}
5.Run the following curl command to check if the node is accessible through the external IP address:
curl -H "Content-Type: application/json" -X POST --data '{"jsonrpc":"2.0","method":"eth_syncing","id":67}' http://$EXT_IP_ADDRESS:8545 | jqOutput:
#If not synced:
{
  "jsonrpc": "2.0",
  "id": 67,
  "result": {
    "currentBlock": "0x4d70e9",
    "healedBytecodeBytes": "0x0",
    "healedBytecodes": "0x0",
    "healedTrienodeBytes": "0x0",
    "healedTrienodes": "0x0",
    "healingBytecode": "0x0",
    "healingTrienodes": "0x0",
    "highestBlock": "0xf71975",
    "startingBlock": "0x0",
    "syncedAccountBytes": "0x8b65b62d",
    "syncedAccounts": "0x8fb1e5",
    "syncedBytecodeBytes": "0x1209479c",
    "syncedBytecodes": "0xe29c",
    "syncedStorage": "0x28d93b4",
    "syncedStorageBytes": "0x2282690c4"
  }
}
#If synced:
{"jsonrpc":"2.0","id":67,"result":false}
Task 4. Configure Cloud operations
Google Cloud has several operation services to manage your Ethereum node. This section walks through configuring Cloud Logging, Managed Prometheus, Cloud Monitoring and Cloud Alerts.
Configure Cloud logging
By default, Geth and Lighthouse will be logging to their declared log file. You'll want to bring the log data into Cloud Logging. Cloud Logging has powerful search capabilities and alerts can be created for specific log messages.
- Update permissions of the Cloud Ops config file so you can update it:
sudo chmod 666 /etc/google-cloud-ops-agent/config.yaml2.Configure Cloud Ops agent to send log data to Cloud Logging. Update the file "/etc/google-cloud-ops-agent/config.yaml" to include this Ops Agent configuration. This config file defines the Geth and Lighthouse log files for import into Cloud Logging:
sudo cat << EOF >> /etc/google-cloud-ops-agent/config.yaml
logging:
  receivers:
    syslog:
      type: files
      include_paths:
      - /var/log/messages
      - /var/log/syslog
    ethGethLog:
      type: files
      include_paths: ["/mnt/disks/chaindata-disk/ethereum/geth/logs/geth.log"]
      record_log_file_path: true
    ethLighthouseLog:
      type: files
      include_paths: ["/mnt/disks/chaindata-disk/ethereum/lighthouse/logs/lighthouse.log"]
      record_log_file_path: true
    journalLog:
      type: systemd_journald
  service:
    pipelines:
      logging_pipeline:
        receivers:
        - syslog
        - journalLog
        - ethGethLog
        - ethLighthouseLog
EOF
3.After saving, run these commands to restart the agent and pick up the changes:
sudo systemctl stop google-cloud-ops-agent
sudo systemctl start google-cloud-ops-agent
sudo systemctl status google-cloud-ops-agent- Enter Ctrl+C to exit out of the status screen.
- If there is an error in the status, use this command to see more details:
sudo journalctl -xe | grep "google_cloud_ops_agent_engine"3.Check Cloud logging to confirm that log messages are appearing in the console. From the Navigation Menu, under the Logging section, click Logs Explorer. You should see messages similar to these:
Configure Managed Prometheus
Since we started the geth and lighthouse clients with the --metrics flag, both clients will output metrics on an http port. These metrics can be stored in a time series database like Prometheus and used to supply data to insightful grafana dashboards. Normally you would need to install Prometheus on the VM, but a small configuration in the Cloud Ops agent can capture the metrics and store them in the Managed Prometheus service in GCP.
- On the command line of the VM, confirm the Geth metrics endpoint is active.
curl http://localhost:6060/debug/metrics/prometheusOutput:
......
# TYPE vflux_server_clientEvent_deactivated gauge
vflux_server_clientEvent_deactivated 0
# TYPE vflux_server_clientEvent_disconnected gauge
vflux_server_clientEvent_disconnected 0
# TYPE vflux_server_inactive_count gauge
vflux_server_inactive_count 0- On the command line of the VM, confirm the Lighthouse metrics endpoint is active.
curl http://localhost:5054/metricsOutput:
......
gossipsub_heartbeat_duration_bucket{le="300.0"} 5679573
gossipsub_heartbeat_duration_bucket{le="350.0"} 5679573
gossipsub_heartbeat_duration_bucket{le="400.0"} 5679573
gossipsub_heartbeat_duration_bucket{le="450.0"} 5679573
gossipsub_heartbeat_duration_bucket{le="+Inf"} 5679573
......
2.Configure Cloud Ops agent to send the metrics data to Managed Prometheus. Update the file "/etc/google-cloud-ops-agent/config.yaml" to include this Ops Agent configuration. This config file defines the Geth and Lighthouse metrics endpoint for import into Managed Prometheus:
sudo cat << EOF >> /etc/google-cloud-ops-agent/config.yaml
metrics:
  receivers:
    prometheus:
        type: prometheus
        config:
          scrape_configs:
            - job_name: 'geth_exporter'
              scrape_interval: 10s
              metrics_path: /debug/metrics/prometheus
              static_configs:
                - targets: ['localhost:6060']
            - job_name: 'lighthouse_exporter'
              scrape_interval: 10s
              metrics_path: /metrics
              static_configs:
                - targets: ['localhost:5054']
  service:
    pipelines:
      prometheus_pipeline:
        receivers:
        - prometheus
EOF
3.After saving, run these commands to restart the agent and pick up the changes:
sudo systemctl stop google-cloud-ops-agent
sudo systemctl start google-cloud-ops-agent
sudo systemctl status google-cloud-ops-agent
4.Enter Ctrl+C to exit out of the status screen.
5.If there is an error in the status, use this command to see more details:
sudo journalctl -xe | grep "google_cloud_ops_agent_engine"6.Check Cloud logging to confirm that the metrics are appearing in the console. From the Navigation Menu, under the Monitoring section, click Metrics Explorer. Select the PROMQL tab. In the query box, enter a lighthouse metric gossipsub_heartbeat_duration_bucket. Click RUN QUERY. You should see results similar to this:
You can do the same for a Geth metric (example rpc_duration_eth_blockNumber_success_count) to confirm that Geth metrics are shown.
View Cloud monitoring
Cloud monitoring should already be active for your virtual machine.
- From the Navigation Menu, under the Compute Engine section, click VM Instances.
- Click on the VM eth-mainnet-rpc-node.
- Click on the tab OBSERVABILITY.
- All sections should be showing a graph of different metrics from the VM.
- Click around the different sub-menus and timeframes to check out the different types of metrics that are captured directly from the VM.
Configure notification channel
Configure a notification channel that alerts will be sent to:
- From the Navigation Menu, under the Monitoring section, click Alerting.
- Click EDIT NOTIFICATION CHANNELS.
- Under Email, click ADD NEW.
- Type in Email address and Display Name of the person who should receive the notifications.
Configure metrics alerts
Configure alerts based on VM metrics:
- From the Navigation Menu, under the Monitoring section, click Alerting.
- Click CREATE POLICY.
- Click SELECT A METRIC.
- Click VM Instance, Disk, Disk Utilization and click Apply.
- Add filters:
device/dev/sdbstateused
- Click NEXT.
- Enter the Threshold value: 90%
- Click NEXT, select the following values:
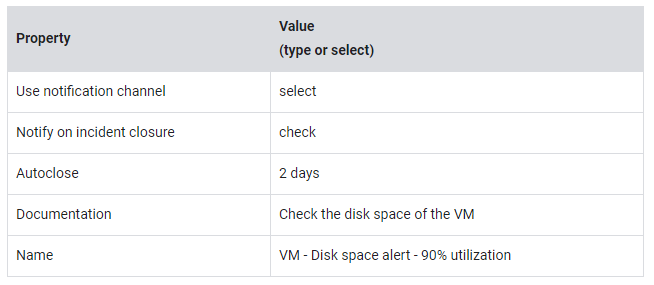
- Click NEXT.
- Click CREATE POLICY.
Configure Uptime checks
Configure uptime checks for the HTTP endpoint:
- From the Navigation Menu, under the Monitoring section, click Uptime checks.
- Click CREATE UPTIME CHECK.
- Configure the uptime check with the following values:
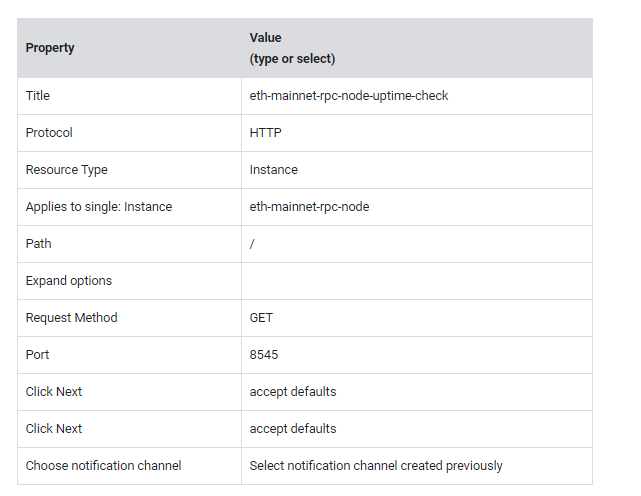
- Click TEST (should show success of 200 OK).
- Click CREATE.
Congratulations!
In this lab, you created a compute engine instance with a persistent disk, configured a static IP address, configured network firewall rules, scheduled backups, deployed Geth and Lighthouse Ethereum clients, tested the setup with Ethereum RPC calls, configured cloud logging and monitoring and configured uptime checks.
We hope you liked the Hands on Exercise by Creating and Running a Dedicated Ethereum RPC Node in the Google Cloud.
Next steps/Learn more
Additional resources to continue working with Ethereum
- To learn more about Ethereum client (execution layer), refer to Geth.
- To learn more about Ethereum client (consensus layer), refer to Lighthouse.
- To learn more about Ethereum in general, refer to Ethereum.
- To learn more about Google Cloud for Web3, refer to the Google Cloud for Web3 website.
- To learn more about Blockchain Node Engine for Google Cloud, refer to the Blockchain Node Engine page.
Happy Learning …. Happy Coding …..
Other Interesting Articles:
Effective Java Development with Lombok
AWS Lambda in Action
AWS SOAR: Enhancing Security with Automation
Java : Understanding The Golden Ration Phi
AWS Learning : Journey towards Limitless Opportunities in Cloud .
No-cost ways to learn AWS Cloud over the holidays
Understanding 𝗖𝗢𝗥𝗦-𝗖𝗿𝗼𝘀𝘀-𝗢𝗿𝗶𝗴𝗶𝗻 𝗥𝗲𝘀𝗼𝘂𝗿𝗰𝗲 𝗦𝗵𝗮𝗿𝗶𝗻𝗴