


Why You Need to Backfill Your SQL Tables
Ugh.
Whether I find out from an alerting system or directly from a stakeholder, "ugh" is my natural reaction when I learn that we have missing data.
Like many aspects of data-oriented work, context is what determines whether your missing data is a minor headache or a three-alarm fire.
In any case, identifying and fixing missing data must be a priority of anyone who deals directly with data that is used to guide organizational decision makers because missing, incomplete or error-riddled data can impact both real-time and historical analysis.
To account for these gaps SQL developers (typically data engineers) work through a sometimes-grueling process called backfilling.
If you're unfamiliar, backfilling is just a catch-all industry term used to describe the CRUD processes involved with correcting incomplete or incorrect data after it should have been loaded.
Since, as a SQL learner, you are mostly working independently with minimal data sources, it is unlikely that you have or will encounter this concept in independent study.
However, being aware of the importance of retroactively correcting anomalies in your tables, you'll be better positioned to keep your data functioning from day 1.
Determining Whether You Need to Backfill
If you're lucky, an automated alerting system or routine check of your individually-owned data sources will tell you whether you need to backfill.
If you're unlucky, it will be a confused, panicky stakeholder.
The backfilling identification process is very similar to the QA process, in that you're essentially double and triple-checking your work.
Unlike QA, you're doing this retroactively, not proactively.
Depending on your dataset, you'll really only need some kind of DATE() function and an analytic function like COUNT() to determine whether rows have loaded for the day.
Backfilling needs can broadly be grouped into three categories:
- Data never loaded
- Data partially or under-loaded
- Data over-loaded
Let's take a look at an example table to see how we'd figure out if something doesn't look quite right when evaluating the results of a daily load.
We'll use a BigQuery table I maintain to track my family's financial transactions, with each row representing a transaction and the date representing the date a transaction was processed by my bank.
I haven't gotten around to automating this process yet, so it will be naturally out-of-date, which is perfect for our use case.
Let's run a quick query to confirm our suspicions.
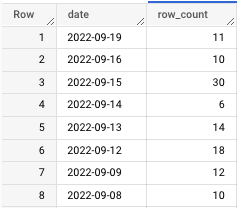
Which produces:
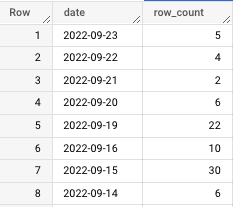
For context, this piece was originally written in October 2022.
With that in mind, we notice the following:
- The last update date was September 23rd, over a month ago
- There are three days missing from 9/16–9/19
- There are unusually high row counts on 9/15 and 9/19
In the next section we'll discuss how to fix gaps in the data.
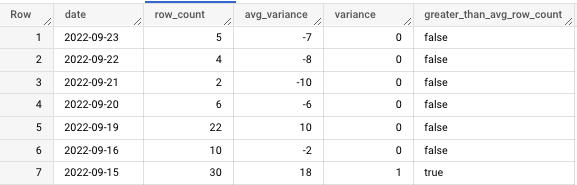
Right now, let's dive deeper into these row counts by running a query that tells me how they differ from the expected average row count.
By executing an AVG() function, I've learned that, on average, this table populates 12 rows per day.
To be clear, that's just an average. Higher-than-average row counts aren't necessarily incorrect, but they must be investigated nonetheless.
Let's talk about what's going on in this query before seeing the output.
The innermost query creates the original row count. As we work outward, I create a column to determine how "off" a given row count is from the average.
To help me visualize this further, I've created a boolean flag to let me know if a row count is greater than or less than the average.
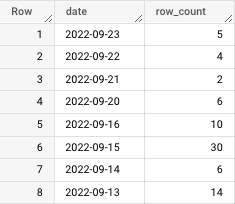
This might seem like overkill, but it helps me get a deeper understanding of any discrepancy in the data, as you'll notice from the output:
For the sake of example, let's assume that, in checking the table modification history and the logs for the cloud function that loads this, I come to find out that 9/19 and 9/15 aren't just unusually high row counts.
They contain duplicate data.
What then?
Pardon the interruption: To receive my latest writing, consider following me.
Conducting a Backfill
In this example, so far, we've learned:
- We are missing a month's worth of data from 9/23/2022 to 10/23/2022
- We are missing the days 9/17 and 9/18
- We have duplicate data on 9/15 and 9/19
I made this problem intentionally complex because, while sometimes fixing missing data is as simple as re-running a function or re-loading data, it can be a complex and time-consuming process involving multiple date ranges and issues.
The first two missing data problems are fairly simple to solve.
You would batch load data from the data source associated with the given table. This would be a series of DELETE and INSERT statements.
Frankly, it's not that compelling of a problem.
So I'll focus on a problem I encountered at work recently, overloaded data, which we see on 9/15 and 9/19.
Let's concentrate on the more recent date, 9/19.
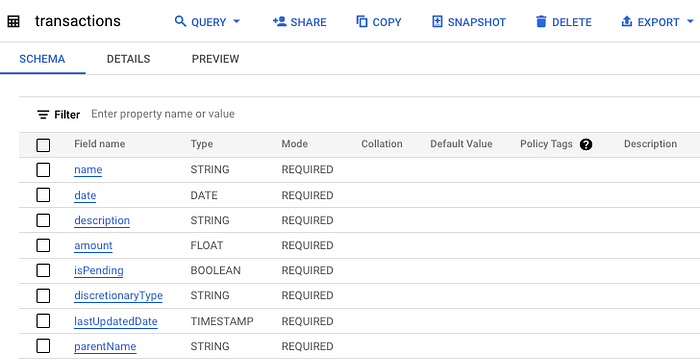
Because we're mainly working with write operations in this scenario, you'll want to be extremely careful going forward.
This is why I highly recommend creating a test table before doing anything that could impact production.
If your stack (personal or professional) includes BigQuery, this is very simple and can be done in the UI with the "Copy" command.
And here's the copied table:
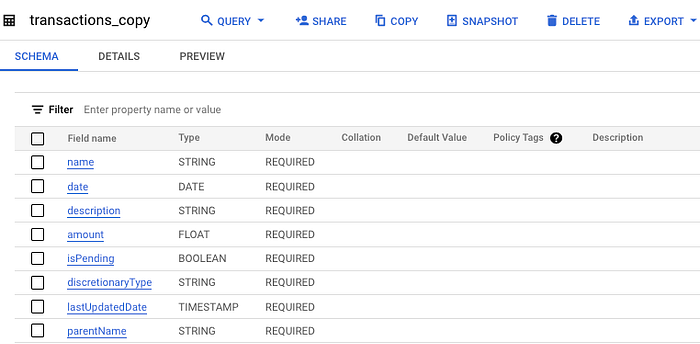
Now, if we want to make any changes, we can test them in the transactions_copy table before moving to production.
Returning to our problem's duplicate data, we have two options:
- We can run a query to de-duplicate
- We can delete the data for those days and re-load.
If this is a high-priority table, I would be safe and just delete and reload the data from its original source so you're sure the data is accurate.
However, if this is a lower-priority table and no one has received an alert about its state, I suggest you try to deduplicate the data.
The advantage of working with a test table is that we can delete the data from the source table and simply append the rows from the test table.
Here is the query I'll run to de-duplicate the over-loaded data on 9/19. I use the row number function to filter for only the first instance of each transaction's description. Alternatively, you can use RANK().
Now, let's see how this impacted the row counts in the test table.
For context, in this query, all I'm doing is combining the de-duplicated rows with the previous days' row counts by taking the count of anything before 9/19, giving us this output:
Nice! We went from 22 rows to 11; all of them are now distinct values.
The last step is to load this data into the production table.
Since we're touching production, you'll want to be cautious.
At the same time, know that you've already done the hard part, so all we have to do is delete and append.
For the delete statement, just delete with your target date in the WHERE clause, in this case "2022–09–19."
Now we'll look at production and see a gap where 9/19 should be.
If you're working in BigQuery you can use the UI to conduct the append step.
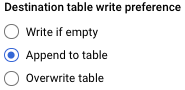
Note: When you enable a write preference in BigQuery always make sure you disable it as soon as you run your query.
Otherwise, you risk overwriting the table.
Now we'll run the query with the updated write preferences…
Here are the final, correct row counts in the production table, including 9/19.
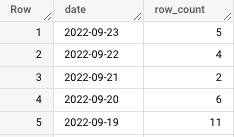
Great work!
Takeaway
It's important to remember that this method of backfilling only works if your data already lives in a SQL table.
There will be times when you'll need to re-load data directly from a source.
Some common backfill methods include:
- Adjusting the date filter on a cloud function and re-running
- Reconfiguring a low-code or no-code third-party tool to ingest the missing dates
- Re-tooling and re-running a SQL script that creates a data mart or other aggregation of data sources
The most important part of retroactively correcting data is awareness.
DO NOT blindly run delete and insert statements without knowing EXACTLY what your output will look like.
You could compromise production data and cause even more headaches.
Instead, take your time, work with a test table and, most importantly, update stakeholders when the data is corrected.
If you're lucky, you'll be able to get through this whole process before anyone realizes there was a mistake.
That's when you know you're a true professional.
Go from SELECT * to interview-worthy project. Get our free 5-page guide.