
🔹Background:
This analysis aims to develop a time series forecast model to predict patient enrollment trends in a clinical research project, assuming a scenario without the impact of COVID-19.
🔹Data Description:
The dataset used includes the following key fields:
- Date of Enrollment: Month and year when each patient enrolled, formatted as 'Mon-YY'.
- Enrolled Patients: Number of patients enrolled each month.
Raw Data:
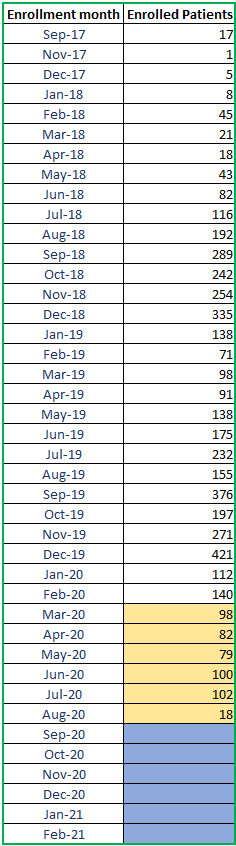
Notably, there was a clear drop in enrollments starting from March 2020, which coincides with the global onset of COVID-19-related restrictions. Our goal was to forecast monthly enrollments from March 2020 to February 2021, under the assumption of a no-COVID scenario.
🔹Forecasting Approach
What is Time Series Forecasting?
Time series forecasting is a method used to predict future values based on previously observed data, assuming that past trends and patterns will continue. In this project, we apply the ARIMA model, one of the most widely used techniques for time-dependent forecasting.
🔹ARIMA
Auto Regressive Integrated Moving Average model. ARIMA is a generalization of an autoregressive moving average (ARMA) model. Both of these models are fitted to time series data either to better understand the data or to predict future points in the series (forecasting).
🔹What is ARIMA?
ARIMA (AutoRegressive Integrated Moving Average) is a time series model that combines:
- AR (AutoRegressive): The forecast depends on past values.
- I (Integrated): Differencing to remove trend and make the series stationary.
- MA (Moving Average): Forecast depends on past forecast errors.
🔹R Implementation
EnrollmentData <- read.csv('EnrollmentRawData.csv')

print(Enrollment_Data) # print() displays the data.
dput(Enrollment_Data) # dput() outputs a reprod# Load data
Enrollment_Data <- read.csv('EnrollmentRawData.csv')
print(Enrollment_Data)

# Load libraries
llibrary("tseries")    # For ADF test and other time series tools
library("ggplot2")     # For data visualization
library("forecast")    # For ARIMA and forecast tools
library(FitAR)         # For fitting autoregressive models
library("fUnitRoots")  # For stationarity tests
library(lmtest)        # For model diagnostics
library(fpp2)          # Data sets and functions for forecasting
🔹 Stationarity Check
"Differencing is applied to remove trends and stabilize the mean of the time series."
d.COUNT <- diff(Enrollment_Data$Enrolled_Patients, differences = 3) # Computes 3rd-order differencing to make the series stationary (removes trend/seasonality).

# Prints basic stats for original and differenced series.
summary(Enrollment_Data$Enrolled_Patients)
summary(d.`diff Enrolled Patients`)

# Plots the differenced series and original as a time series.

plot(d.`diff Enrollment_Data$Enrolled_Patients`)
plot(as.ts(`Enrolled Patients`, type="multiplicative"))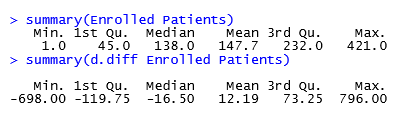
Augmented Dickey-Fuller (ADF) test checks if differenced series is stationary.
- Null hypothesis: series has unit root (non-stationary).
- Low p-value (< 0.05) → reject null → series is stationary.
adf.test(d.`diff Enrolled Patients`, alternative="stationary")Autocorrelation function ACF and Partial autocorrelation function PACF are used to identify AR and MA components for ARIMA modeling.
acf(Enrollment_Data$Enrolled_Patients, main = "ACF of Enrolled Patients")
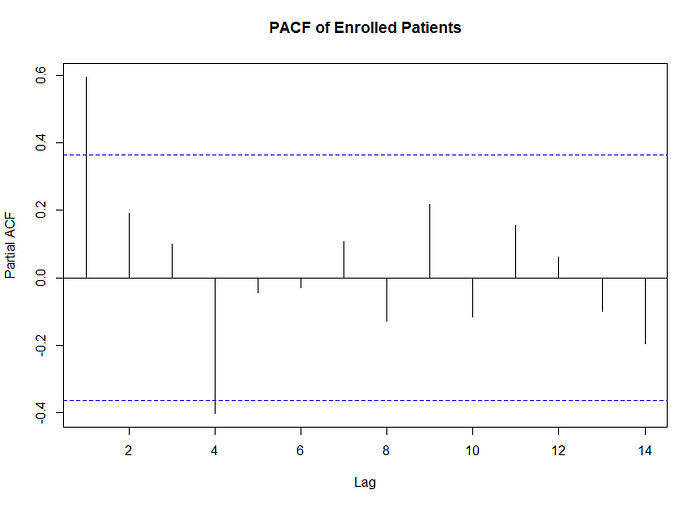
pacf(Enrollment_Data$Enrolled_Patients, main = "PACF of Enrolled Patients")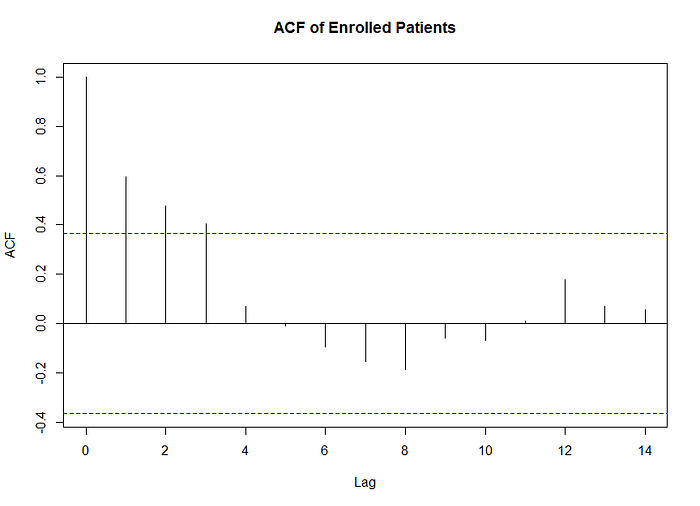
🔹Model Estimation
The auto.arima() function selects the best ARIMA model by searching through combinations of order parameters and choosing the model with the lowest AIC.
# Convert to time series
enrollment_ts <- ts(Enrollment_Data$Enrolled_Patients, frequency = 12)

# Fit ARIMA model
auto_model <- auto.arima(enrollment_ts, stepwise = FALSE, approximation = FALSE, seasonal = TRUE)
summary(auto_model)

# Forecast
forecast1 <- forecast(auto_model, h = 12)
plot(forecast1, main = "12-Month Forecast of Patient Enrollment")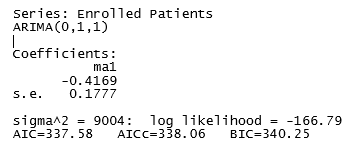
# Converts the column to a monthly time series object.
Enrollment_Data$Enrolled_Patients <- ts(Enrollment_Data[,Enrollment_Data$Enrolled_Patients], frequency = 12)
Automatically selects the best ARIMA model with seasonal component but disables stepwise selection and approximation for more accurate model search.
auto.arima(Enrollment_Data$Enrolled_Patients, stepwise = FALSE, approximation = FALSE, seasonal = TRUE)
🔹 Model Diagnostics
Fits a manual ARIMA model:
- (p,d,q) = (0,1,1) and seasonal (P,D,Q) = (0,1,0), period = 12 (monthly)
method = "ML"= Maximum Likelihood estimationtsdiag()plots diagnostics (residuals, p-values, etc.)- Shows model parameters
arima.final <- arima(Enrollment_Data$Enrolled_Patients, order=c(0,1,1), seasonal= list(order = c(0,1,0), period=12), method="ML")
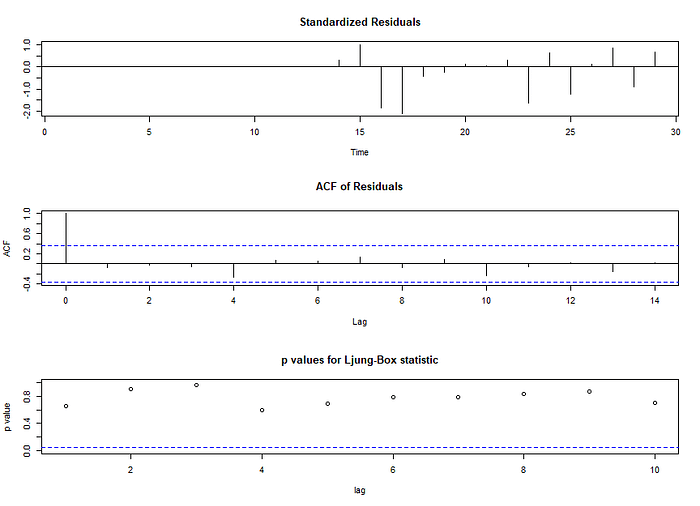
tsdiag(arima.final)
arima.final
Standardized Residuals: Residuals are mostly centered and non-patterned
ACF of Residuals: Little to no autocorrelation left.
Ljung-Box Test: Ljung-Box p-values indicate the residuals are uncorrelated.
The model appears well-fitted.
🔹Forecasting
Generates a 12-month forecast
forecast1 <- forecast(arima.final,h = 12)
forecast1
accuracy(forecast1)
🔹Summary:
- Model quality: Acceptable to good
- Bias: Slight overforecasting (ME & MPE negative)
- MAPE < 30%: Reasonable for many real-world use cases
- MASE < 1: Indicates model is better than naive benchmark
- Residuals (ACF1): No strong autocorrelation left — model captured main patterns

🔹Conclusion:
The ARIMA(0,1,1)(0,1,0)[12] model developed for forecasting monthly patient enrollments demonstrated strong performance, effectively capturing both trend and seasonal components in the data. Diagnostic tests confirmed the model's adequacy, with residuals behaving like white noise and no significant autocorrelation present. Forecast accuracy metrics, including a MASE below 1 and a MAPE of approximately 27%, indicate that the model outperforms baseline methods and provides reasonably accurate predictions. The 12-month forecast offers valuable insights with clear confidence intervals, supporting informed decision-making in resource planning and operational management. Overall, this ARIMA model serves as a reliable and interpretable tool for projecting patient enrollment trends in a healthcare setting.