Project Overview
This project showcases the deployment of a Kubernetes cluster using AWS EKS (Elastic Kubernetes Service), leveraging GitOps principles with ArgoCD for continuous integration and deployment. Istio is integrated as the service mesh to enable advanced traffic management, including canary deployments and monitoring. The application is a microservices-based platform, featuring services developed in Python, Ruby, Java, and Node.js.
The project employs key technologies such as AWS, eksctl, kubectl, GitHub, ArgoCD, Istio, Prometheus, Grafana, Kiali, and SonarQube. These tools are orchestrated to create a seamless DevOps pipeline, ensuring efficient deployment, robust monitoring, traffic management, and scalable operations for the microservices-based application.
1. Prerequisites
Before deploying this project, ensure the following prerequisites are met:
- AWS CLI: Used for managing AWS services and configuring EKS clusters.
- eksctl: A command-line tool specifically designed to create and manage EKS clusters with ease.
- kubectl: The Kubernetes command-line interface (CLI) for interacting with and managing the Kubernetes cluster.
- ArgoCD CLI: Provides the ability to interact with the ArgoCD server, enabling GitOps workflows for continuous deployment.
- Istio CLI (istioctl): Essential for managing and installing Istio as the service mesh for traffic management and security.
- Git: A version control tool used for managing code changes and collaboration.
- GitHub: Used to host the application code, configuration files, and repositories for version control.
- Basic Understanding: A solid understanding of Kubernetes, ArgoCD, and Istio concepts is highly recommended for effective deployment and management.
2- Cluster Creation
- Use
eksctlto create a Kubernetes cluster on AWS:
eksctl create cluster --name devops-projectThe cluster will serve as the foundation for deploying and managing containerized applications.
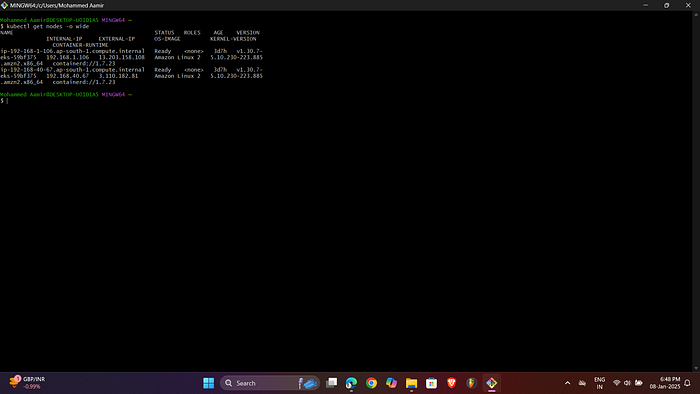
2. Verify the cluster's status and ensure all nodes are active and ready.
3- Set up GitHub Repository
- Initialize a Local Repository: Start a new GitHub repository to store application configurations:
echo "# devops-project" >> README.md
 git init
 git add README.md
 git commit -m "first commit"
 git branch -M main
 git remote add origin https://github.com/aamirjilu2/devops-project.git
 git push -u origin main
The repository acts as the single source of truth for the cluster's desired state.
2. Add Application Configuration Files: Fetch the Bookinfo application YAML file and add it to the repository:
curl https://raw.githubusercontent.com/vimallinuxworld13/eks_istio_bookinfo_app/refs/heads/master/bookinfo.yaml -o bookinfo.yaml
 git add .
 git commit -m "Add Bookinfo application"
 git push
Changes to this repository trigger automatic redeployments via ArgoCD.
4- Install and Configure ArgoCD
- Namespace Creation: Create a dedicated namespace for ArgoCD:
kubectl create namespace argocdNamespaces isolate resources, improving organization and security.
2. Install ArgoCD: Deploy ArgoCD into the Kubernetes cluster:
kubectl apply -n argocd -f https://raw.githubusercontent.com/argoproj/argo-cd/stable/manifests/install.yamlArgoCD monitors the GitHub repository for changes and ensures the cluster state matches the repository state.
3. Set ArgoCD Context: Switch kubectl to use the ArgoCD namespace:
kubectl config set-context --current --namespace=argocd4. Get Passsword from ArgoCD
argocd admin initial-password -n argocdUser Name is admin
5. Login to ArgoCD:
argocd login --coreThis ensures you can interact with the ArgoCD server for managing applications.
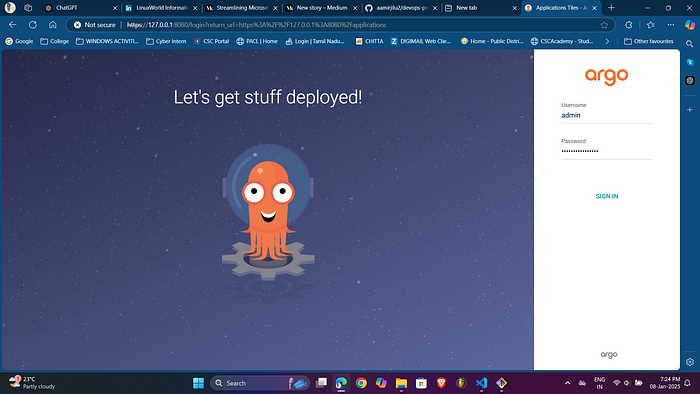
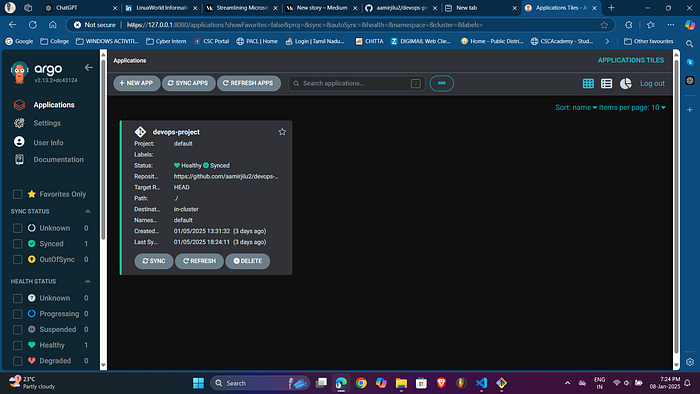
6. Access ArgoCD UI: Forward the ArgoCD server port to your local machine:
kubectl port-forward svc/argocd-server -n argocd 8080:443Access the ArgoCD dashboard at http://localhost:8080 to visualize and manage deployments.


5- Deploy Application
- Verify Pods: Check the status of the deployed pods:
kubectl get pods -n default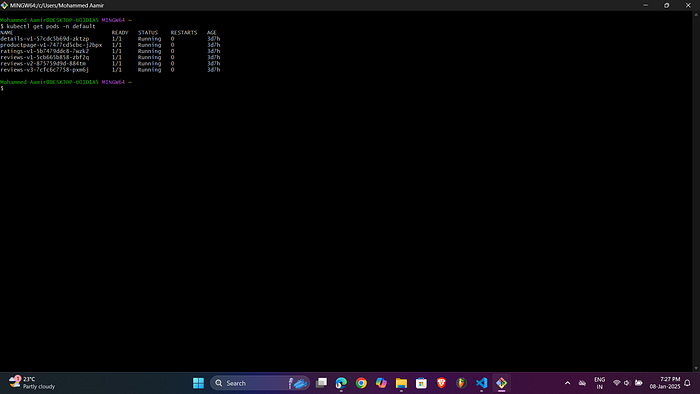
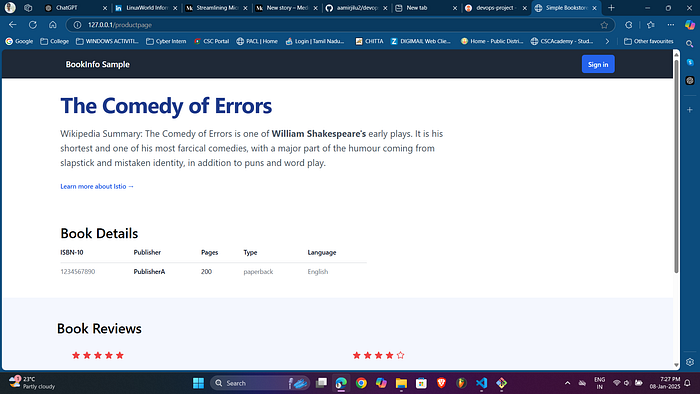
2. Access the Application: Forward the productpage service port to your local machine.
kubectl port-forward svc/productpage -n default 80:9080Visit http://127.0.0.1/productpage to view the application.
6- Install Istio
- Install Istio: Use
istioctlto install Istio with a demo profile:
istioctl install --set profile=demo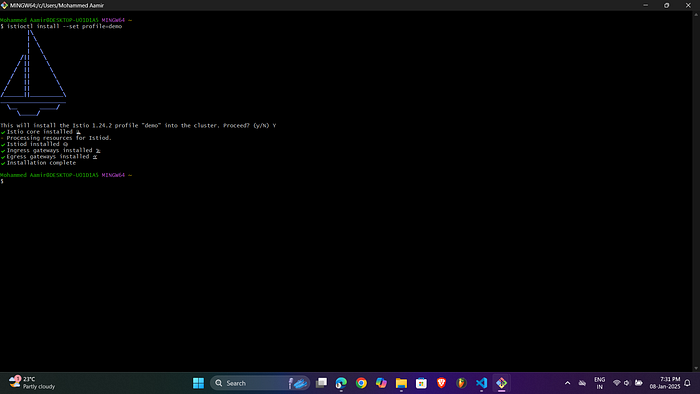
2. Verify Installation:
kubectl get pods -n istio-system
kubectl get svc -n istio-system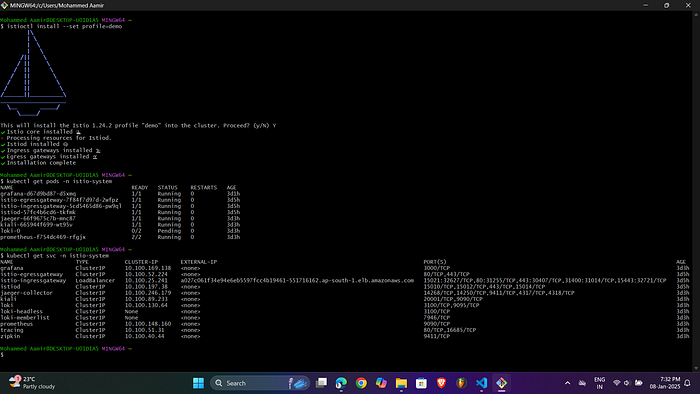
3. Enable Istio Injection: Label the default namespace for Istio injection:
kubectl label namespace default istio-injection=enabled
 kubectl delete pods --all -n default
Deleting pods triggers the launch of new pods equipped with Istio sidecar containers, allowing for enhanced traffic monitoring, management, and control within the service mesh.
4. Configure Gateway: Apply the Bookinfo gateway configuration:
curl https://raw.githubusercontent.com/vimallinuxworld13/devops_project_based_learning_2025_batch1/refs/heads/master/bookinfo-gateway.yaml -o bookinfo-gateway.yaml
kubectl apply -f bookinfo-gateway.yaml
The gateway facilitates external traffic flow into the microservices, providing controlled access to the internal services within the cluster.
5. This load balancer is created through aws so we will get a link from aws load balancer when we will paste it in browser it will show our wesite
http://a9748a186d1e4490d9d76ea3528c89f0-2124134678.ap-south-1.elb.amazonaws.com/productpag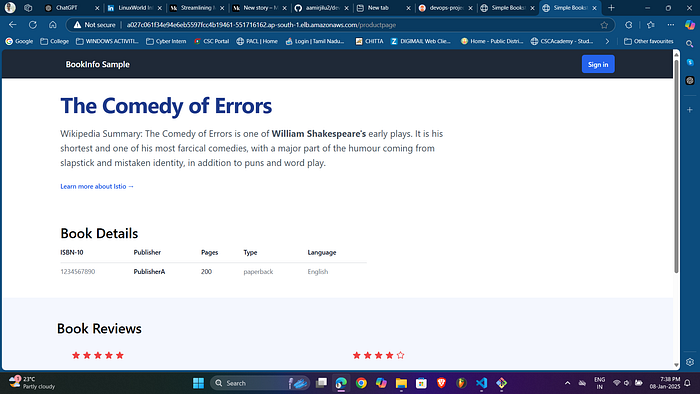
7- Traffic Management and Monitoring
- Install Istio Addons: Navigate to the Istio addons directory and apply configurations:
cd "D:\All Downloads\istio-1.24.2-win-amd64\istio-1.24.2\samples"
kubectl apply -f addons/
2. Verify Monitoring Tools:
kubectl get pods -n istio-systemThe output examples feature integrated tools such as Prometheus, Grafana, Kiali, and Jaeger for monitoring, visualization, service mesh management, and distributed tracing.
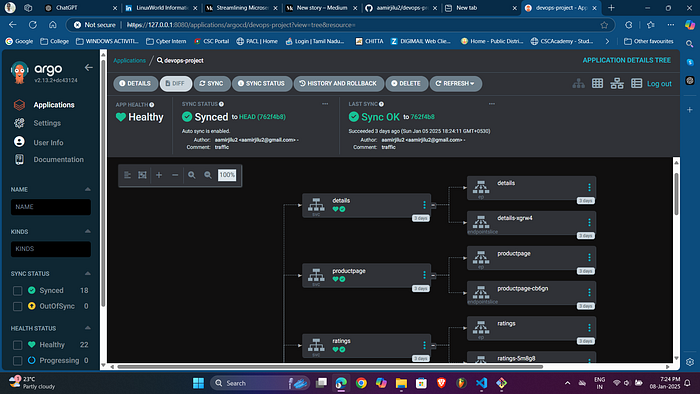
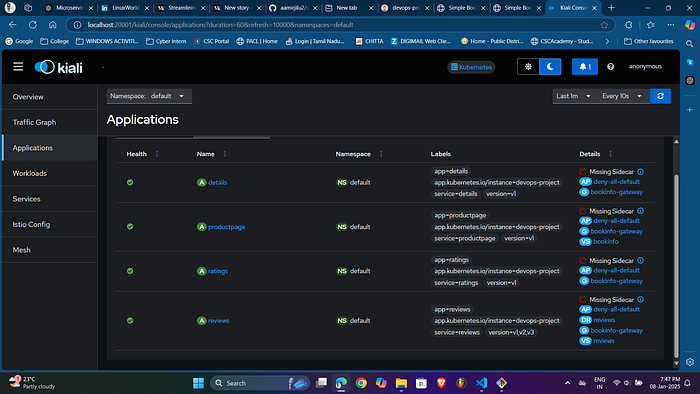
3. Access Kiali Dashboard:
istioctl dashboard kialiKiali offers an in-depth visualization of the service mesh, showcasing traffic flow and pinpointing any potential issues within the system.
4. Traffic Shifting: Use Kiali or CLI to configure traffic shifting between versions. Create destination rules and virtual services (e.g., vs.yml, dr.yml) to manage traffic split percentages.
5. Monitor with Prometheus:
kubectl port-forward -n istio-system deployment/prometheus 9090:9090
6. Visualize Metrics with Grafana:
kubectl port-forward -n istio-system deployment/grafana 3000:3000
8- Integration with SonarQube
SonarQube can be integrated to perform static code analysis, detecting code quality issues and vulnerabilities. This ensures that the code adheres to best practices before deployment.
Here's a refined version of your "Application Architecture" section:
9. Application Architecture
Microservices
- Productpage: Developed in Python, this service serves as the main entry point for users.
- Details: Written in Ruby, it provides detailed information about the products.
- Reviews: Built in Java, this service has three versions to demonstrate canary deployments for gradual rollouts.
- Ratings: Developed in Node.js, it retrieves product ratings and feeds them into the reviews.
Communication Flow
- Istio Gateway: All external traffic is routed into the cluster through the Istio Gateway.
- Private Load Balancers: Kubernetes load balancers handle internal communication between the microservices.
Service Interactions
- Productpage communicates directly with both the Details and Reviews services.
- Reviews interacts with the Ratings service to fetch product ratings.
10. Key Features
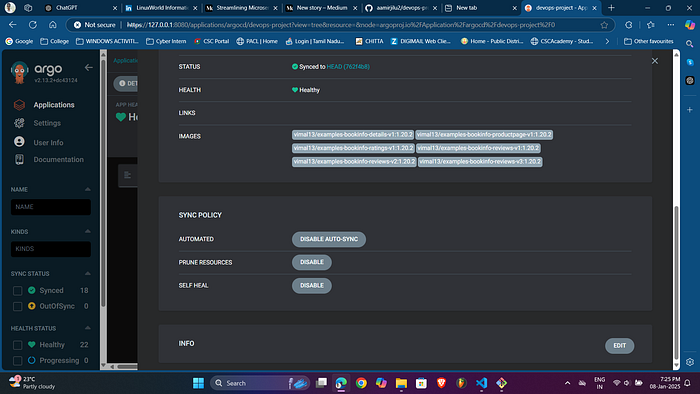
- GitOps: Continuous deployment is handled by ArgoCD, ensuring that the cluster's state is always synchronized with the GitHub repository.
- Service Mesh: Istio manages traffic control, monitoring, and security across services within the cluster.
- Monitoring Tools: Prometheus and Grafana offer comprehensive metrics and visualizations for application performance and cluster health.
- Visualization: Kiali provides a detailed view of the service mesh, including traffic flow and service interactions.
- Microservices Architecture: Each service can be independently developed and scaled, promoting agility and flexibility.
Technology Dependencies in the DevOps Workflow
- AWS & eksctl:
- AWS provides the cloud infrastructure to host the Kubernetes cluster, while eksctl simplifies cluster provisioning and management.
- Components like ArgoCD, Istio, and the microservices application are deployed within the Kubernetes cluster, making AWS and eksctl foundational elements of the architecture.
2. Kubernetes & kubectl:
- Kubernetes orchestrates the deployment, scaling, and management of the containerized microservices.
- kubectl serves as the primary CLI for interacting with the cluster, managing configuration, and monitoring resources.
- Without Kubernetes, there is no platform for deploying microservices or integrating essential tools like ArgoCD and Istio.
3. GitHub & ArgoCD:
- GitHub functions as the source of truth for application code and configurations.
- ArgoCD continuously monitors the GitHub repository to ensure the cluster's actual state matches the desired state defined in the repository. Any changes in GitHub automatically trigger redeployments, creating a seamless GitOps workflow.
- The integration with GitHub ensures that updates are version-controlled, auditable, and deployable with minimal manual intervention.
4. Istio & Kubernetes:
- Istio relies on Kubernetes to inject sidecar containers (Envoy proxies) into the pods, enabling advanced traffic management, monitoring, and security.
- Istio's features like gateways, virtual services, and destination rules operate within Kubernetes, making them tightly integrated.
- Kubernetes ensures that the application pods are running, while Istio adds powerful networking and observability capabilities.
5. Monitoring Tools (Prometheus, Grafana, Kiali, Jaeger):
- Prometheus integrates with Kubernetes and Istio to collect real-time metrics on application performance, cluster health, and traffic flow.
- Grafana visualizes these metrics by using Prometheus as a data source, displaying the data in user-friendly dashboards.
- Kiali offers a graphical representation of the Istio service mesh, utilizing metrics and logs collected by Prometheus and Istio.
- Jaeger provides distributed tracing, allowing detailed tracking of requests through the microservices.
Workflow Example
- A developer pushes code changes to GitHub.
- ArgoCD detects the update and automatically deploys the new application version to the Kubernetes cluster.
- Istio manages traffic routing for the new service, supporting canary deployments for gradual testing of the update.
- Prometheus collects performance metrics, while Grafana visualizes these in real-time dashboards. If any issues arise, Kiali and Jaeger provide insights into the service mesh and trace requests to identify the root cause.
- Developers can improve code quality based on SonarQube analysis, ensuring the application is robust before further redeployments.
This interconnected system guarantees smooth propagation of changes from code to deployment, with full visibility and control at every step.
Conclusion
The integration of Amazon EKS, ArgoCD, Istio, and comprehensive monitoring tools creates a highly automated, scalable solution for deploying and managing microservices-based applications. EKS provides a reliable Kubernetes environment for orchestrating containerized services, while ArgoCD streamlines continuous delivery using GitOps practices. Istio enhances traffic management, security, and observability, ensuring better control over service interactions.
Monitoring tools like Prometheus and Grafana offer deep insights into the system's performance and health, enabling proactive issue resolution. Together, this architecture ensures resilient deployments, optimized performance, and continuous monitoring, leading to a more scalable and efficient application lifecycle. This project demonstrates the strength of modern DevOps practices for managing cloud-native applications with agility and operational excellence.