
This project demonstrates how I automated an end-to-end supply chain analytics workflow using n8n (automation tool), Supabase (cloud PostgreSQL), and Quadratic AI (Excel+Python AI platform). From ingesting emails and parsing files to storing data and generating KPIs with prompts — this is a fully hands-free reporting system.
.
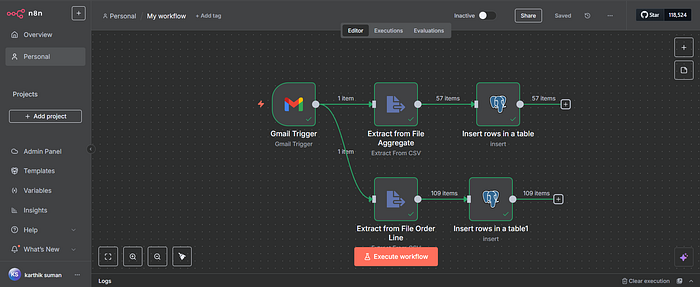
📩 Step 1: Trigger from Gmail Sales Email
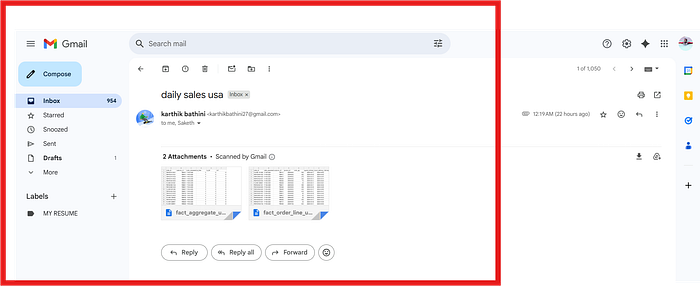
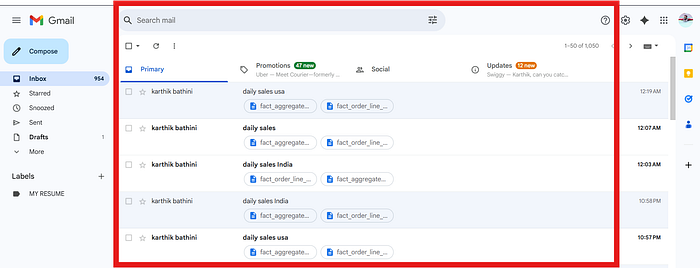
Every morning, the sales team receives an email labeled "Daily Sales" with attached order and aggregation files. The n8n workflow is triggered by this label.
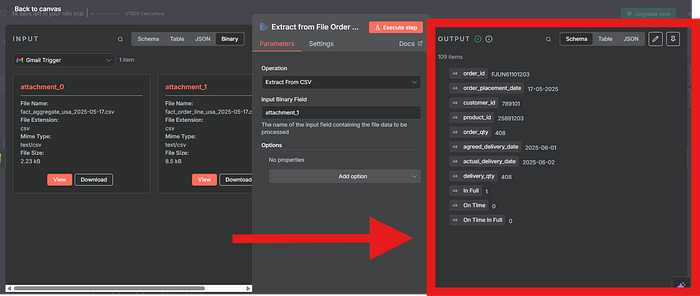
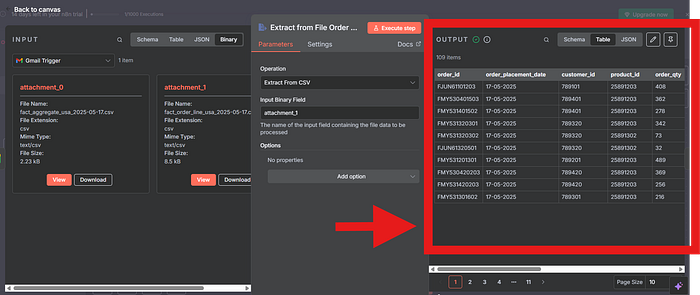
📂 Step 2: Extracting Data from CSV Attachments
Once the trigger fires, n8n downloads the attachments and parses two files:
file_aggregate.csv(57 rows)file_order_line.csv(109 rows)
These are loaded into the corresponding fact tables.
🧱 Step 3: Database Schema Setup in Supabase
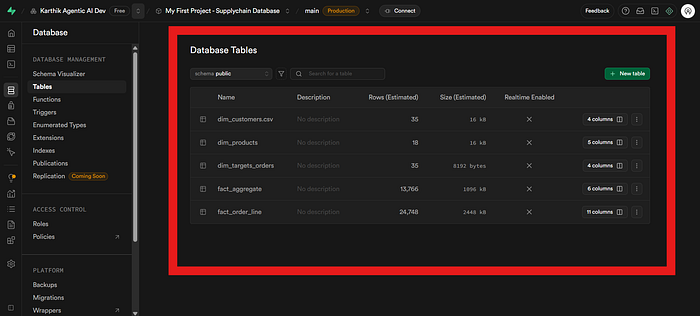
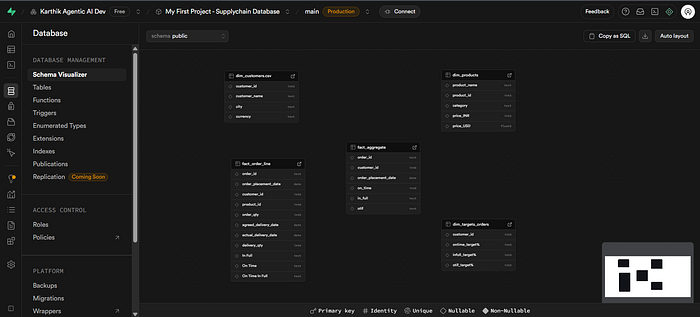
We designed a clean Star Schema with 2 fact tables and 3 dimension tables using Supabase's PostgreSQL environment.
Tables:
fact_aggregate,fact_order_linedim_product,dim_customer,dim_datefact_summaryfor unified KPI tracking
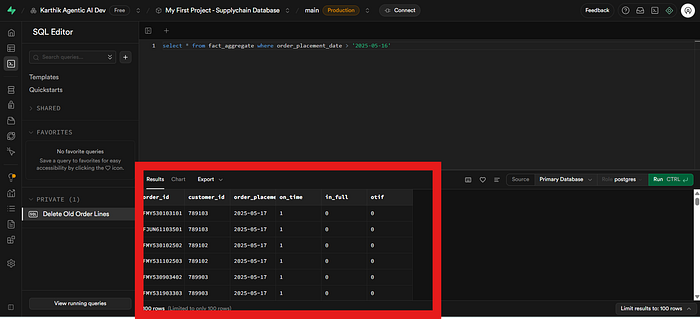
📤 Step 4: Loading Data into Supabase via n8n
n8n inserts data from each parsed CSV into respective Supabase tables. Schema mapping was performed in real time, ensuring clean column-to-column mapping.
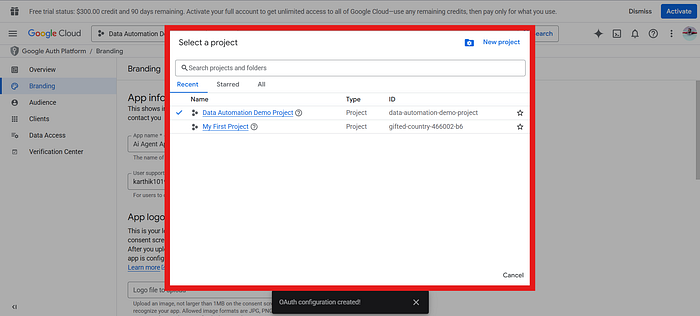
🔐 Step 5: Gmail OAuth Setup with Google Cloud
To use the Gmail Trigger in n8n, I created a Google OAuth Client ID, authenticated via Google Cloud Console, and authorized access using scopes.
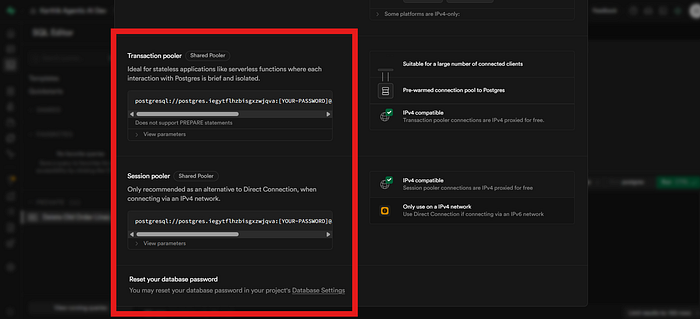
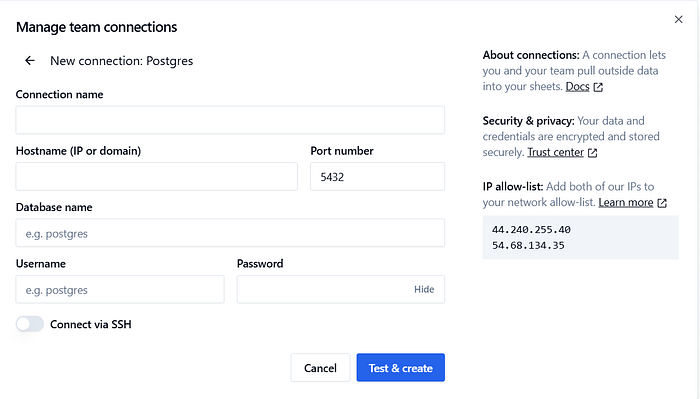
🌍 Step 6: API Setup in Supabase
With Supabase connection string and service role API key, I authenticated from n8n to the cloud PostgreSQL. This allowed programmatic inserts into all the fact/dim tables.
🤖 Step 7: Connect to Quadratic AI for Prompt-Driven Analytics
I linked the Supabase tables into Quadratic AI — an AI-powered spreadsheet tool where Python + AI logic can be applied to generate reports, dimension tables, KPIs, and more.
🧠 Step 8: AI-Prompt Generated Tables
Using just plain English prompts, I created:
dim_date(generated with date ranges using Pandas behind-the-scenes)exchange_rate_table(real-time FX rates from Open Exchange Rates API)
Prompt used:
Create an exchange rate table for USD to INR from March 1st to March 10th.
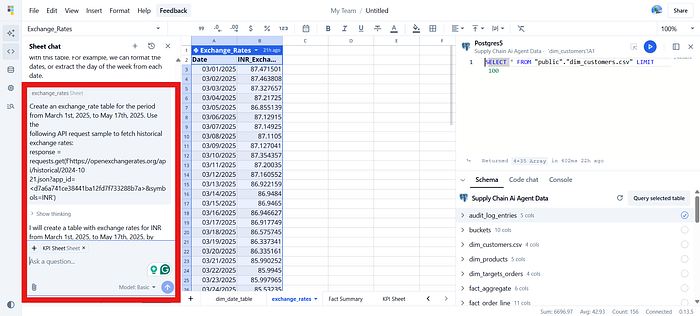
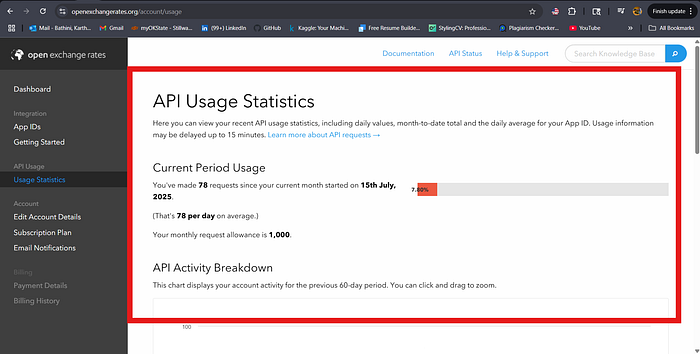
💱 Step 9: Connecting to Open Exchange Rates API
I used my API key and GET request in prompt format to pull exchange rates automatically into Quadratic, which helps convert and normalize international pricing.
📊 Step 10: Merging & KPI Visualization
All fact and dimension tables were joined using prompt-based logic to create fact_summary. From here, we calculated key Supply Chain KPIs like:
- ✅ Total Order Lines
- ✅ Line Fill Rate
- ✅ Volume Fill Rate
- ✅ Top 5 Customers (Global & India)

⚙️ Tech Stack
🧠 Automation & Orchestration:
- n8n — Designed and executed no-code ETL workflows with Gmail triggers and CSV parsers.
- Google Cloud OAuth — Used for secure Gmail API integration.
🗄️ Database & Backend:
- Supabase (PostgreSQL) — Designed star schema (fact & dimension tables), API-connected inserts.
- Supabase API Keys — Enabled automated connections via session pooler tokens.
📊 AI-Enhanced Analytics:
- • Quadratic AI — Prompt-based spreadsheet analytics with Python/Pandas backend.
- Prompt Engineering — Created
dim_date,exchange_rate, and summary tables using AI prompts.
🌐 External Integrations:
- OpenExchangeRates API — Pulled real-time FX data to normalize multi-country pricing.
- OAuth 2.0 Authentication — Secured integration across cloud and local apps.
🧩 Supporting Tools:
- CSV File Parsers — Extracted daily emailed reports for fact-aggregate & order-line data.
- Gmail Label Filters — Triggered automation on incoming "Daily Sales" emails.
🎥 Watch the Project Demo
Watch the complete walkthrough of my Supply Chain Data Automation using n8n, Supabase, and Quadratic AI in action:
👉 https://www.loom.com/share/5d5d07df8b1448b29904cd15b839599d?sid=234542a8-8af0-4dc4-98a0-5bdb904a379f
🧾 Final Thoughts
This project turned a manual, daily Excel + email workflow into a fully automated supply chain analytics pipeline. With simple prompts and no-code integrations, we eliminated:
- Manual data pulls
- Error-prone Excel entry
- Repetitive reporting tasks
I plan to extend this pipeline by integrating Streamlit dashboards and Slack alerts next.
🧑💻 Want to Build Something Similar?
💬 Message me if you'd like help setting up your own AI + Data Automation workflows using n8n, Supabase, and Quadratic. Let's automate your data life!