Single-cell RNA sequencing is one of the potent methodologies applied to studying single cells within complex tissues. Compared to bulk RNA sequencing, it is more sophisticated because it provides a way to investigate one cell independently. Typically, the technique involves enrichment of numerous cells by either droplets or wells followed by the sequencing of their RNA. To trace which RNA is derived from which cell, cellular barcodes have been developed. This is the most popular method on the 10× Chromium platform for sequencing parts of RNA from each cell. One particular feature involves the use of UMIs, which enable more accurate results. However, this technique only sequences the ends of RNA, which is a limitation.
Another strategy focuses on fewer cells but sequences them more deeply. In these cases, methods such as Smart-seq2 are used, which don't typically use UMIs but allow for the entire RNA sequence to be studied. These methods are often more sensitive but lack the barcode system to remove duplicates, making them quite different from droplet-based techniques.
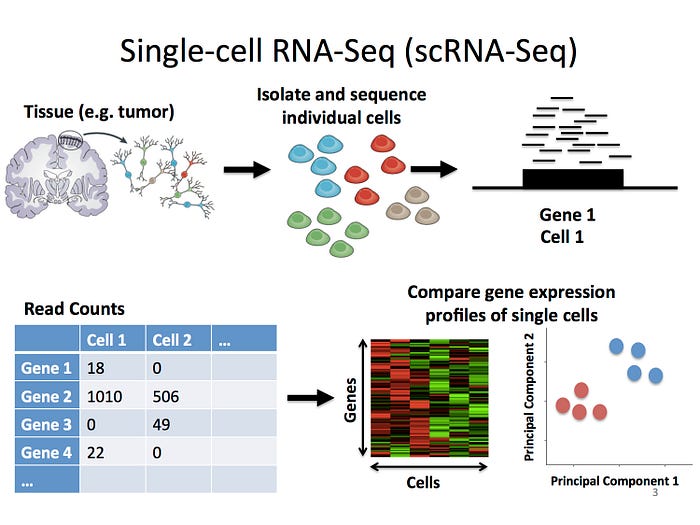
A key component of scRNA-seq analysis involves the construction of an expression matrix that displays the number of RNA molecules (transcripts) for each gene and cell. Further downstream analysis would then be done to find out which genes are active in each cell type. However, scRNA-seq often results in many zeros in the matrix because some genes are missed due to low RNA amounts or sequencing depth. These zeroes are a bit tricky because they may mean either that a gene is not expressed or just wasn't detected correct.
Step by Step:
- Quality Control:
- The first step in analyzing scRNA-seq data is filtering out non-cell barcodes and distinguishing intact cells from damaged ones.
- Challenge: Identifying doublets (barcodes tagging multiple cells) and detecting barcode multiples (multiple barcodes tagging the same cell).
- Resolution: Scrublet and DoubletFinder tools simulate doublets and distinguish them from singlets based on similarities.
- Normalization:
- Normalization corrects for uneven sequencing depth and cell-to-cell variability in RNA content.
- Challenge: Handling high proportions of zero values in shallowly sequenced datasets.
- Resolution: SCnorm and sctransform adjust for sequencing depth to compensate for gene expression variability.
- Batch Effect Correction:
- Batch effects arise due to differences in experiment timing or reagents and can confound biological signals.
- Challenge: Achieving balanced experimental designs is difficult when samples must be processed immediately.
- Resolution: Tools like ComBat and mnnCorrect address batch effects, even when biological conditions across batches are unknown.
- Imputation and Smoothing:
- Imputation predicts missing gene expression values, helping visualize scRNA-seq data more effectively.
- Challenge: Imputed values can introduce false biological patterns.
- Resolution: Tools like SAVER-X and netNMF-sc reduce false-positive signals by incorporating information from external sources.
- Cell Cycle Assignment:
- Assigning cells to their cell cycle stages is crucial for distinguishing biological effects from cycling stages.
- Tools: Cyclone and Seurat assign cell cycle stages based on relative gene expression levels.
- Feature Selection:
- This step identifies the most informative genes by detecting those with significant biological signals.
- Challenge: Detecting genes with variability only present in rare cell types.
- Resolution: Tools like GiniClust use the Gini Index to identify features in small cell populations.
- Dimensionality Reduction & Visualization:
- Techniques like PCA reduce the high-dimensionality of gene expression data for easier analysis.
- Visualization: UMAP has replaced t-SNE for scRNA-seq, preserving large-scale structures and embedding data into two-dimensional plots for easier interpretation.
- Unsupervised Clustering:
- Clustering identifies groups of cells with similar expression profiles.
- Popular Methods: Louvain algorithm (used in Seurat and SC3) for network clustering and k-means-based clustering are commonly applied.
- Pseudotime Analysis:
- This method traces cell differentiation or time-course processes in single-cell data.
- Tools: Monocle and TSCAN infer cell trajectories and assign pseudotime positions.
- Differential Expression (DE):
- DE analysis compares gene expression distributions across cell groups, though scRNA-seq poses additional challenges due to data complexity.
- Tools: MAST and the Wilcoxon test perform well for identifying differentially expressed genes in scRNA-seq data.
This provides a broad overview of the challenges and solutions used in single-cell RNA-seq analysis, offering a step-by-step breakdown from quality control to advanced analyses like clustering and pseudotime inference.