


I used to be a huge ramen consumer. And predictably, I reached the peak of my consumption over college days. Who doesn't love to slurp a bowl of ramen during days of snowstorms and bad food from the college dining hall?
Like any other food we eat everyday, there are good and bad ramen. In this article, I would love to talk about the worst ramen in the World, through exploratory data analysis (EDA).
There are 5 sections in this article:
- Data: a brief introduction to the dataset and where to get it
- Data structure
- Numerical variable: a deeper look into why rating column is not a numerical column, and how to transform it into one
- Categorical variables: a deeper look into some categorical columns, and how to fill out missing values
- The worst ramen in the World: dive into which countries and brands having these ramen
- The most unexpected ramen
1. Data
Now you might be surprised:
"There is a dataset on ramen?"
Yes, I was as well! This is a dataset with a rating for each ramen from Hans Lienesch aka the Ramen Rater. He has enjoyed eating instant noodles since he was a child, and he decided to make a website on his reviews for ramen all over the World.
Hans also published his rating dataset that I'm using in this article:
There are things to keep in mind before we dive into the data:
- Because Hans is the only rater, I think the rating is biased to his preference. For a fun EDA, without any machine learning application, this is an interesting dataset to look at
- The full list contains 2816 observations. It was 2943 last year when I first took a look — I think Hans must have cleaned it up a bit.
- Hans has some Top Ten lists: https://www.theramenrater.com/top-ten-lists/. The column
Top Tenin this dataset might or might not reflect them
2. Data Structure
df = pd.read_csv("../data/TheRamenRater_TheBigList.csv")
df.shape
There are 2816 rows and 7 columns in this dataset.
df.info()The information from df.info() shows that Style and Top Ten columns are the two with missing values.
Star is the column that includes the rating for each ramen, which makes me expect that it should be a numeric column. Opposite from what I expected, this column is an object type. This means that there are string values in this column, which we will take a further look later.
<class 'pandas.core.frame.DataFrame'>
RangeIndex: 2816 entries, 0 to 2815
Data columns (total 7 columns):
Review #    2816 non-null int64
Brand       2816 non-null object
Variety     2816 non-null object
Style       2814 non-null object
Country     2816 non-null object
Stars       2816 non-null object
Top Ten     41 non-null object
dtypes: int64(1), object(6)
memory usage: 154.1+ KB
3. Numerical variable
For further analysis, I want to transform Stars column into a numeric one. Before doing this transformation, let's find out why it is an object.
df['Stars'].unique()I see that besides continuous rating from 1 to 5, we have ramen that are Unrated, NR or having mixing numeric rates such as 5/2.5 or 3.5/2.5.
I tried to search around to understand what NR stands for and why there are Unrated or mixing rated ramen but couldn't find a clue. Because there is under 1% of our data having these values, I will remove them and transform the column to a numeric one for further analysis.
fig, ax = plt.subplots(figsize=(6, 5))
ax = df['Stars'].hist()
plt.xlabel('Rating')
plt.ylabel('Number of Ramen')
_ = plt.title('Rating Histogram')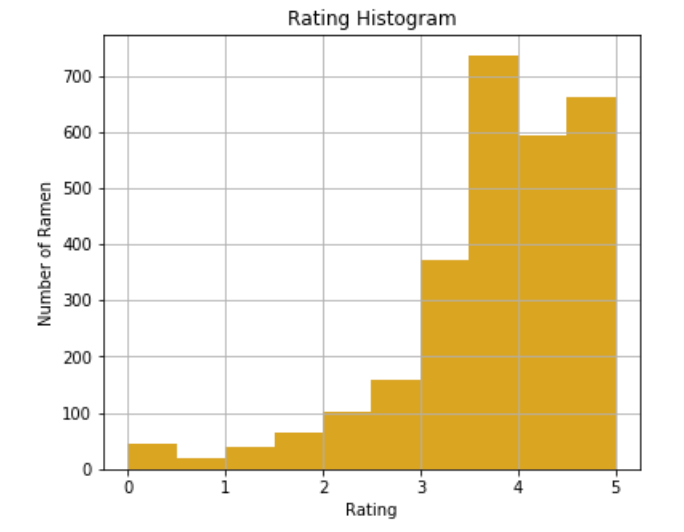
df['Stars'].mean()
df['Stars'].median()
On average, Hans rates around 3.7 for a ramen. This and the distribution shows that Hans generally rates ramen above 3 stars.
4. Categorical variables
df[['Brand', 'Variety', 'Style', 'Country', 'Top Ten']].nunique()There are 5 categorical variables in this dataset. They are:
- Brand: 388 unique values
- Variety: 2631 unique values
- Style: 8 unique values
- Country: 39 values
- Top Ten: 28 values
Let's take a look at Style and Top Ten together.
4.1 Style
There are different styles of ramen: Pack, Cup, Bowl, Tray, Box, Restaurant, Can, and Bar.
The information from df.info() suggests that there are 2 missing values in this column.
df[df['Style'].isnull()]
These are the two ramen without style values. I did a little search and they look like a Pack to me, so I will fill in the blank here with Pack.
- Kamfen E Menm Chicken: https://www.theramenrater.com/2011/06/17/428-kamfen-e-men-noodles-artificial-chicken-soup-flavor/
- Unif 100 Furong Shrimp: https://www.theramenrater.com/2010/09/14/unif-100-instant-noodles-furong-shrimp-flavor/
df['Style'] = np.where(df['Style'].isnull(), 'Pack', df['Style'])Above is a very lazy code to assign a value to a missing row. It works in this case, but it is not the best solution. Why?
- It works here because both of my missing values can be filled with
Pack - It will not work if we have to fill different values for each of them
4.2 Country
Do you know that ramen doesn't come only from Asia, but from countries all over the World? Here is the list of countries in this dataset.
df['Country'].sort_values().unique()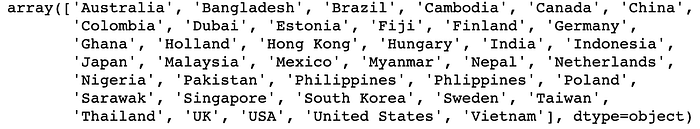
4.3 Top Ten
Apparently, this column only has the top ten ramen in each year, from 2012 to 2016. And it does not include all top ten that I mentioned above (https://www.theramenrater.com/top-ten-lists/)
df['Top Ten'].unique()
df['Top Ten'].str.split("#", expand=True)[0].sort_values().unique()
5. The Worst Ramen in The World
As observed above, most of Hans' ratings are above 3, which makes me super curious about those having ratings below 3, especially the lowest ones — I actually want to try those to see if they really deserve the low rating.
Before finding out these ramen, I have to say that Hans has an interesting rating system with decimals. I'm sure there are reasons behind it. But to simplify my analysis, I will bin ratings into these groups:
- 0–1
- 1–2
- 2–3
- 3–4
- 4–5
I choose the worst ramen are those that are rated from 0 to 1 star. Let's dive into this list.
worst_ramen = df_copy[df_copy['RatingGroups'] == '0-1']5.1 Brands with the worst ramen
worst_ramen.groupby('Brand')['Variety'].count().sort_values(ascending=False).head(3)The brands with the most number of worst ramen are:
- Baijia: 6 ramen
- Acecook: 4 ramen
- Maruchan: 3 ramen
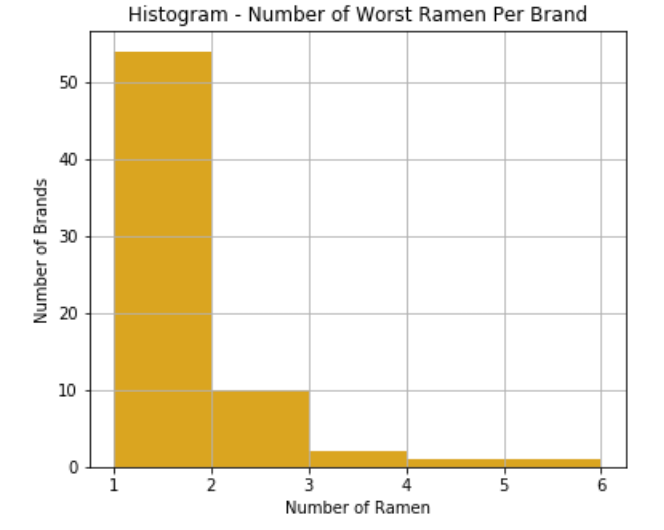
They are not necessarily the worst brands though, because the total number of worst ramen under each brand doesn't differentiate that much.
5.2 Countries with the worst ramen
Here are the top 5 countries with the most number of worst ramen. I'm pretty surprised that Japan is there!
- Japan: 13 ramen
- United States: 12 ramen
- China: 12 ramen
- Taiwan: 10 ramen
- Canada: 10 ramen
My hypothesis is that Japan produces a lot of ramen (or Hans might have tried a lot of Japanese ramen), so proportion-wise, it might not be too bad.
There are only 3% of all Japanese ramen in the worst ramen list. But to be certain whether it is actually bad or not, we need to compare this percentage to other countries' percentages. I will save this for another time.
6. The Most Unexpected Ramen
Besides the worst ramen list, some very unexpected ramen really open my mind! Have you ever tried Anchovy Flavor Guava Rice Noodles, Pringles Nissin Top Ramen Chicken Flavor Potato Crisps or better yet Komforte Chockolates Savory Ramen?
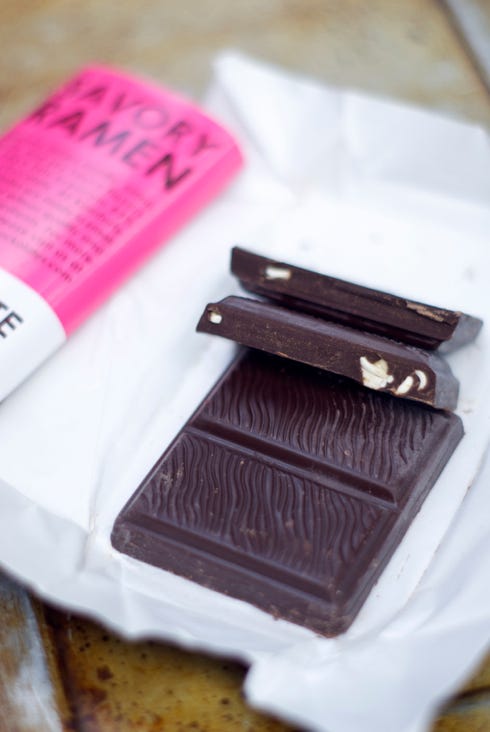
Well, this ramen chocolate really ends this article strong. Maybe in the next post, I will make some reviews on the savor of this Savory Ramen 😜
Here is the full tutorial with detailed code and more EDA tips.