

Post college, I was the only female in a hard core fantasy football league. I had to know my stuff. I was often a bridesmaid and thought that I was finally going to take home the title in 2007 with the Brady-Moss combo. Then came that Week 15 Jets game — 140 yards and 0 touchdowns for Brady, 79 yards and 0 touchdowns for Moss. I'd have to wait another year.
That year finally came in 2014.
DeMarco Murray, Demaryius Thomas and Ryan Tannehill (really???) brought me the championship and after 15 years of fantasy I decided to go out on top and retired from fantasy. I have to say… it was incredibly liberating to finally be able to root for my teams without worrying about the fantasy points for and against my fantasy team.
I often have trouble when I'm searching on Kaggle for a dataset. I want to find something that interests me, something that I may have a bit of domain knowledge about. So when I came across the College Football Team Stats 2019, Team Statistics For Each FBS Level College Football Team dataset, I got a little bit excited, this is right in my wheelhouse.
"Inside the data is the team statistics for all of the 130 FBS level teams, it includes offensive, defensive, turnover, redzone, special teams, first down, third down and fourth down stats. There are 145 difference team statistics that can be used."

Whenever you start to work with your dataset you always want to start with a little exploratory data analysis to see what you are working with. My initial thoughts are that I want to eventually drill down to analyze the teams at a conference level but only time will tell if that is where I end up.
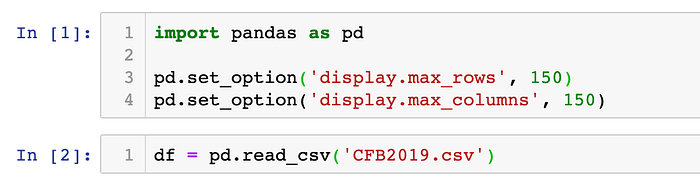
After I download the csv dataset, I need to import my libraries and create a dataframe from the csv:
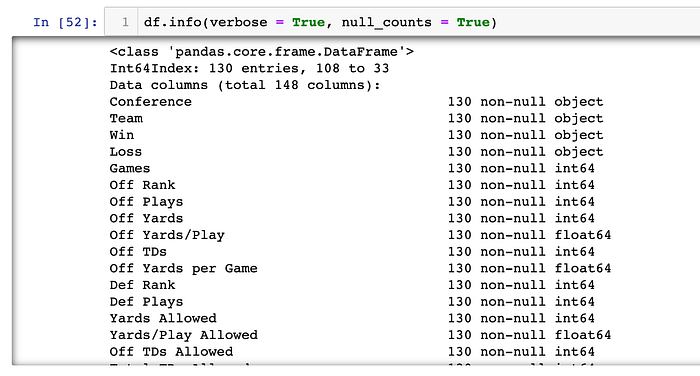
I then want to view a summary of the dataframe. To do this I will use the df.info() method. This method will print the index dtype and column dtypes, non-null values and memory usage:
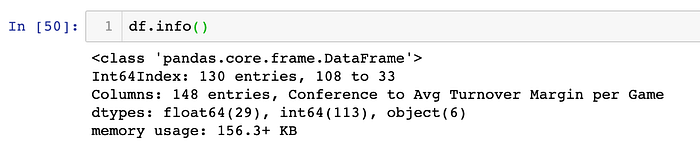
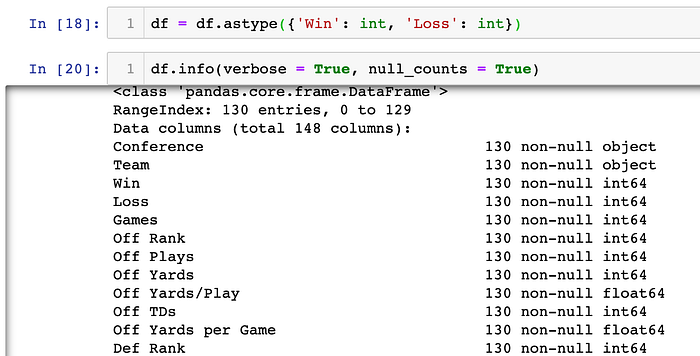
This output looks different to what I am used to seeing - why am I not getting a table with the column names, non-null values and datatypes? From a little bit of online research, I learned that, due to the number of columns, I needed to set some parameters in order to get the full summary:
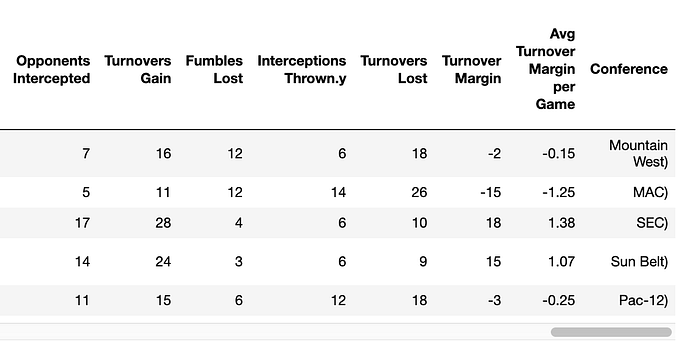
This looks like a very clean dataset and we may not need to do much, if any, preliminary clean up. Let's check out a few of the rows of the dataset:
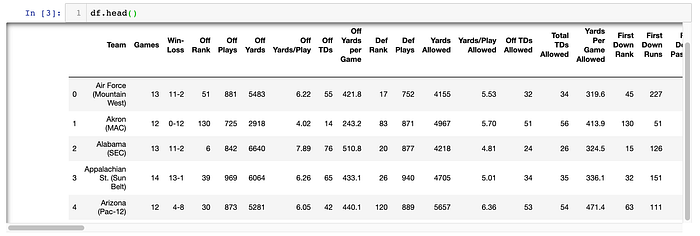
Right off the bat, I can tell that I know that I am going to want to split the conference from the school/team and that I am going to want to split the Win-Loss column into a Win and a Loss column:

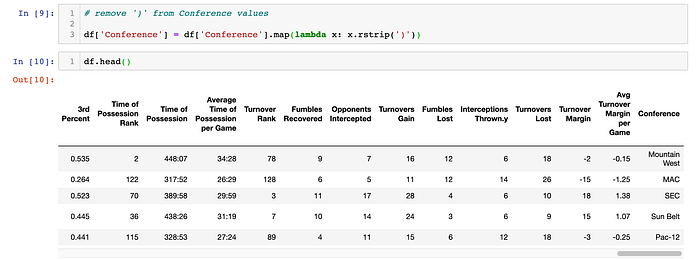
Looks like that did the trick. But I'm a little bit OCD and don't like that ending parenthesis:
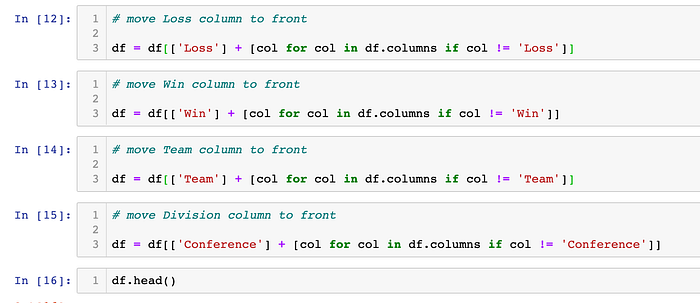
I want to also split the Win-Loss column:

Because I think the table would be easier to read, I want to move the Conference, Win and Loss columns to the beginning of the table:
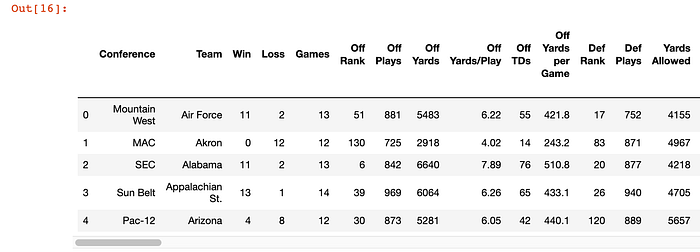
Good to go so far!
Earlier, when I was looking at the summary of the data, I noticed that the Win-Loss column is a object datatype. That means that both the Win column and Loss column are also object datatypes. I want to convert them to integer datatypes:
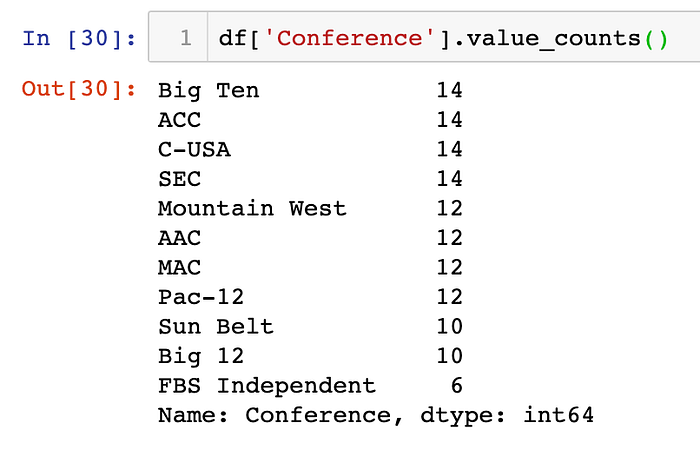
Now that I have done a little bit of cleanup, I really want to start looking at the data I have. Since my original goal was to look at the teams at a conference level, I started there:
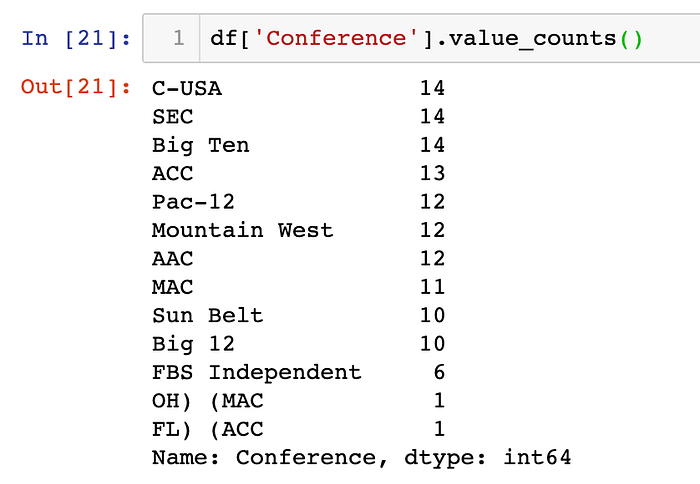
Isn't that interesting… it looks like when I was splitting the conference from the team and using the parenthesis as a delimiter, I didn't take into account that the team name might contain parentheses. To take care of that, I first searched for those two records:

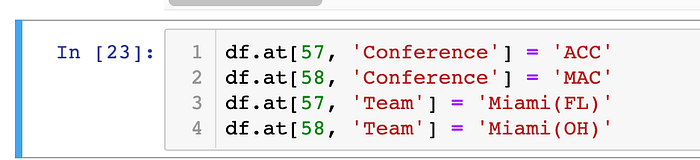
And now I will change Conference and Team values to their proper values:
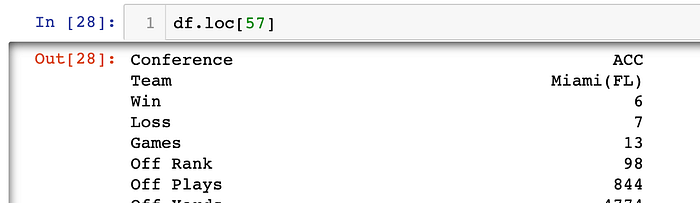
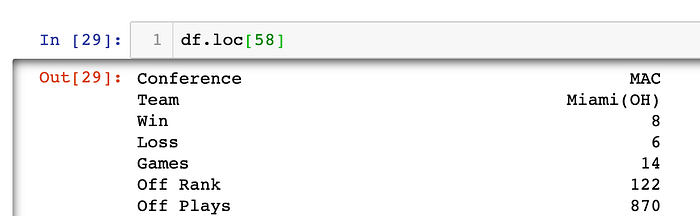
Checking my work:
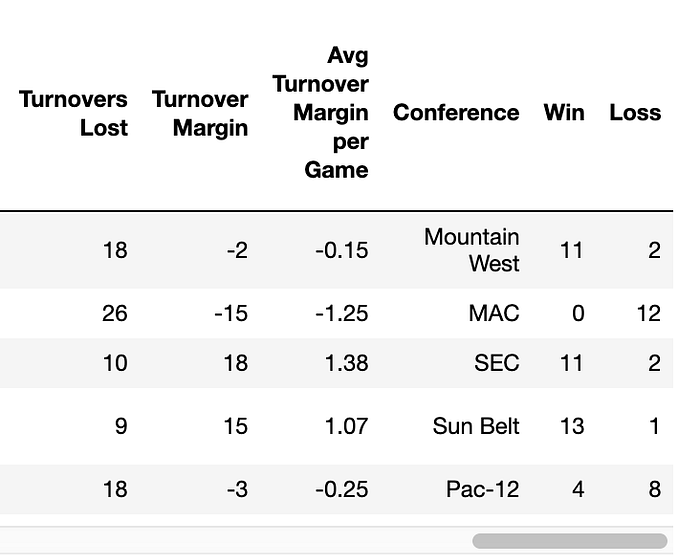
I want to sort the table by the Conference and then by the Wins in descending order (again, just a little bit of my OCD):
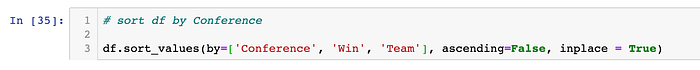

At this point, I now believe that I am ready to drill down on the data. Of course you always need to be prepared for little things are to pop up (such as the two schools not being split properly). I'm going to start with the Big Ten as that's my conference (I bleed blue and white!), but that is for another day. Stay tuned!