

Introduction
The largest global pandemic since the 1918 Spanish Flu is upon us today. The novel coronavirus is bringing countries to a halt and causing widespread health impacts and fatalities. The evolution of this virus is one of the most dangerous problems for society. In this article, I've attempted to take a closer look at the data and trends to analyze worldwide COVID-19 cases and mortality statistics across countries.
In this article, I will walk you through the steps I undertook for this analysis with code snippets and visuals. You can find the full code here: Kaggle Notebook. I've used Johns Hopkins Covid-19 dataset to analyze and build the visualizations.
Steps involved in Data Analysis:
- Importing required packages
2. Data gathering
3. Data Transformation and Data Wrangling
4. Exploratory Data Analysis (EDA) and Visualization
Step 1: Importing required Packages
Python provides a wide variety of packages and in this analysis, I used python's most popular packages Pandas and NumPy for Data analysis and EDA. For data visualization, I've used python's interactive packages Matplotlib and Plotly. Here's the code for importing packages using Python:

Step 2: Data Gathering
I've used Johns Hopkins COVID-19 dataset to extract the data for this analysis. This repository has data of confirmed cases, deaths, and recoveries from the beginning of the outbreak reported for each of the countries on a daily basis
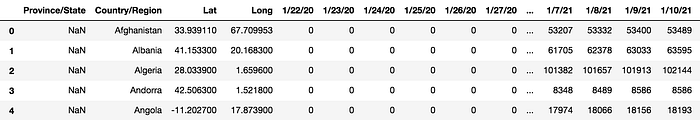
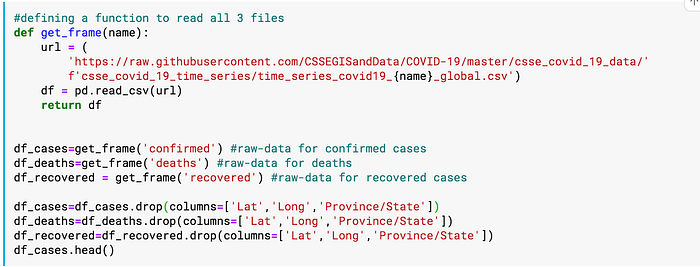
Here's the code snippet for extracting COVID-19 data using Python
Using this dataset, we'll be analyzing the current trend of confirmed cases & deaths across countries along with the time-series visualization of COVID-19 cases
Step 3: Data Transformation and Data Wrangling
Once we have extracted the dataset, we will transform and clean our data as per our needs. Here are the 3 major data transformation steps to proceed with our analysis
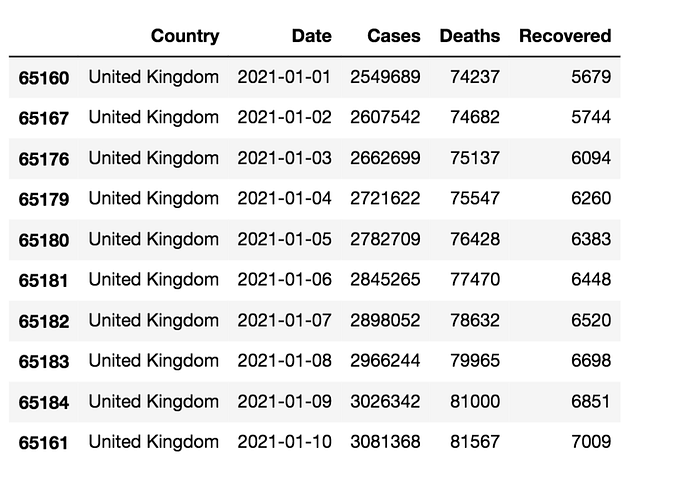
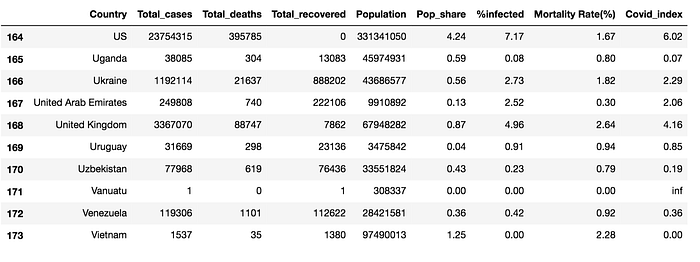
- Data aggregation: Currently, we have three different files with each of these files containing different metrics. We'll first combine these three datasets into one with cases, deaths & recovery as three columns of that table. Also, the date field is currently split into different columns so we will create one column for storing the date info. In the end, we will aggregate the data for each of the countries as shown below
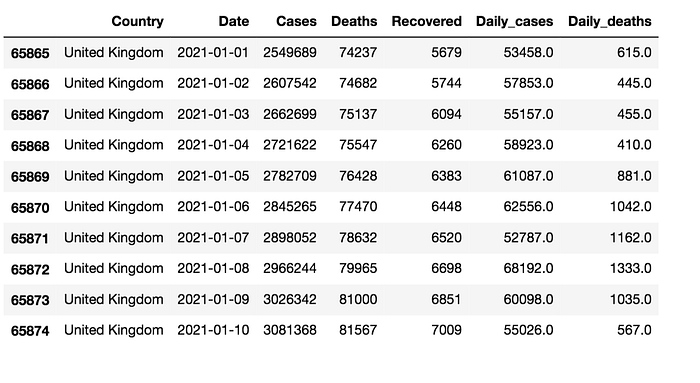
- Daily trends: As you can see in the above figure, the dataset contains cumulative cases/deaths on a daily basis. I've created two more columns that will store daily new confirmed cases & deaths for each of the countries along with the cumulative data
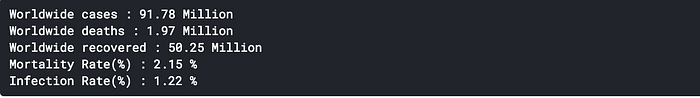
- Addition of new metrics: In the next few sections, along with the daily cases/deaths, we will also analyze and compare Infection rate (what percentage of a country's population has been infected by COVID-19), Mortality rate (Total deaths out of every 100 COVID-19 cases) to measure the varied impact of COVID-19 across each of these countries. These are a few derived metrics that I've created for further analysis
Step 4: Exploratory Data Analysis and Data Visualization
For Exploratory Data Analysis and data visualization, I am using Plotly, a visualization tool available in python which supports a number of interactive, high-quality graphs. I've divided the data visualization part into two steps:
- Current trend: Ranking countries based on COVID-19 cases & deaths
- Time Series visualization of COVID-19 cases & deaths
Ranking countries based on COVID-19 Cases & Deaths
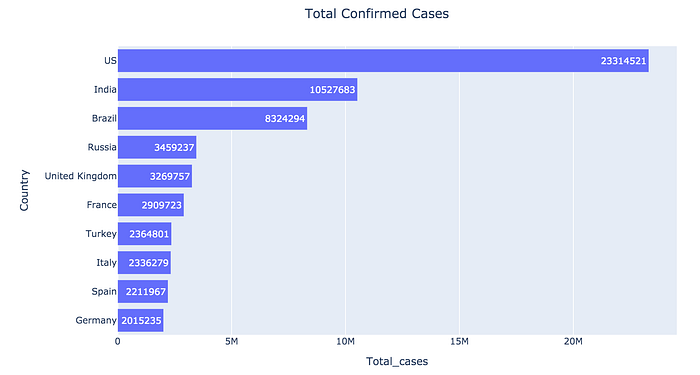
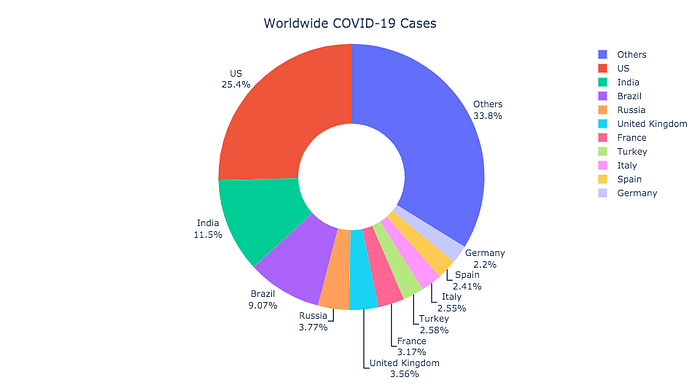
i) Top 10 Confirmed Cases Countries:
The following chart depicts a plot ranking TOP 10 countries based on confirmed cases and the contribution of cases from each of these countries. The top 4 countries contribute ~50% of the worldwide COVID-19 cases with the US having the highest confirmed cases to date (~23 MM) contributing ~25% of the worldwide COVID-19 cases
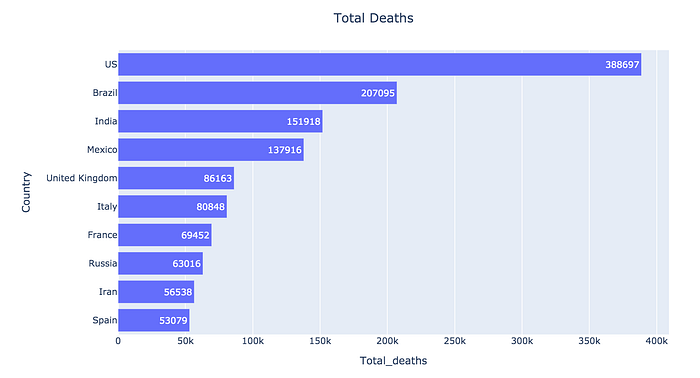
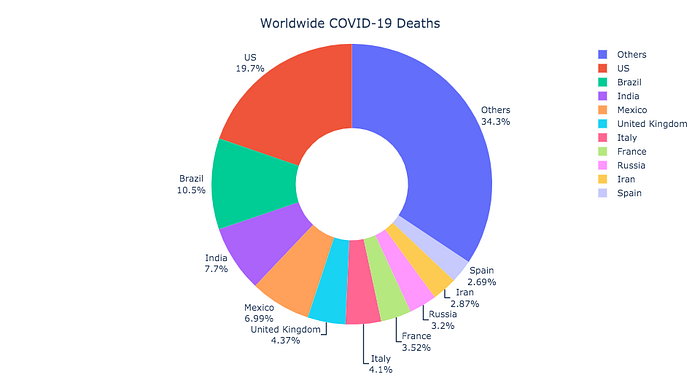
ii) Top 10 Death Cases Countries:
The following chart depicts a plot ranking TOP 10 countries with the highest COVID-19 deaths and their overall contribution to worldwide deaths. The top 5 countries contribute ~50% of the worldwide COVID-19 deaths with the United States having the highest number to date (~388k) contributing ~20% of the worldwide COVID-19 deaths
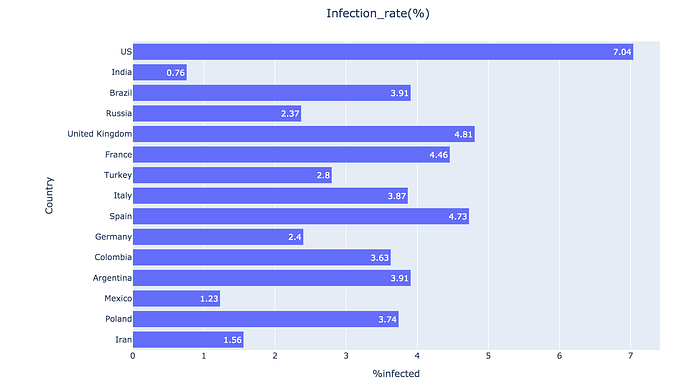
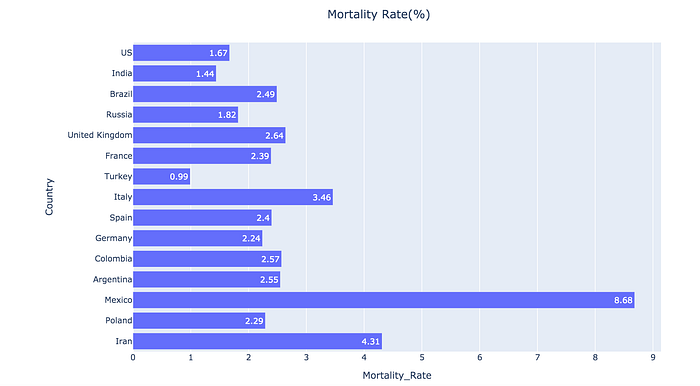
iii) Infection rate(%) & Mortality rate(%) of Top 15 worst-hit countries
Infection rate(%) tells us what percentage of a country's population is infected by COVID-19. It is the number of confirmed cases in a country out of the total population of that country
Mortality rate(%) is total deaths in a country out of total confirmed cases in that country due to COVID-19
We can see that the US has a very high infection rate (7.04%) as compared to the worldwide infection rate of 1.22% whereas the mortality rate of the US is relatively low (1.67%) as compared to a worldwide mortality rate of 2.15%. A high infection rate & low mortality rate signifies that a higher percentage of the country's population has been infected (probably due to lenient covid restrictions, higher testing rate) but the fatalities are not that high (due to better health infrastructure in the country). Similarly, you can look at the infection & mortality rate of Top countries and get an idea of the extent of covid restrictions, testing rate & health infrastructure/facilities in that country
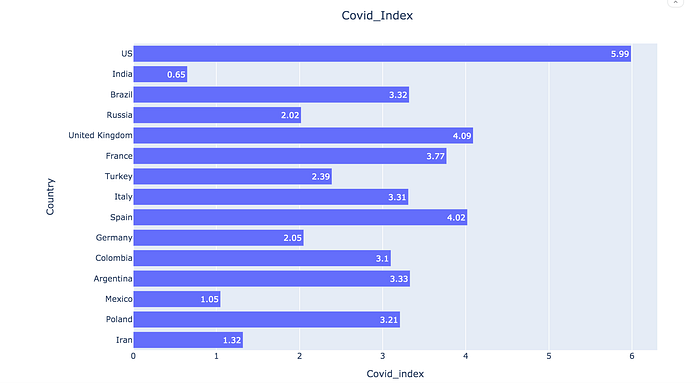
iv) Covid Index of Top 15 worst-hit countries
"Covid_Index" is a derived metric that is calculated as
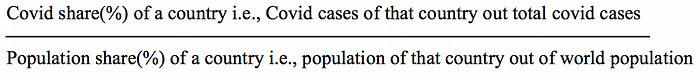
A higher index indicates the country has been more impacted by COVID-19 as compared to other countries. US has a COVID index of ~6 since the US has a covid share of 25.4% i.e., the US contributes to 25.4% of worldwide COVID cases whereas it has a population share of only 4.24% i.e., the US contributes to 4.24% of the world population
Time Series visualization of COVID-19 cases & deaths
Till now, we explored the latest data and trends of Covid-19 cases and deaths. In this section, we will explore the COVID-19 impact & trend over time across different countries
Most affected countries over time
i) Bar chart race of Cumulative cases worldwide
Here, I've created a bar chart race depicting cumulative COVID-19 cases over time across countries. It also depicts the trend of most affected countries over time (starting Janཐ till now). You can use bar_chart_race package to create this visualization
COVID-19 cases Worldwide
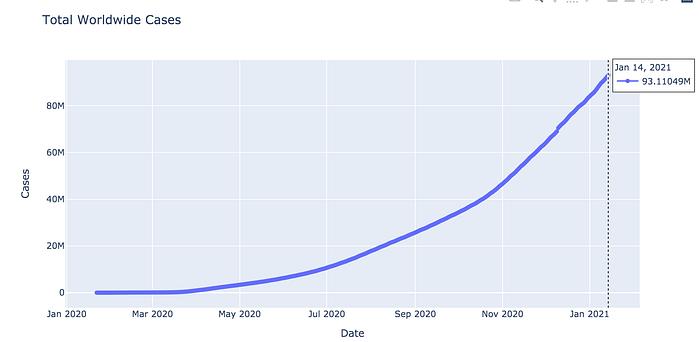
ii) Cumulative cases worldwide:
The following chart depicts a time series chart of cumulative cases worldwide right from the beginning of the outbreak.
iii) Cumulative death cases worldwide:
The following chart depicts a time series chart of cumulative deaths worldwide right from the beginning of the outbreak

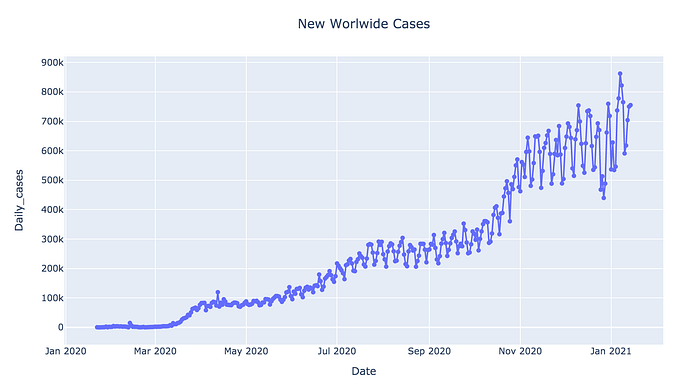
iv) Daily new cases worldwide:
The following chart depicts a time series chart of daily new cases worldwide right from the beginning of the outbreak
v) Daily death cases worldwide:
The following chart depicts a time series chart of daily death cases worldwide right from the beginning of the outbreak.

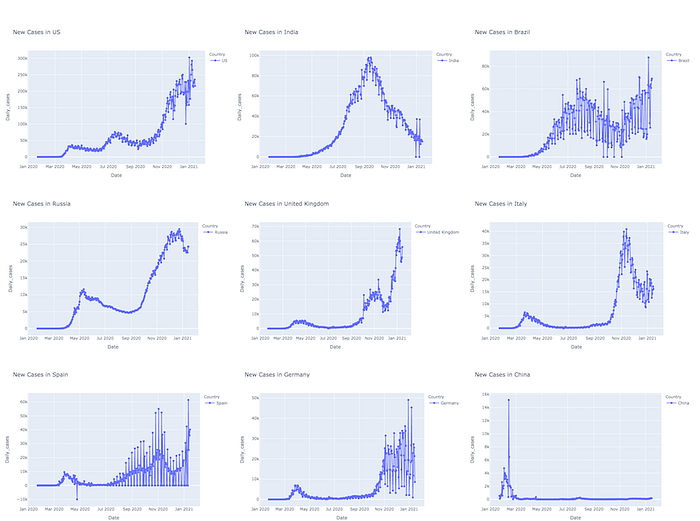
vi) Daily new cases worldwide (worst-hit countries)
Conclusion
We completed creating our own COVID-19 report with Python. Hope you find this article informative and useful. You can find the full analysis along with the code here. You can further explore and create your own reports and dashboards using this dataset