
From personal experience to a replicable process, a step-by-step guide to calculate flow metrics using Apps Script, Google Sheets and GitHub API.
TL;DR
- Calculating flow metrics simply requires Start and End dates.
- Connecting to the GitHub API, we can calculate cycle time, throughput, work in progress counts and work item age for pull requests and issues from created_at and closed_at.
- A free GitHub API connected spreadsheet for anyone who wants to get started quickly.
How It Started
My interest in data goes all the way back to my time as a software developer. When I transitioned into Agile Coaching and began collaborating with different organizations, I became even more motivated to support the teams I was working with by applying the theories I was reading about.
For example, the more I read about flow, the more I noticed day-to-day hiccups that pointed to systemic flow problems. I realized it was useless to limit our feedback to only JIRA data when so much more was happening elsewhere in the infrastructure. At one company, I decided to complement the JIRA data that team leads were using in their retrospectives with flow metrics from their pull requests and CI pipelines.
To do this, I had to integrate with GitHub and CircleCI. I remember partnering with a fellow Agile Coach and the excitement we felt about providing rich feedback to the leads and managers about their teams' habits around pull requests.
Fast forward to a few days ago, when Christian Neverdal asked on the ProKanban Slack channel if anyone had ever calculated the work item age for GitHub issues. Most of the artifacts I had built were lost somewhere in that company's cloud infrastructure, but I was confident I could replicate the process.
This article was born from that experience — a way to share the process with you and keep it safe in the internet's infinite memory.
The GitHub API
Like most APIs, connecting to the GitHub API requires some form of authentication. The easiest method I found was to generate a Personal Access Token. While both Fine-Grained Tokens and Classic Tokens presumably work, I opted for the Classic Token, and it worked without a hitch. Once generated, I passed the token in the Authorization header as follows:
{
...
 headers : {
    "Authorization" : `Bearer ${token}`,
    "Accept" : "application/vnd.github.json"
  }
}
At this stage, it was a matter of putting the theory into practice. I quickly went through the GitHub API documentation to find the relevant start and end dates. As it turns out, both pull requests and issues have timestamps in their response bodies, specifically in the created_at and closed_at fields.
This discovery made things much simpler than I had anticipated. Using Apps Script, I formatted the API responses I received and returned a CSV-formatted array, which Google Sheets then correctly interpreted as rows and columns.
The Dashboard
Once I had the data in the spreadsheet, it was time to connect the dots with some basic processing. I needed to calculate a few key metrics:
- Calculate Cycle Time, (Finish Date — Start Date)+1, or, since I was in the spreadsheet, DAYS(Finish Date, Start Date)+1
- Calculate Throughput — since I am returning weekly throughput, I needed to group the finish dates in their corresponding week number, and ran a COUNTIF() function to see how many items were finished in a given week
- Calculate WIP — for this I had to first calculate day-on-day WIP changes (i.e. items created, items closed). These were then grouped in their corresponding week numbers, which allowed me to do MAX, MIN, AVG, MEDIAN as I pleased
- Work Item Age — this simply gets those items which are still "open", and I then calculate the difference between the current day (TODAY()) and the created_at date
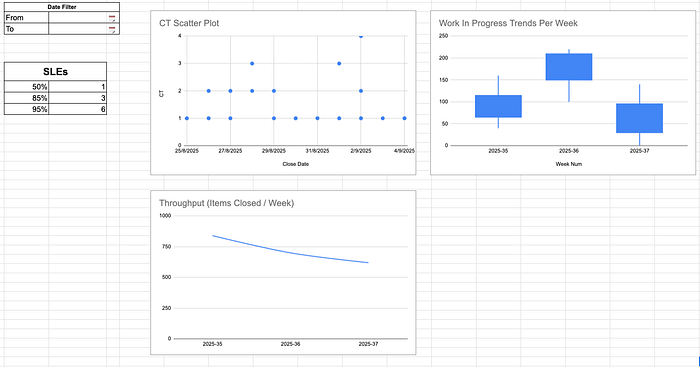
I then added some finishing touches, like a Date Filter, and the dashboard was ready to be shared with you.