If you're an active developer working on the web, chances are you use Chrome DevTools a lot. When it comes to developing modern applications on the web, DevTools is a necessity. Working on the web without DevTools would be like flying a plane with no windows. We may get to where ever it is we're going, but it's going to be way harder than it needs to be.
Before we get started, if you want to follow along, be sure you have DevTools open in your browser. You can do that by hitting command+option+J on the mac and control+shift+J on windows.
Without further ado, here are 5 MORE Awesome features in Chrome DevTools.
debugger;
I use this one all the time. Often times you're working with a large code file and need to see what's happening on a specific line of code.
You could open the Sources panel, search for the location you're interested in, and set a breakpoint. Try this instead. Go to your code editor and drop a debugger statement in the area you're focused on. The debugger statement is functionally identical to a standard breakpoint.
On the next page execution, the debugger statement will trigger and execution will halt giving you the opportunity to check variables and step-thru your code.
For example, here I have a page that's part of a React app that performs a search. I suspect I have a problem in the onTextChange event handler so I drop a debugger statement in there to see what's up. Here it is in action.
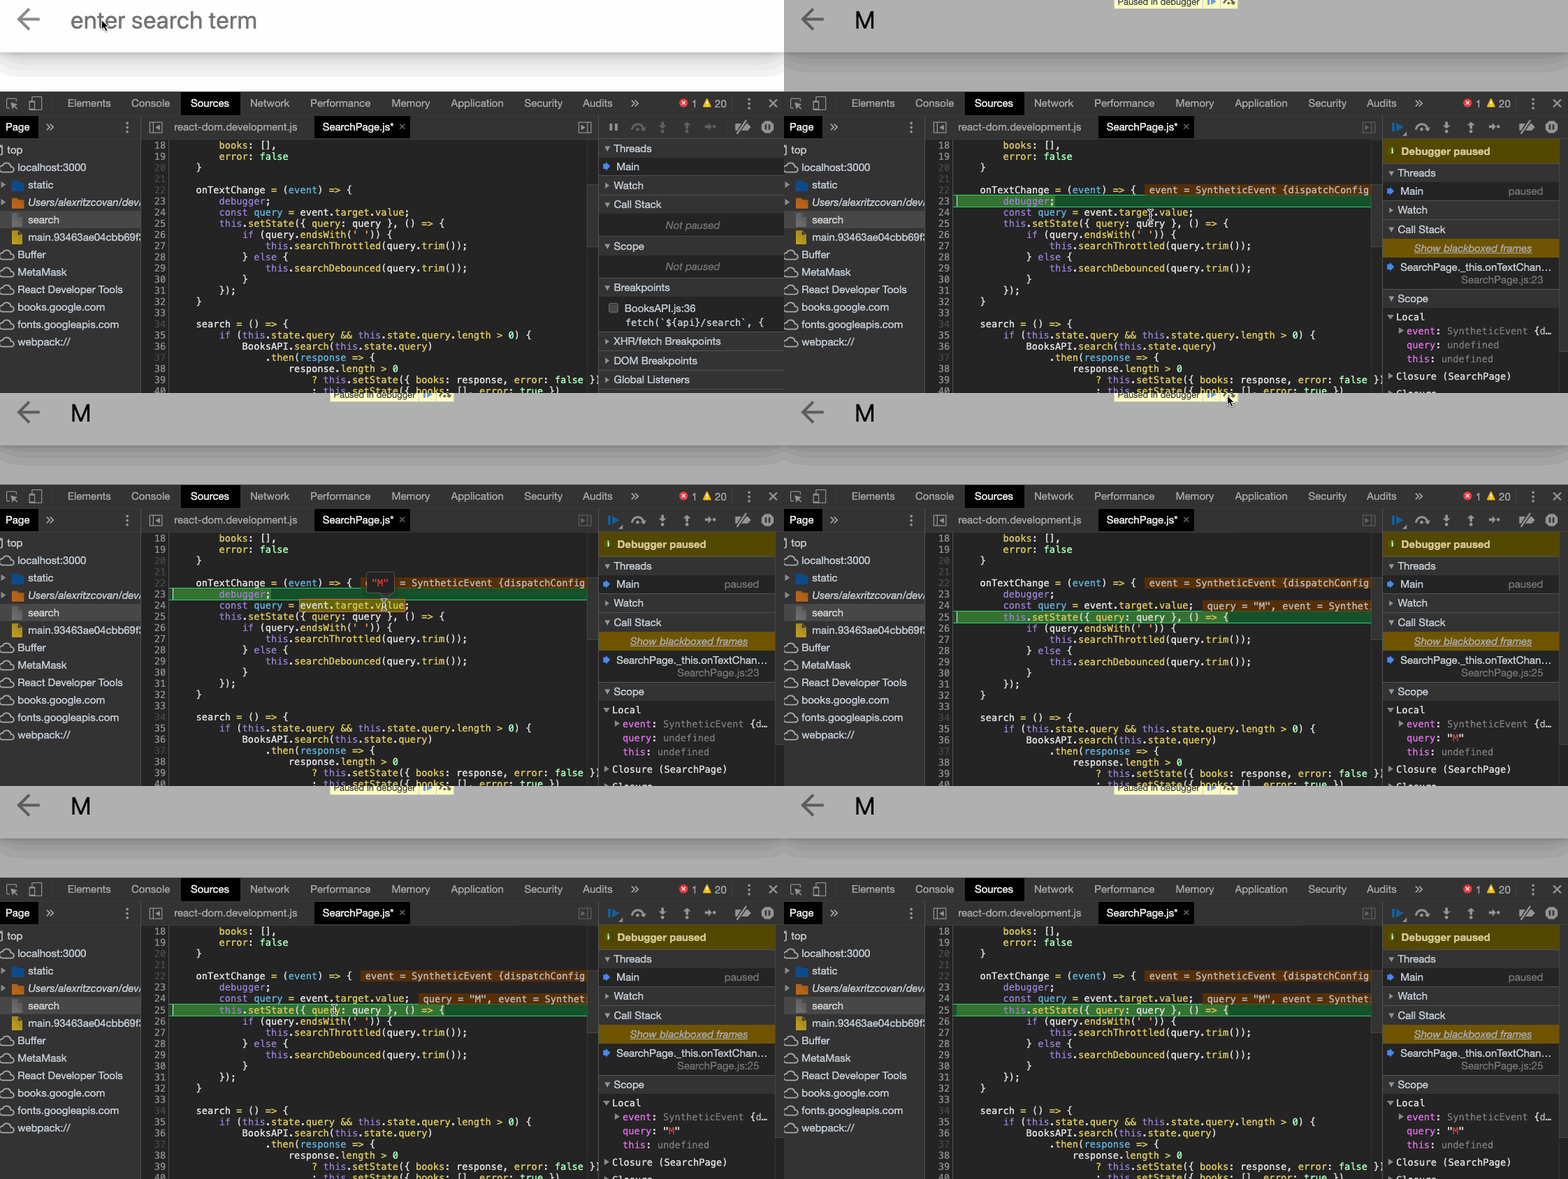
I usually use the debugger statement in any place that I would have used a console.log() but I find working with debugger is quicker and easier. What's not to like?
Blackbox Script
This one can work hand in hand with debugger. Often times when debugging and stepping through your code, the debugger will jump out of your code and into some vendor code. This can be time-consuming and annoying. Also, it's a pretty good bet that whatever the issue is, it not in the vendor code. To avoid this interruption, Blackbox the vendor code and the debugger won't step into it going forward. Check this out:
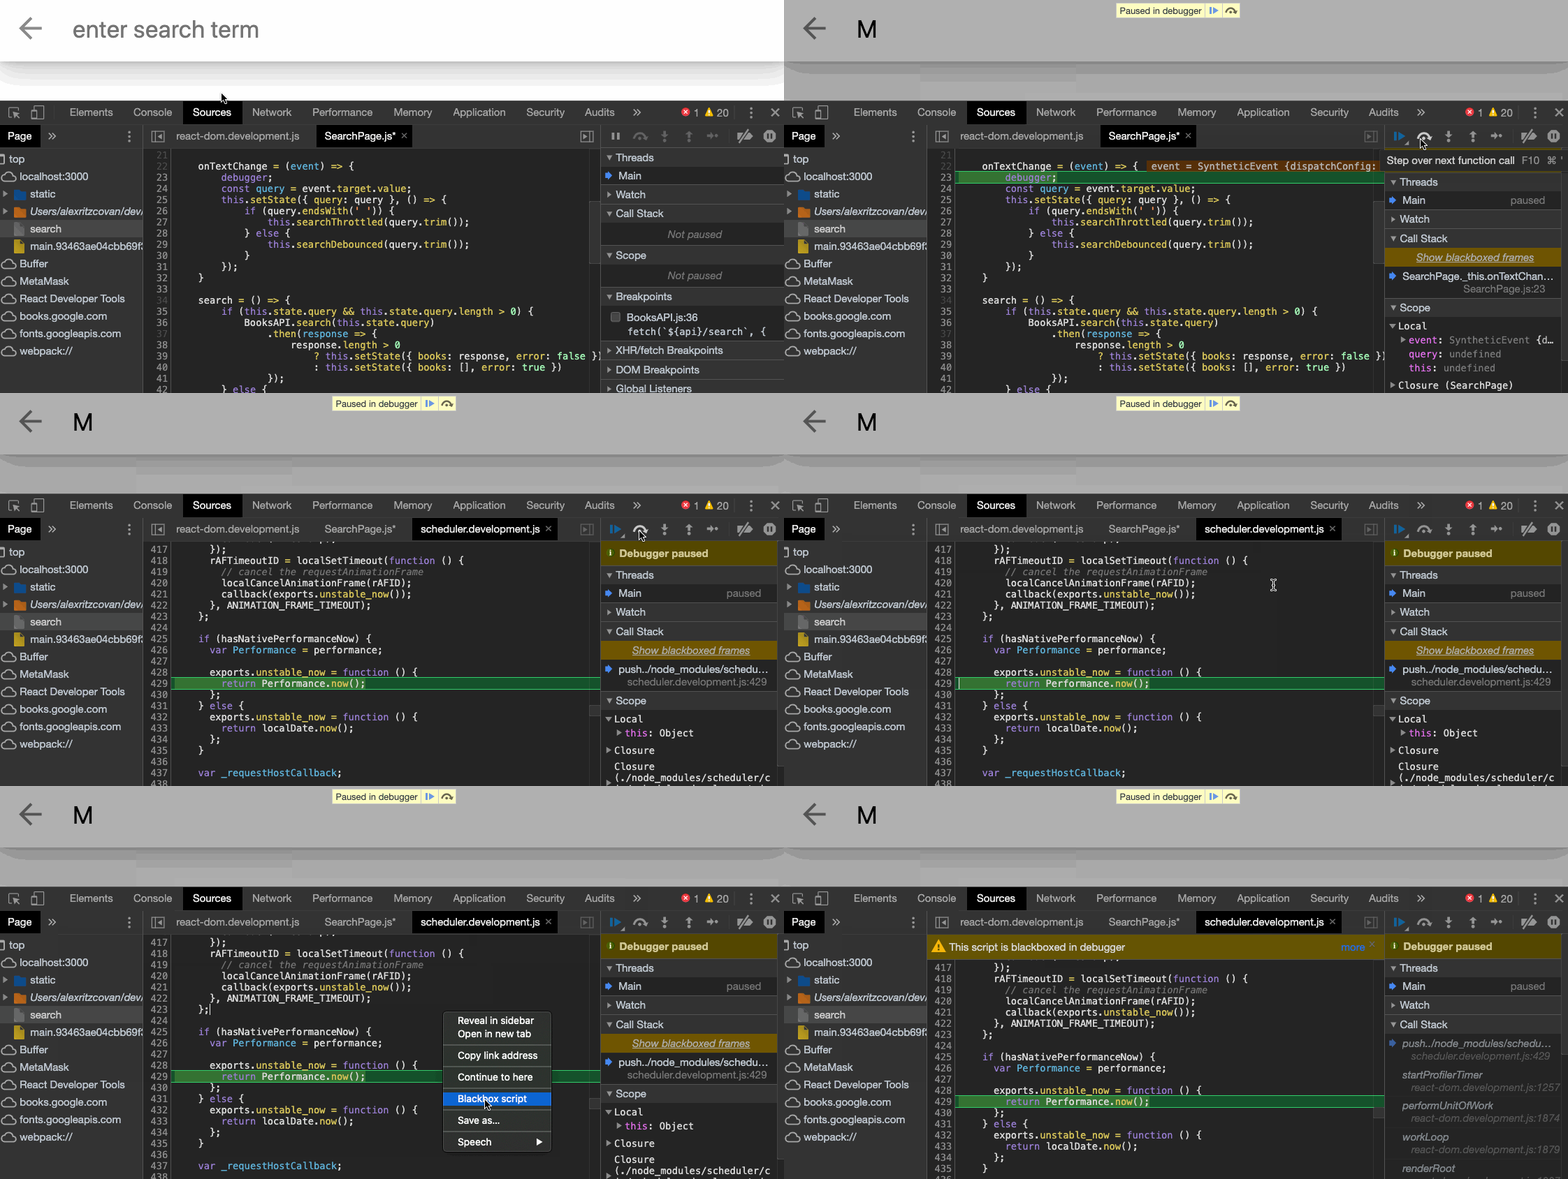
If you decide that you no longer want or need the vendor code to be blackboxed, just right-click the file in the sources panel and choose 'stop blackboxing.'

No more wasted time looking at vendor code!
Event Listener Breakpoints
Let's speculate that you're trying to debug an issue related to an event. Maybe you need to target a mouse click and you'd like to break anytime that event occurs. There is no need to go hunting through your source to find the handler. Let DevTools do the work for you. Check it out.
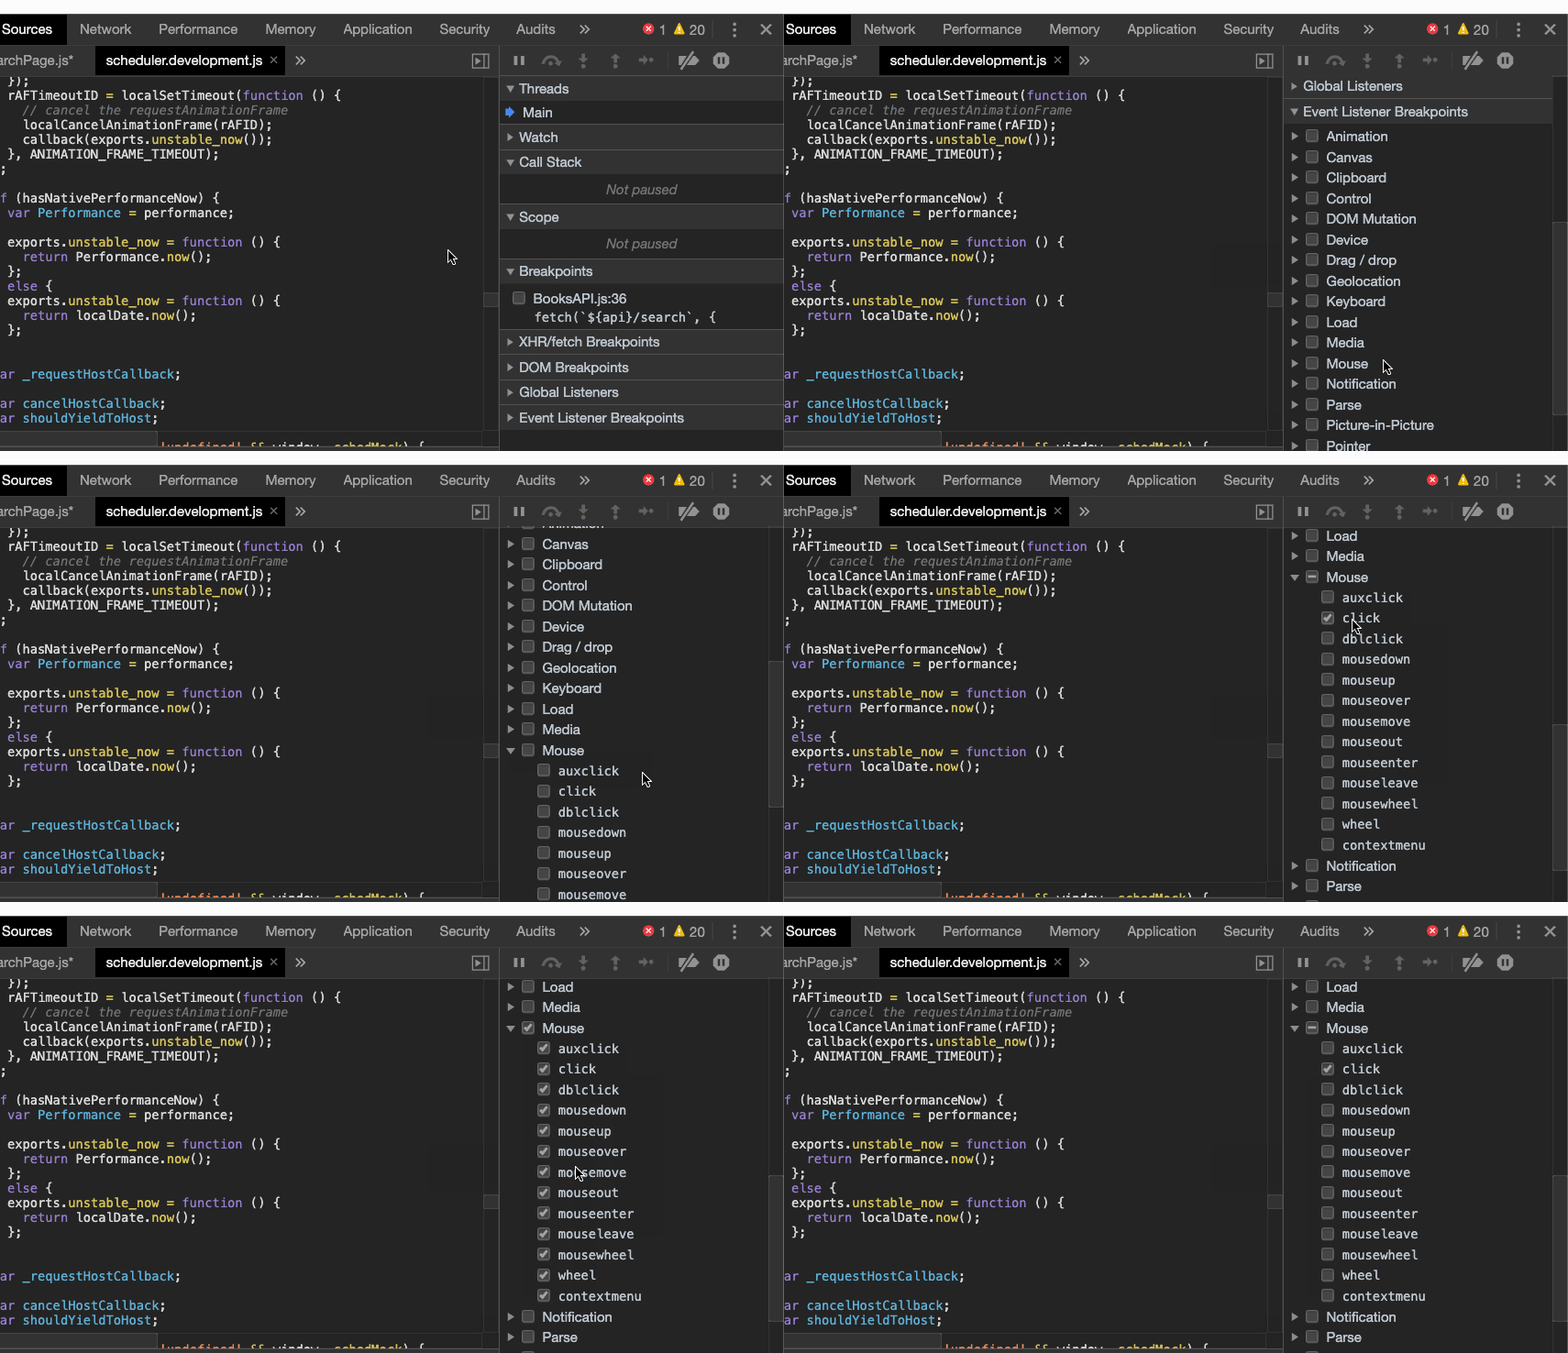
As you can see, we can choose to listen to only the mouse click event or we can choose any event related to the mouse. Also, we aren't restricted to just mouse events. We can capture any event from any object on the page. Super useful!
DOM Breakpoints
This is another one of those DevTools features that you didn't know you needed. Working with modern web applications is not like the old days when the world was all static pages. Pages are very often dynamic and undergoing changes all the time. Using DOM breakpoints you can isolate a DOM element and have execution stop when that element is changed.
Let's open the Elements pane and set a breakpoint on a DOM node.
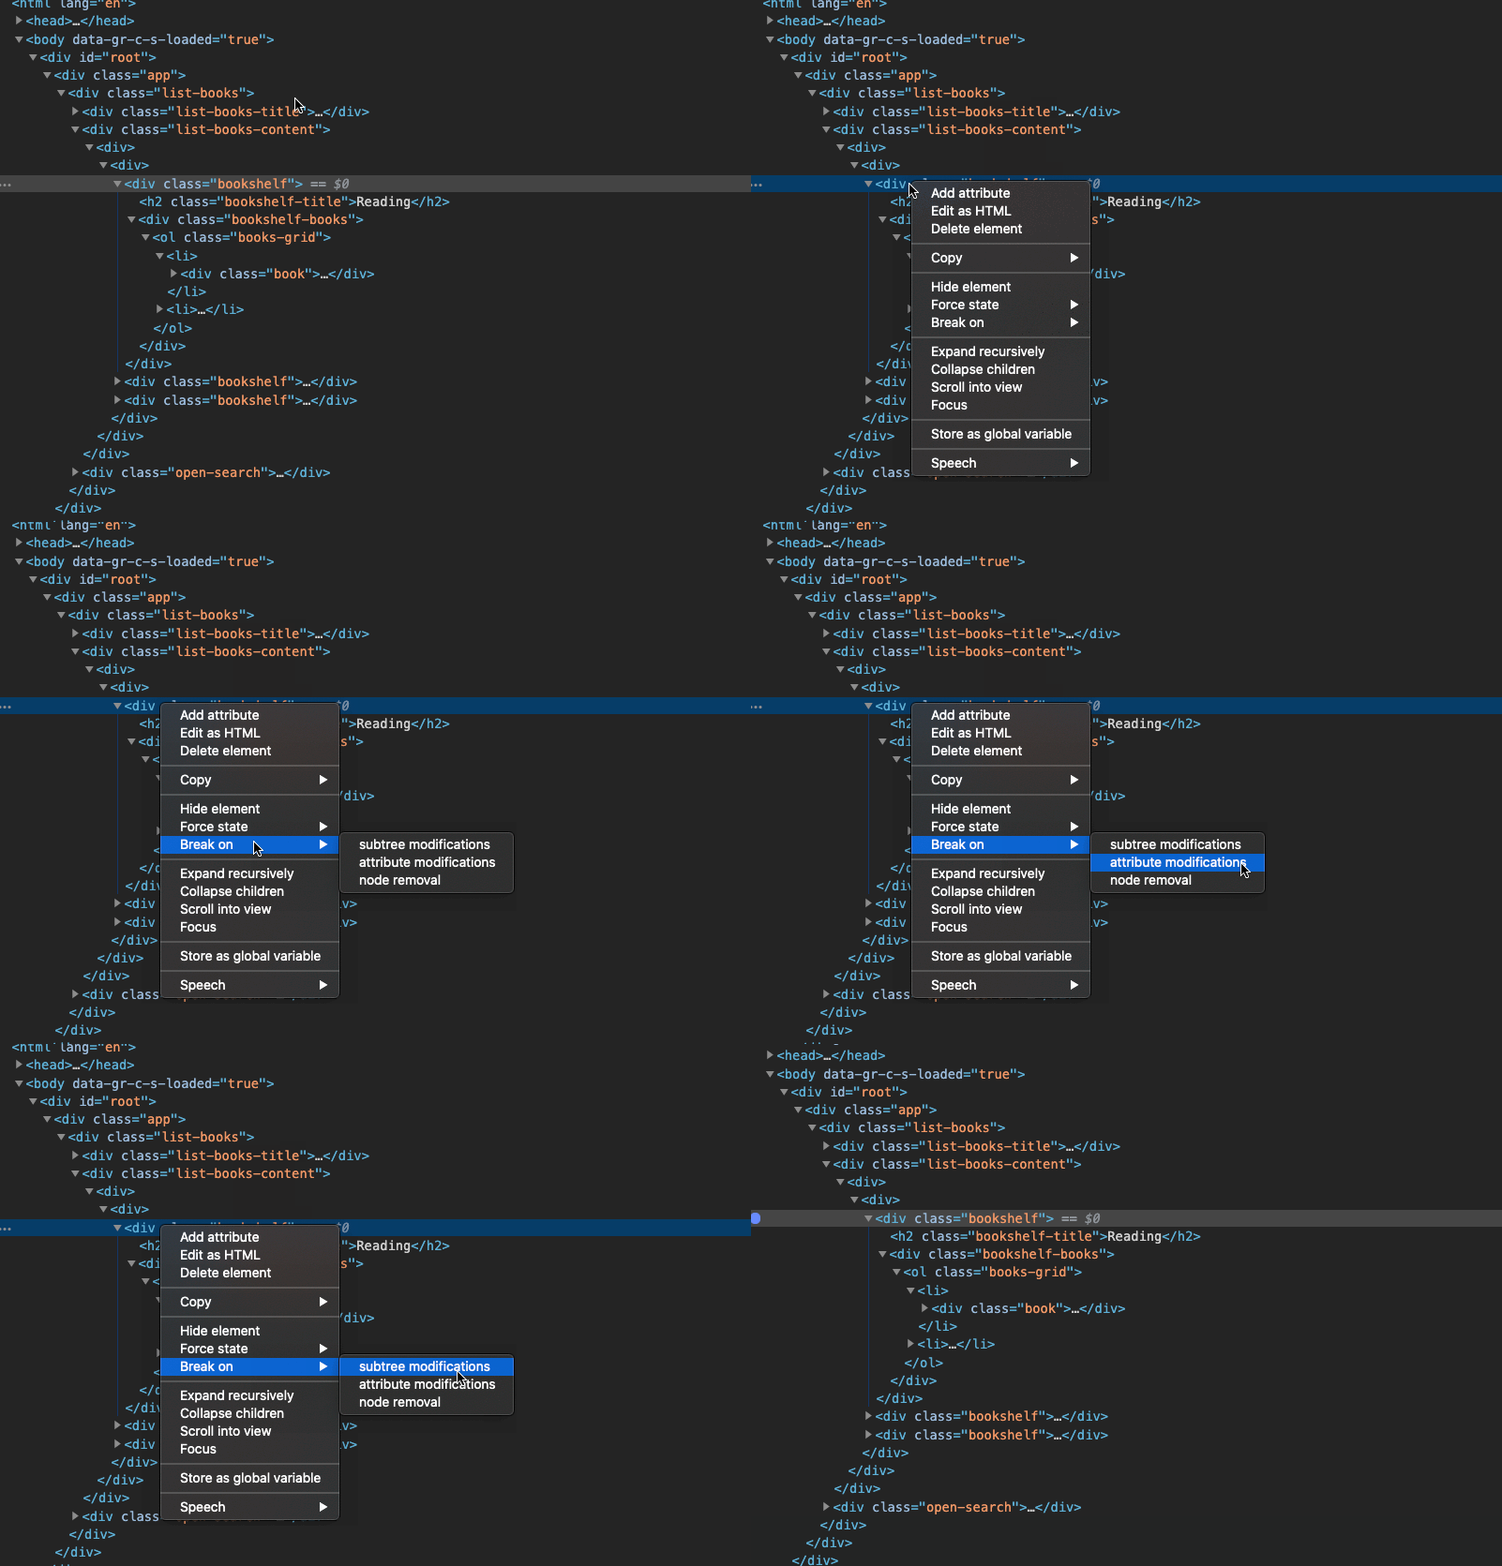
We can break on multiple conditions if we need to. Here we are choosing subtree modifications. With our breakpoint set, let's interact with the UI and cause it to trigger.
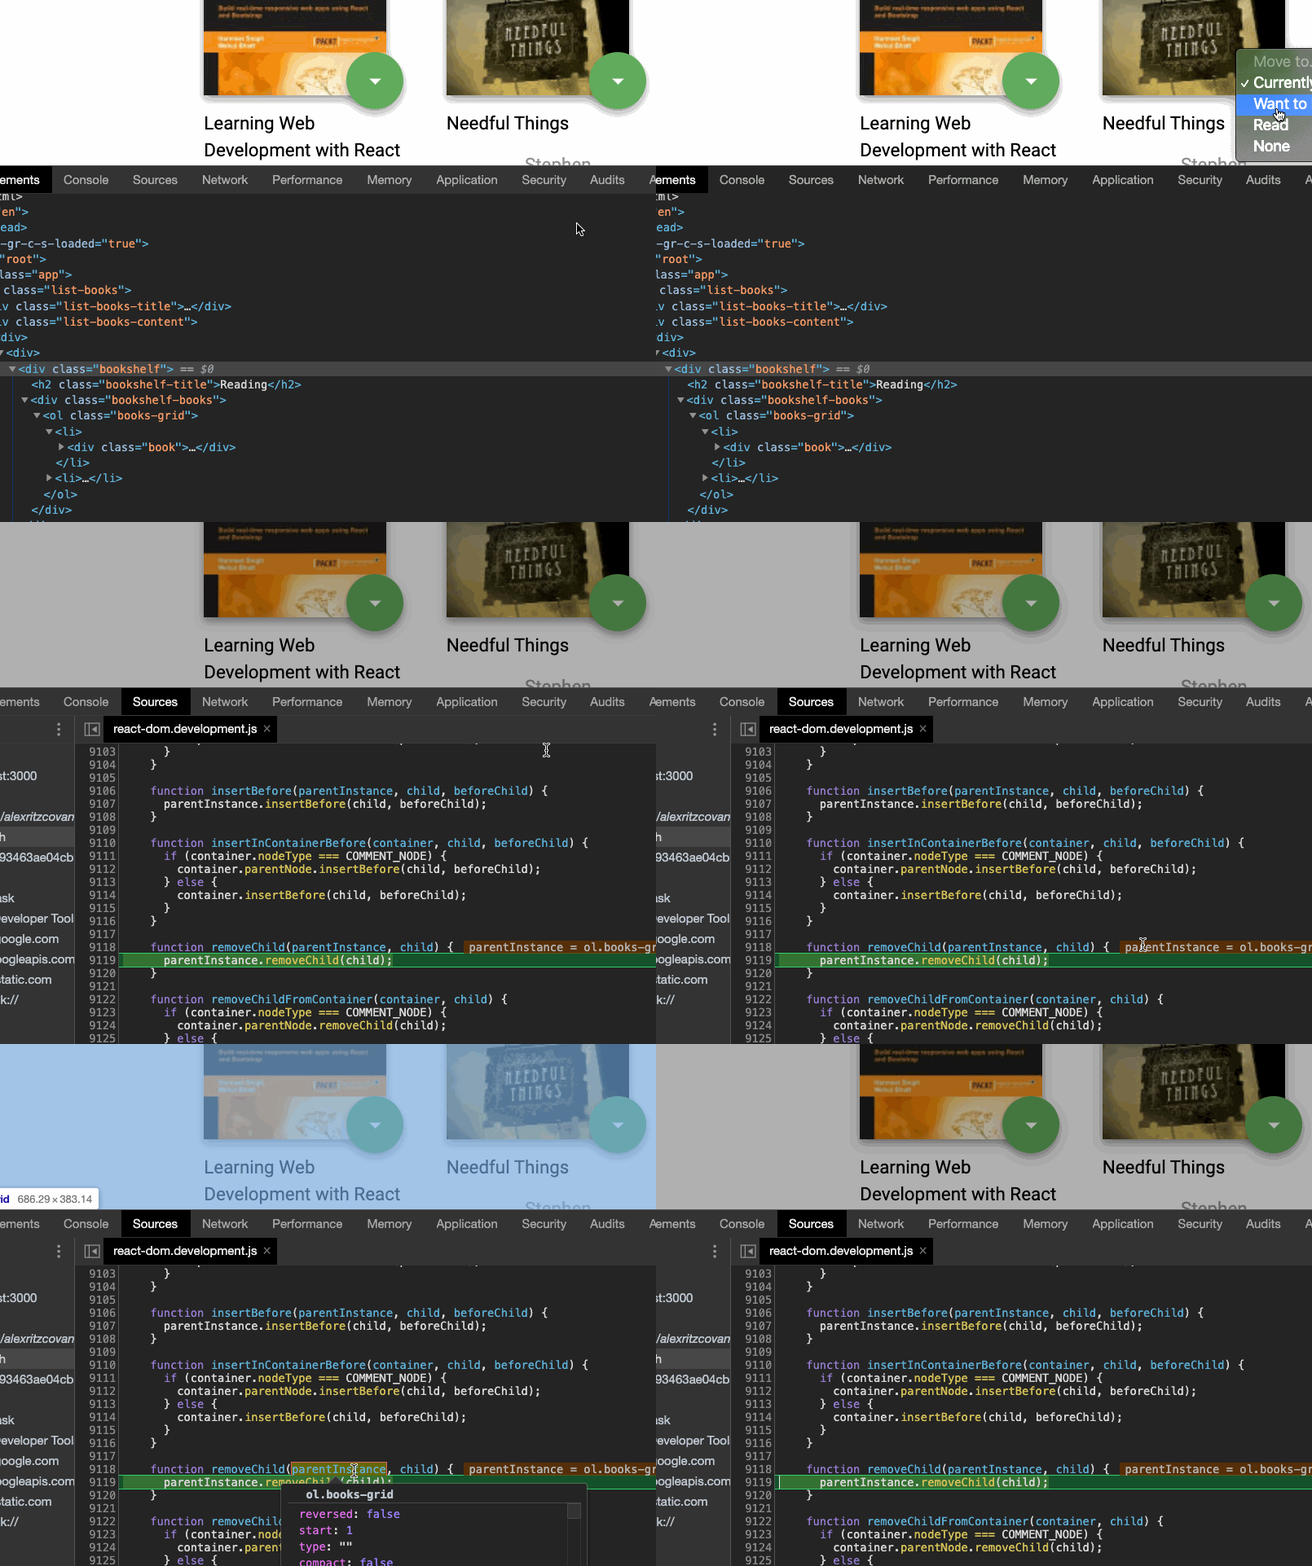
When the breakpoint is triggered, DevTools jumps to the Sources panel and highlights the code that's modifying the DOM.
The Command Menu
When working in DevTools or any development environment, a goal should be to keep your hands on the keyboard. Taking your hands away from the keyboard to manipulate the mouse is inefficient and burns a ton of time. The solution? The command menu!
To open the command menu, once DevTools is open, enter control+shift+p on windows or command+shift+p on the mac.
Let's use the command menu to switch between the panels without using the mouse:

Next, let's move where DevTools is docked:
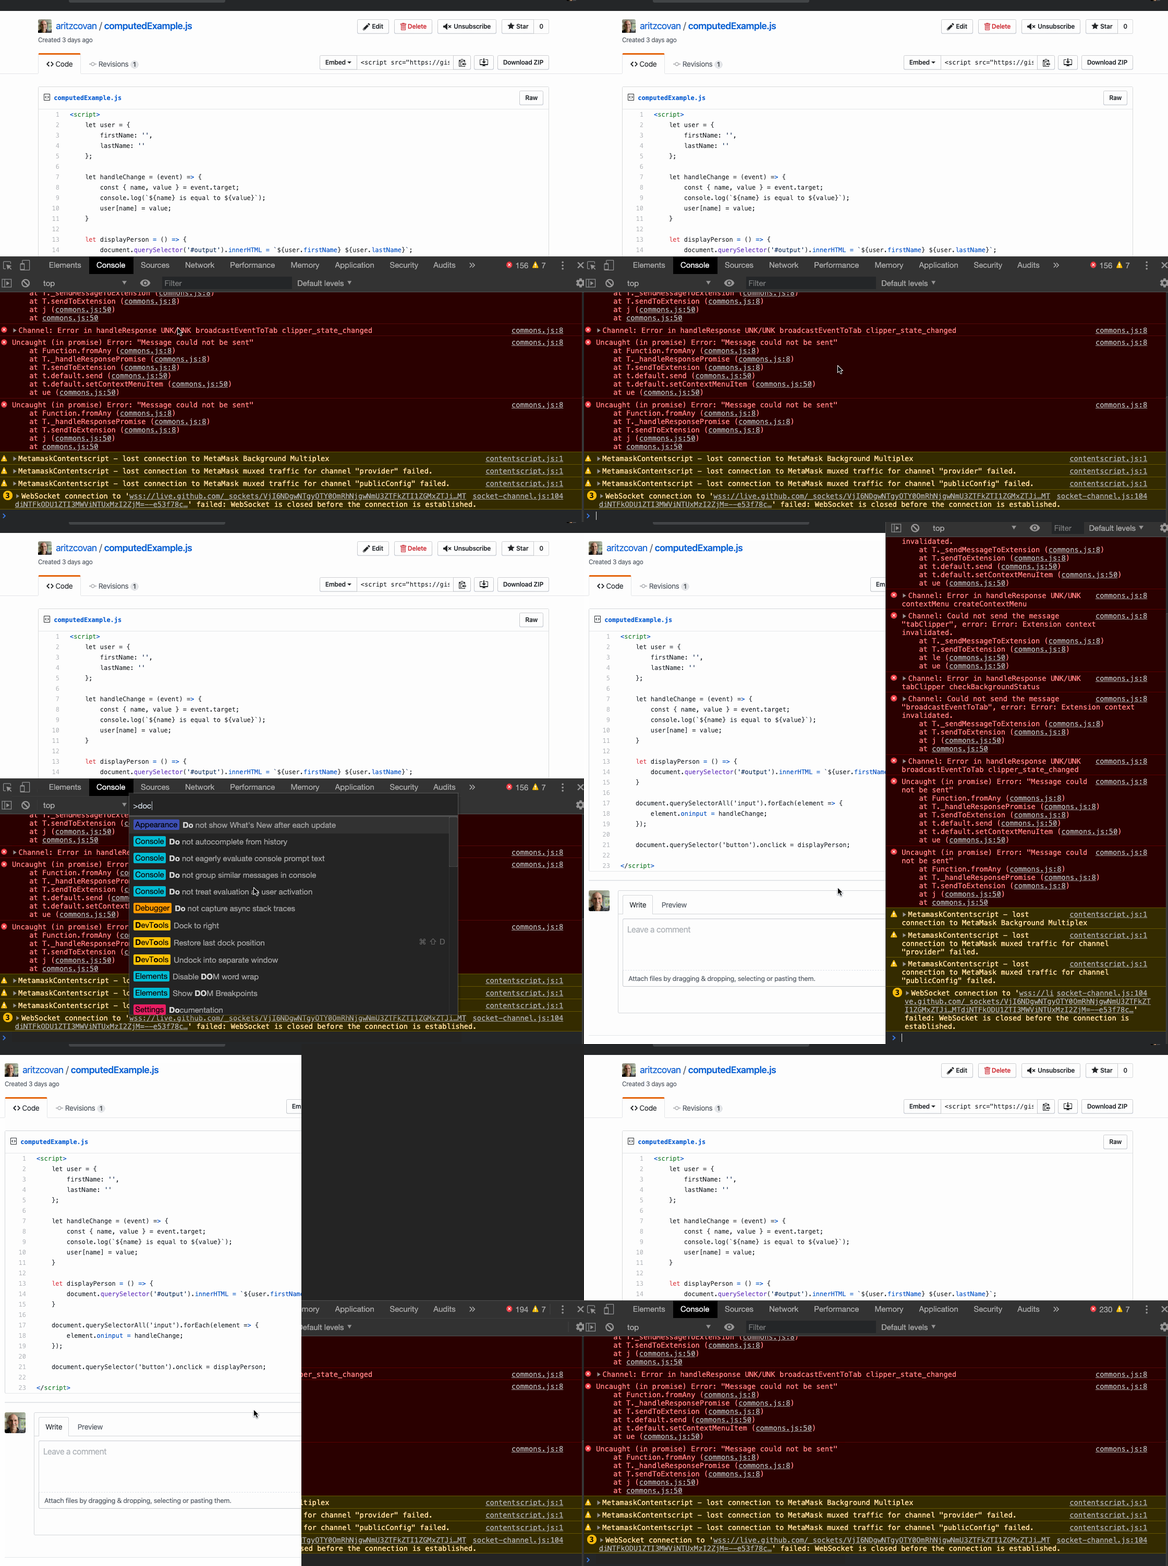
Let's take a screenshot that we need to share with a co-worker.
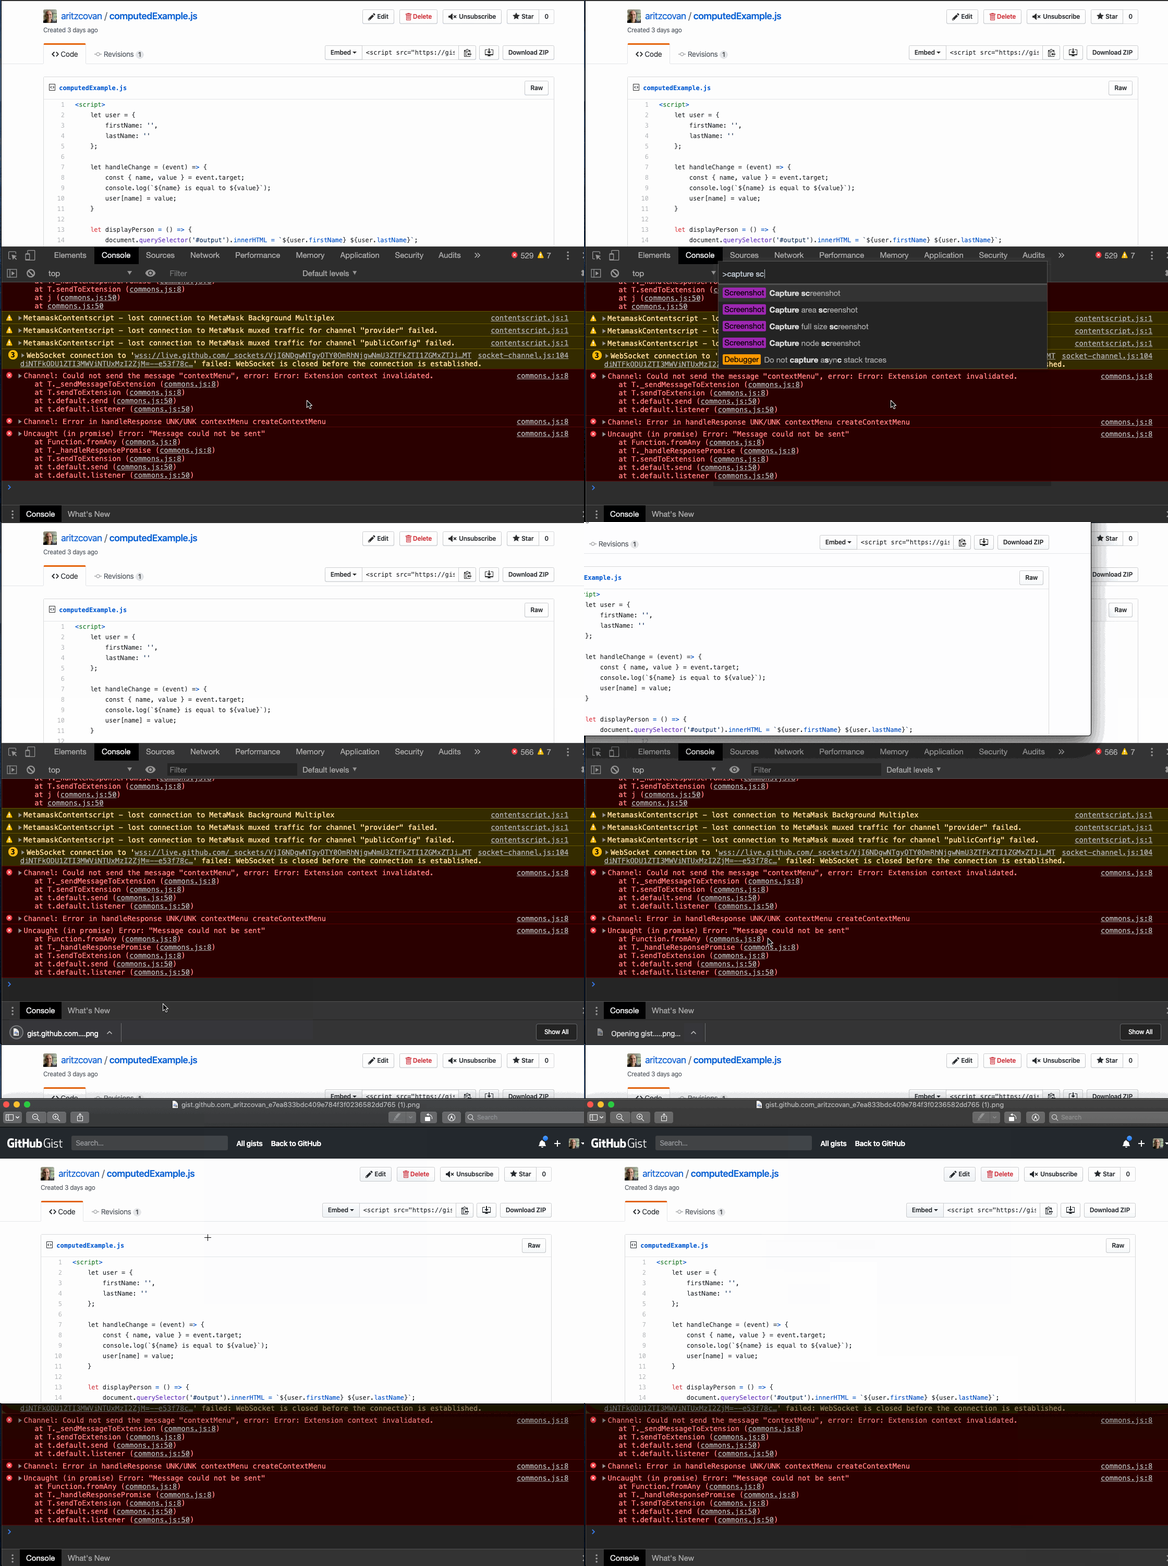
There are a ton of other features built into the command menu. To get acquainted, just open up the menu and scroll thru to see what's available.

Using the command menu may slow you down a little at first but it's well worth the investment. Take the time to learn it well and you will achieve greater productivity.
And there you have it, 5 more Awesome features in DevTools.
Key Takeaways.
- Use the debugger statement to stop the execution of your code. Try it where you would normally use console.log().
- To avoid stepping into vendor code while debugging, Blackbox those vendor scripts.
- Use the Event Listener Breakpoint panel to set and trigger breakpoints on any event on the page with ease.
- Use DOM breakpoints to halt execution when a DOM element is modified.
- Learn to love and use the Command menu. It will save you time and make you a more efficient developer.
This post is a follow up to 5 Chrome DevTools Utilities You Need to Know so check that one out.
As always, thanks for reading and if you liked this post, please share it and be sure to check out my other posts here on Medium.
Thanks again and happy learning.

